
 ?Mathematical formulae have been encoded as MathML and are displayed in this HTML version using MathJax in order to improve their display. Uncheck the box to turn MathJax off. This feature requires Javascript. Click on a formula to zoom.
Abstract
We conceptualize and test a non-intrusive barrier, comprised of an oblique bubble screen (OBS) oriented at an angle to the mean flow, to prevent the downstream dispersal of invasive carp egg surrogates. Three surrogates of different densities and diameters were tested. Secondary flows created by the OBS were tuned to redirect surrogate eggs to facilitate their capture. Surface particle image velocimetry and acoustic Doppler velocimetry were used to characterize secondary flows. We assessed the influence of airflow rate, OBS angle, mean flow velocity, and surrogate density on particle redirection. In general, redirection efficiency improves by increasing the OBS angle with respect to the cross-section. At a mean flow velocity of 0.75 metres per second (m/s), the OBS system redirected up to 60% (%) of positively buoyant particles (specific gravity SG = 0.9, and diameter d = 7.09 millimetres [mm]) and 40% of semi-buoyant particles (SG = 1.001, d = 3.1 mm). Negatively buoyant particles (SG = 1.04, and d = 5.90 mm) were redirected by the physical structure of the diffuser rather than by OBS-induced flow. The study shows that an OBS system can be used to effectively redirect carp-egg surrogates over a wide range of particle sizes and densities, allowing for selective targeting of undesired particles in streams.
1. Introduction
Invasion of non-native biological species can have harmful effects on native species, local ecosystems, and the economy of the regions linked to that ecosystem (Pimentel et al. Citation2005; Lodge et al. Citation2006). Globally, fish species have been introduced in high numbers into non-native regions, and, as a result, freshwater aquatic ecosystems are among the biomes most affected by non-native invaders (Gozlan Citation2008; Bernery et al. Citation2022). In North America, nearly 40% of fish species are categorized as imperilled (Jelks et al. Citation2008) and non-native species are the second highest contributor to this imperilment (Wilcove et al. Citation1998). Many of the introductions of invasive fishes have occurred as a by-product of interventions in aquaculture and agriculture, primarily driven by economic interests (Courtenay and Williams Citation1992; Milardi et al. Citation2020). For instance, four fish species native to Asia were introduced in the United States in the 1960s and 1970s, mainly for controlling primary producers or mollusks in aquaculture ponds or sewage treatment (Mitchell and Kelly Citation2006; Kolar et al. Citation2007; Kelly Citation2011; Kelly et al. Citation2011). These species, namely grass carp (Ctenopharyngodon idella), silver carp (Hypophthalmichthys molitrix), bighead carp (Hypophthalmichthys nobilis), and black carp (Mylopharyngodon piceus), make up the four major aquaculture carps, known in the United States as invasive carp. These are important food fishes, both economically and culturally, in Asia and in many other places (Kočovský et al. Citation2018). However, in some areas where they have been introduced, these carp have been identified as highly destructive invasive species (Kolar et al. Citation2007). The abundance of invasive carp has resulted in the reduction of zooplankton, along with a decline in the condition of native planktivorous fishes in the upper Illinois River (Irons et al. Citation2007; Sass et al. Citation2014; Pendleton et al. Citation2017). Also, with the presence of invasive carp, a reduction in populations of native sport fish has been observed in the upper Mississippi River due to competition for zooplankton between early life stages and invasive carp (Chick et al. Citation2020).
Deterrents that prevent movement have been proposed to control invasive carp populations and prevent dispersal to new aquatic ecosystems, as removing invasive fishes following their establishment is almost impossible (Leung et al. Citation2002). Preventing additional spread and movement is particularly important for invasive carp in the upper Mississippi River Basin because of the linkage to the Great Lakes ecosystem through the Chicago Area Waterway System. As such, controlling populations of invasive carp is among the five focus areas identified in the Great Lakes Restoration Initiative (Leung et al. Citation2002; USFWS Citation2010).
Different technologies have been developed and implemented to control the movement of invasive carp with the ultimate objective of stopping them from invading new ecosystems (Cupp et al. Citation2021). Progression of deterrent technologies generally begins in the laboratory and, if successful and feasible, transitions to field-scale trials before application. Examples of deterrent technologies tested in the laboratory and/or field include electrical barriers (laboratory—Holliman et al. Citation2015; field—Moy et al. Citation2011), bubble barriers (laboratory—Zielinski and Sorensen Citation2016; field—Zielinski and Sorensen Citation2015), acoustic barriers (laboratory—Vetter et al. Citation2015, Citation2017; Murchy et al. Citation2017; field—Riesgraf et al. Citation2022; Brey et al. Citation2023), strobe light barriers (laboratory—Dennis and Sorensen Citation2020), carbon dioxide (CO2) (laboratory—Kates et al. Citation2012; Cupp et al. Citation2017; field—Zolper et al. Citation2022; Raboin et al. Citation2023), and ensonified bubble barriers (laboratory—Dennis et al. Citation2019; Feely and Sorensen Citation2023; field—Fritts et al. Citation2023). Special attention has been given to non-physical deterrents (Noatch and Suski Citation2012) that can stop or deter fish passage while still safely permitting navigation and other activities in a waterbody. An electric barrier, tuned to immobilize fish when they attempt to swim upstream through the electric field, has been deployed in the Chicago Area Waterway System to prevent the upstream movement of aquatic invasive species between the Mississippi Basin and the Great Lakes Basin (Moy et al. Citation2011). However, Parker et al. (Citation2016) found that fish were more abundant immediately downstream of the electrical barrier, even at the peak voltage, and were observed to be persistently challenging the barrier, posing a risk of a breach in case of any discontinuity in the power supply. Some additional drawbacks of electric barriers include a reduced efficacy at deterring small fish, high energy consumption, safety risks for humans, unintended threats to native species, and potential passage of fish during disruption of the electrical field by the movement of metal barges (Dettmers et al. Citation2005; Davis et al. Citation2016, Citation2017; LeRoy et al. Citation2019). Barriers involving high-intensity light have shown success in stopping juvenile bighead carp in dark and dimly lit environments in the laboratory (Dennis and Sorensen Citation2020). However, the efficacy of light-based barriers depends on the species and ambient conditions, and light barriers can be an effective deterrent where depth and turbidity allow for light to penetrate the entire water column. Barriers based on acoustic stimuli (underwater acoustic deterrent system [uADS]) and their combination with bubble curtains showed high efficacy in deterring invasive carp in a laboratory flume (Vetter et al. Citation2015; Murchy et al. Citation2017; Vetter et al. Citation2017; Dennis et al. Citation2019). However, broadband sound alone was not effective in deterring common carp when tested in the field at a navigation lock on the Mississippi River, although the study was limited, and the authors identified a range of factors that may have affected the efficacy of the study (Riesgraf et al. Citation2022). In a pair of ongoing field studies, the interim results from multi-year deployments of a uADS system at Lock and Dam 19 on the Mississippi River and a multimodal deterrent system at Barkley Lock and Dam on the Cumberland River have both shown a reduction in the upstream passage of the invasive carp by about one-half (Brey et al. Citation2023; Fritts et al. Citation2023). A system of sound projected through a bubble curtain was capable of blocking more than 90% of bighead carp, silver carp, and grass carp in a laboratory flume and showed no signs of habituation (Feely and Sorensen Citation2023). In addition to the stated limitations, all the barrier technologies mentioned above focus on behavioural responses of juvenile or adult fish and rely on fish choosing to actively avoid specific deterrent stimuli (Moy et al. Citation2011). However, these stimuli fail to target early life stages, such as eggs and larvae, when organisms have no or a reduced ability to choose whether to avoid or follow a specific feature, and have movements directed by flow patterns. Thus, additional barrier types, with the ability to overcome weaknesses in existing barriers, would be beneficial to deter the movement of invasive carp and prevent further spread.
Harvesting of adult carps is an alternate approach used to suppress populations and prevent additional expansion of the current population (Altenritter et al. Citation2022). This intense effort using commercial harvesters is expensive for a large aquatic ecosystem and needs sustained efforts, often through contracted harvesting or harvest incentives (ACRCC Citation2018). In addition, an effective population control strategy harvests invasive carp at multiple life stages, including eggs and larvae, to effectively suppress population growth (Tsehaye et al., Citation2013). Control technologies that target early life stages of fish (e.g. non-motile eggs and larvae) have not been well developed and therefore represent a key gap in population-control capabilities. Together, existing strategies for deterring the spread of invasive fishes not only have inherent weaknesses that leave them vulnerable to fish passage but also fail to target early life stages that are critical for population control. The development of new barrier technologies capable of controlling the movement and abundance of eggs and larvae, could therefore contribute to effective control of populations of invasive fish and prevent additional spread.
We present a novel approach to reducing the survival of early life stages of invasive carp that relies on secondary flows generated by a series of oblique bubble screens (OBS). While the visual and audible presence of the bubble screens can deter upstream passage of adult carp (Zielinski and Sorenson Citation2016), we examine the ability of secondary flows generated by an OBS to control the downstream drift of surrogate eggs. An OBS can be considered a special case of multiphase plumes, consisting of air and water (Tekeli and Maxwell Citation1978). The inclination of a linear diffuser with respect to the cross-section of the flume can increase complexity. Air bubble screens have been used for different applications, including, but not limited to, aeration of sewer overflows, enhancing mixing in lakes, preventing shock waves, and restricting oil spills (Ditmars and Cederwall Citation1974; Buscaglia et al. Citation2002; García and García Citation2006). Many of these studies developed predictors for velocities and width of the zone of influence of the bubble screens (Kobus Citation1968; Ditmars and Cederwall Citation1974; Brevik Citation1977; Tekeli and Maxwell Citation1978; Socolofsky Citation2001). Recent applications used bubble screens at an oblique angle to the flow for removing floating trash at laboratory- and field-scales (Spaargaren Citation2018; Zhang et al. Citation2022). Presence of crossflow in the form of mean flow in the flume, and the oblique alignment of the linear diffuser with the flow, makes the OBS more complicated compared to typical two-phase plumes. The interaction of the OBS-induced currents with the crossflow distorts the bubble curtain and tilts it in the flow direction. Spaargaren (Citation2018) studied a laboratory-scale bubble barrier system aimed at redirecting floating plastic trash of different shapes and densities. They tested the redirection of drifting plastic objects by varying the angles of diffusers, crossflow velocities, and airflow rates, using empirical relations (Bulson Citation1968) and momentum balance equations to predict the bubble screen-induced lateral velocities. The first field-scale prototype of the bubble barrier was installed in Amsterdam, Netherlands, in 2019 to collect the floating plastic trash in a canal (TGBB Citation2019). The installation can effectively redirect the trash to a floating passive collection bin for removal. In a recent study, Zhang et al. (Citation2022) used a bubble screen to study redirection of positively buoyant plastics (with diameters ranging in size from 2–4 millimetres [mm] and 80–450 micrometres [μm]). Their results showed a high variability in trapping efficiency based on flow conditions for two different screen configurations (linear and chevron-shaped diffusers).
Physical properties of live invasive carp eggs are of particular interest in this study, which allows us to replicate flow-particle interactions using surrogates. Although water-hardened invasive carp eggs are slightly denser than water, they can remain suspended in turbulent river flows and survive until hatching (Yih and Liang Citation1964; Garcia et al. Citation2015; George et al. Citation2018). Newly hatched larvae can swim vertically (Chapman and George Citation2011) but lack horizontal swimming capabilities until the gas bladder inflation stage. Therefore, pre-gas bladder inflation invasive carp are subject to the hydrodynamics of streams, making hydraulic-based control efforts attractive.
The aim of the current study is to quantify the potential of an OBS for redirecting particles of different densities and diameters representative of invasive carp eggs to develop a novel control technology able to target invasive carp at early life stages. The novelty in this study lies in the application of secondary flows induced by the bubble screen as the only stimuli for redirection of the invasive carp eggs to aid with population suppression. We hypothesize that if an OBS can be tuned to redirect the positively buoyant, negatively buoyant, and the semi-buoyant particles used in this study, it may be capable of redirecting the semi-buoyant, water-hardened invasive carp eggs that fall within the range of densities tested.
2. Methods
2.1. Facilities
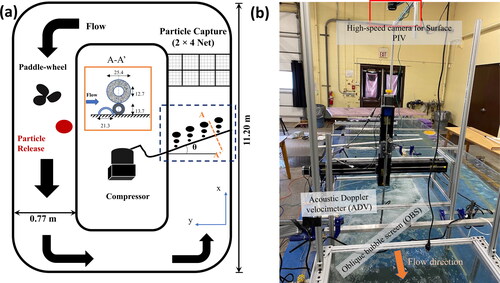
Experiments were performed in an 11-metre (m) long recirculating flume () located at the Ecohydraulics and Ecomorphodynamics Laboratory (EEL) at the University of Illinois Urbana-Champaign. A rotating paddle wheel drives flow, making it suitable for testing live eggs, larvae, or egg surrogates without damage that could be incurred from the use of a centrifugal water pump. The flume width (B) is 0.77 m and water depth (H) was kept at 0.4 m for all tests. Flow straighteners were removed from the flume to avoid any potential hindrance to particle transport during experiments. The OBS diffuser was made of flexible 2.54-centimetre (cm) (1-inch [in]) outer diameter aeration tubing (Pentair Aquatic Eco-Systems, Inc., Apopka, Florida, https://pentairaes.com/). The OBS diffuser tube was attached to a steel pipe of 1.27-cm (0.5-in) nominal diameter that keeps the diffuser rigid and fixed at the flume bed. A transition made of 1.9-cm (0.75-in) nominal diameter split-PVC pipe was attached to the upstream side of the diffuser to prevent particle entrapment between the diffuser and the bed (). A reciprocating air compressor (1471-Watt [2-Horsepower] motor with 114-liter [30-gallon] storage tank) was attached to the diffuser, with a gate valve controlling total air discharge. Total airflow rate (Qa) through the diffuser was measured with an inline air flowmeter (King Instrument Company, Inc., Garden Grove, California, https://kinginstrumentco.com/). A constant pressure of 2.07 × 10⁵ pascals (Pa) (30 pounds per square inch [psi]) was maintained at the outlet of the compressor in all the tests. The OBS was tested at three different inclination angles (θ = 30 degrees [°], 45°, and 60° as seen in ) to define the effect of angle on particle redirection. The inclination angle is measured with respect to the y-axis (perpendicular to the flow) as the reference (θ = 0°). Total length of the diffuser was adjusted depending on the angle to cover the entire width of the flume. Total airflow in the diffuser(s) was varied to keep the airflow rate per unit length (qa) constant for all three inclination angles. For each given airflow and inclination angle, diffusers were tested at three nominal mean channel velocities (U0 = 0.23, 0.45, and 0.75 metres per second [m/s]). This velocity range is generally consistent with observed mean cross-sectional velocities in the Sandusky River downstream from known grass carp spawning areas at spawning flows (Murphy and Jackson Citation2013; Embke et al. Citation2019; Jackson et al., Citation2019; Heer et al. Citation2020). Velocity profiles for the undisturbed incoming flow are available in the Supplementary Material.
Figure 1. (a) Sketch of the setup in the racetrack flume. Cross section of the diffuser system (A-A’ in ). Aeration tubing is attached to a steel pipe and a ramp made of split polyvinyl chloride (PVC) pipe (all dimensions in mm). (b) Picture for the overall setup focusing on the area around the diffuser seen from the downstream end of the oblique bubble screen (OBS) (photo credit: V. Prasad, UIUC); notice the surfacing bubble screen, mounted acoustic doppler velocimeter (ADV), and high-speed camera used for surface particle image velocimetry (PIV; red rectangle).
2.2. Hydrodynamics
2.2.1. Acoustic Doppler velocimetry
Acoustic Doppler velocimeters (ADV) (Nortek Vectrino, Nortek USA, Boston, Massachusetts, https://www.nortekgroup.com/) were used to collect point measurements of velocity. shows velocity data for the incoming flows at three different paddle frequencies. The mean incoming velocity (U0) is vertical-average of streamwise velocity profile, and all the near bed quantities are evaluated at a height above the bed [z] of 1.5 cm at three velocities (U0 = 0.23, 0.45, and 0.75 m/s), all within a fully turbulent regime. Detailed three-dimensional hydrodynamics were acquired for two different diffuser configurations (data acquisition locations shown in ): (a) OBS perpendicular to the mean flow (θ = 0°) without crossflow (U0 = 0), and air flow rate Qa = 5.10 cubic metres per hour (m3/h); 3 standard cubic feet per minute [scfm]); and (b) OBS with θ = 60°, U0 = 0.23 m/s, and Qa = 5.10 m3/h (3 scfm).
Figure 2. A schematic of the data acquisition using acoustic doppler velocimeter (ADV) while the diffuser is in operation. (a) ADV measurements with no crossflow (U0 = 0). Each point denotes the location of measurement on the Central plane. (b) ADV measurements with mean flow. Each asterisk denotes the location of a vertical profile of eight points in the vertical. Surface particle image velocimetry (PIV) field of view shown in a green rectangle. The solid black line represents the diffuser, and the dotted grey line shows the approximate location of the bubbles when they approach the water surface [cm, centimetres].
![Figure 2. A schematic of the data acquisition using acoustic doppler velocimeter (ADV) while the diffuser is in operation. (a) ADV measurements with no crossflow (U0 = 0). Each point denotes the location of measurement on the Central plane. (b) ADV measurements with mean flow. Each asterisk denotes the location of a vertical profile of eight points in the vertical. Surface particle image velocimetry (PIV) field of view shown in a green rectangle. The solid black line represents the diffuser, and the dotted grey line shows the approximate location of the bubbles when they approach the water surface [cm, centimetres].](/cms/asset/9f869eba-609b-4db0-9927-e39a3e5f1f56/tjoe_a_2332994_f0002_c.jpg)
Table 1. Summary of bulk flow parameters corresponding to the three nominal flow velocities (U0), including near-bed turbulent kinetic energy (TKEbed) and turbulence intensity percent (TIbed × 100), Reynolds number (Re), Froude number (Fr), and shear velocity (u*) [m, metres; cm, centimetres; s, seconds; Hz, Hertz].
To characterize OBS-induced hydrodynamics, velocity data were collected over a grid with spacing of 20, 10, and 5 cm in the longitudinal (x), transverse (y), and vertical (z) directions, respectively (). The topmost location in each profile had to be shifted 3 cm below the planned location of measurement due to the space constraints and water surface fluctuations. Therefore, the profiles are measured at z = 5, 10, 15, 20, 25, 30 and 32 cm. The origin, x = 0, corresponds to the upstream end of the bubble screen as it appeared on the surface. Measurements covered a length of 100 cm in the longitudinal direction at six cross-sections along the entire width. Data were acquired for 40 s (s) at 120 Hertz (Hz) at each point. A convergence analysis showed that streamwise velocity converged within a ± 5% error in just 20 s, even at locations with the highest concentration of bubbles. A similar convergence is achieved for root mean square values of velocity fluctuation (u’rms) in 17 s. ADV data were filtered using a kernel density based on a despiking algorithm (Islam and Zhu Citation2013) to remove spikes introduced by the bubbles.
Velocity fluctuations (u’) are obtained by Reynolds decomposition and are used to calculate the u’rms values.
(1A)
(1A)
Where u is streamwise velocity time series and U is time-averaged streamwise velocity. Similarly, v’ and w’ were calculated for the transverse and vertical components of velocities, respectively.
(1B)
(1B)
Near-bed turbulence intensity (TIbed), measured at z = 1.5 cm, is calculated as:
(2A)
(2A)
Turbulent kinetic energy near the bed (), measured at z = 1.5 cm, is calculated as:
(2B)
(2B)
Bulk Reynolds number, Re, is calculated as:
(3)
(3)
where D is hydraulic depth (same as the flow depth H for a rectangular channel), ν is kinematic viscosity of water at 20 degrees Celsius (oC), and U0 is calculated using a velocity profile upstream of the diffuser when the diffuser is off.
All the flows are subcritical, Froude number (Fr) <1, as defined by:
(4)
(4)
where g is acceleration due to gravity.
Shear velocity is calculated as:
(5)
(5)
where ρ is density of water at 20 °C (998.2 kilograms per cubic metre [kg/m3]) and bed shear stress (τb) is calculated as:
(6)
(6)
where C1 is a constant (0.19) from (Thompson et al. Citation2003). All relevant flow parameters for all tests are summarized in . The OBS system is intended to be used in the field for subcritical flows only, therefore, we have tested the OBS system only for subcritical flows in the laboratory (Fr < 1 for all three velocities).
2.2.2. Surface particle image velocimetry
Secondary flows generated by the OBS resulted in a flow field with high spatial variability. We used surface particle image velocimetry (PIV) to measure the flow field on the water surface using bubbles on the surface as tracers. The optical properties of the bubbles differ from the rest of the water surface momentarily when air trapped in the bubbles is about to be released at the surface. Once bubbles are on the surface, they travel along with water parcels as tracers. A high-speed camera (Edgertronic SC1, Sanstreak Corp., Campbell, California, https://edgertronic.com/) was set up 2 m above the water surface, looking downwards. Images were acquired at a sampling frequency of 120 Hz with a time between images of 8.3 milliseconds (ms). The field of view for PIV captured a longitudinal section of ∼0.8 m with the whole width of the flume. Images were pre-processed to remove background noise and analysed using the open source PIVlab software (Thielicke and Sonntag Citation2021).
2.3. Surrogate egg particles
We used three types of particles as surrogate eggs: (1) positively buoyant (PB) plastic spherical particles, d = 7.09 mm, specific gravity (SG) = 0.9 (Cospheric LLC, Somis, California, https://www.cospheric.com/); (2) negatively buoyant (NB) plastic spherical particles, d = 5.90, SG = 1.04 (Cospheric LLC); and (3) semi-buoyant (SB) hemispherical particles made of soy wax, mean d = 3.50 mm, SG ≈ 1.001 (DPS Wax, Inc., Kansas City, Kansas, https://www.dpswax.com/).
We characterized the particles by measuring their settling speed. Three randomly selected particles were dropped in a settling column filled with water at 23 °C and recorded with a high-speed camera. A Matlab (The MathWorks, Inc., Natick, Massachusetts, https://www.mathworks.com/) subroutine was written to calculate the instantaneous settling speed of the particles using consecutive frames from the video, obtaining terminal settling speed once the instantaneous settling speed converges to a constant value (e.g. Prada et al. Citation2018). Particle diameters, measured with Vernier callipers, and settling speeds are shown in . The SG range of the tested particles is generally representative of invasive carp eggs, as summarized in (George et al. Citation2017). The settling speed of the hemispherical SB particles was 0.5 cm/s. Because hemispherical particles of a given diameter and density settle at a lower settling speed compared to spherical particles, we estimated the settling speed of a perfectly spherical particle of the same diameter and density using the models given by Haider and Levenspiel (Citation1989). The settling speed of a sphere of the same material and diameter was estimated to be 0.7 cm/s compared to 0.5 cm/s for hemispherical particle (Haider and Levenspiel Citation1989). Settling speeds of SB particles of both the shapes compare well with the settling speed range of the live eggs of invasive carp as reported by George et al. (Citation2017) (also reported in ). Of all the particles tested, the SB soy-wax particles best represented the size, specific gravity, and settling speed of invasive carp eggs.
Table 2. Characteristics of the particles used as surrogates [mm, millimetres; cm/s, centimetres per second].
Table 3. Physical properties of water-hardened invasive carp eggs determined by George et al. (Citation2017).
2.4. Particle redirection and capture
We conducted three replicates for each configuration, with 50 particles released in each trial. Particles were released en masse at a fixed location in the parallel branch of the racetrack flume (). The presence of bubbles made it difficult to visualize the drifting particles, preventing the use of particle tracking analysis on the surrogate particles. To assess their trajectories, a custom-made 1.6-mm mesh-size net (Pentair Aquatic Eco-Systems, Inc., Apopka, Florida, https://pentairaes.com/) composed of eight cells () was placed downstream of the OBS to capture the particles and determine their location after passing through the OBS ( and ). Two equal rows covered a total depth of 50 cm of the flume (25 cm each row). Because the depth was kept constant at 40 cm, only 15 cm of the top row was submerged. The numbers of particles in each cell were counted after each trial to calculate the percentage of particles captured in each cell. An average percentage from the three replicates was used as a metric of capture efficiency. Three airflow rates were tested for each water velocity: zero, low, and high airflow rate (). In zero-airflow replicates, flow is modified only by the physical structure of the diffuser. Airflow per unit length of the diffusers were maintained the same to ensure a valid comparison among different lengths (summarized in ).
Figure 3. (a) Schematic for proof-of-concept experiments using positively buoyant particles including the four general trajectories of particles based on their final location (A, B, C, D). (b) Photo of semi buoyant (SB) particles being redirected as they pass through the oblique bubble screen (OBS). (c) Picture of the eight-cell net used for particle capture. (d) Sketch showing dimensions of net cells. The blue dashed line in (c) and (d) denotes the water surface level. [θ, diffuser angle; B, channel width; cm, centimetres] (photo credits: V. Prasad, UIUC).
![Figure 3. (a) Schematic for proof-of-concept experiments using positively buoyant particles including the four general trajectories of particles based on their final location (A, B, C, D). (b) Photo of semi buoyant (SB) particles being redirected as they pass through the oblique bubble screen (OBS). (c) Picture of the eight-cell net used for particle capture. (d) Sketch showing dimensions of net cells. The blue dashed line in (c) and (d) denotes the water surface level. [θ, diffuser angle; B, channel width; cm, centimetres] (photo credits: V. Prasad, UIUC).](/cms/asset/6fe794ec-f588-4fcd-b5fe-540cc28fbf73/tjoe_a_2332994_f0003_c.jpg)
Table 4. Airflow rates for diffusers of different angles (θ) and lengths, where Qa is the total airflow rate and qa is the airflow rate per unit length of diffuser [m, metres; h, hours].
We defined effective redirection in terms of the percentage of particles captured in the cells on the right bank (outer bank, at the downstream end of the OBS), namely cells A4 and B4. Effective redirection is used as the primary metric to evaluate the efficacy of the different configurations of the OBS in this study.
3. Results
3.1. Hydrodynamics of a bubble screen without a crossflow
The simplest setup was a bubble screen covering the entire width of the flume, placed perpendicular to the flume (θ = 0°) and without crossflow (U0 = 0). This case was used to characterize the bubble screen in terms of the surface velocity, bubble slip velocity, and extent of secondary flows in absence of crossflow for comparison to previous studies (). Data demonstrated nearly symmetrical secondary flows on both sides of the diffuser with maximum horizontal velocities observed near the surface (). Bubble-curtain models predict a zone of horizontal velocity away from the diffuser (surface current) in the top one-fourth of the water depth (Ditmars and Cederwall Citation1974; Buscaglia et al. Citation2002; Spaargaren Citation2018). We compared the maximum surface velocity, and depth of the surface current,
(EquationEquations (7)
(7)
(7) and Equation(8)
(8)
(8) ), with the models developed by Bulson (Citation1961):
(7)
(7)
(8)
(8)
where H = water depth, h0 = atmospheric pressure as head of water, and qa is the airflow rate per unit length of the diffuser.
Figure 4. Mean velocity vectors generated by the bubble screen in the absence of crossflow with the diffuser aligned perpendicular to the flume (θ = 0°). the colour scales show mean velocity magnitude in centimetres per second (cm/s) in the x-z plane (uxz).
A variable equivalent to vm (in Bulson Citation1968) is defined as the velocity magnitude in x-z plane in our analysis.
(9)
(9)
Uxz in absence of crossflow (θ = 0°, U0 = 0) is shown in , where maximum Uxz is seen near the water surface. A more quantitative comparison is done by using EquationEquation (7)(7)
(7) (Bulson Citation1968) that gives a value of vm = 0.386 m/s, whereas our data show Uxz = 0.358 m/s. The depth of surface current from EquationEquation (8)
(8)
(8) (Bulson Citation1968) is h/H = 0.31, compared to h/H between 0.25 and 0.37 in this study. Because the models are developed for no-crossflow conditions, OBS cases with a non-zero current cannot be compared using these predictors.
3.2. Hydrodynamics of the OBS in a crossflow
3.2.1. Flow field around the diffuser
We used ADV measurements to characterize flow around a diffuser for θ = 60° and U0 = 0.23 m/s. In the presence of a crossflow, recirculation is generally absent in the first three cross-sections, x = 0, 20, and 40 cm (hereafter referred to as the undeveloped region), but was clearly present at x = 60, 80, and 100 cm (hereafter referred to as the developed region as shown in ). The mean flow yields a bubble screen tilted away from the vertical in the direction of the flow, with the degree of tilting increasing with flow velocity. Bubbles get advected in the streamwise direction as they rise vertically, resulting in a tilted bubble screen. Two independent factors enhance the degree of tilting – (1) the flow velocity is lower near the bed because of boundary layer effects, and (2) bubble vertical velocity decreases as the bubbles rise in the water column (Kobus Citation1968; Tekeli and Maxwell Citation1978). The secondary flows are not developed under the surface for almost the first half of the OBS as seen at the surface. The secondary flows result in an increased longitudinal velocity in the downstream wake of the OBS and a decreased longitudinal velocity on the upstream side of the OBS.
In the developed region, between x = 60 cm and x = 100 cm, a clear recirculation pattern is seen in the vector plots. Recirculation on both sides of the diffuser is asymmetric, unlike the perpendicular diffuser without crossflow (), due to the oblique orientation of the diffuser and the limited space on the sides constrained by the flume walls. A vertical upward mean velocity component is observed at the core and in the developed part of the bubble screen, and a downward velocity component was observed at the wall. The downward velocity near the walls is enforced by the physical boundary and is a common feature for all cases with θ ≠ 0°.
A region of higher TKE was observed in the proximity of the bubbles (). The values are substantially higher compared to the flow in the absence of the bubble screens (given in ). Bubbles create a zone of high turbulence within the area of influence as seen in . The zones of higher TKE are consistent with the secondary flows created by the mean flows shown in . A substantial difference in the values of TKE was observed near the bubble screen indicating that the region away from the bubble screen is not affected by the turbulence generated by the OBS.
Figure 5. Mean velocities around the oblique bubble screen (OBS) in the y-z plane are shown using vectors. The colourmap shows streamwise mean velocity (U) as seen from the upstream (flow is into the page). The OBS system generated recirculation towards the downstream end of the diffuser [cm, centimetre].
![Figure 5. Mean velocities around the oblique bubble screen (OBS) in the y-z plane are shown using vectors. The colourmap shows streamwise mean velocity (U) as seen from the upstream (flow is into the page). The OBS system generated recirculation towards the downstream end of the diffuser [cm, centimetre].](/cms/asset/921d0532-6e63-4076-8ceb-7a62425fd4cc/tjoe_a_2332994_f0005_c.jpg)
Figure 6. Turbulent kinetic energy (TKE) calculated using acoustic doppler velocimeter (ADV) measurements for six cross-sections seen from upstream (flow is into the page). A zone of higher turbulence can be seen near the core of the bubble screen [cm, centimetre; s, second].
![Figure 6. Turbulent kinetic energy (TKE) calculated using acoustic doppler velocimeter (ADV) measurements for six cross-sections seen from upstream (flow is into the page). A zone of higher turbulence can be seen near the core of the bubble screen [cm, centimetre; s, second].](/cms/asset/d24fb3ec-23a1-4c9b-9686-3ac2cf7115a3/tjoe_a_2332994_f0006_c.jpg)
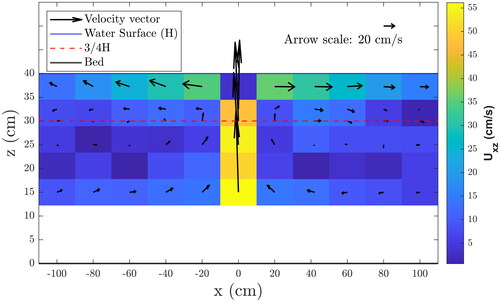
3.2.2. Flow field on the surface
The lateral velocity component at the surface is a key parameter controlling particle redirection. A ratio of the magnitudes of the lateral (V) and longitudinal (U) components, |V|/|U|, was used to quantify the lateral push a particle experiences as it drifts with the flow (). The lateral push generated by the secondary flow is highest at the lowest velocity, U0 = 0.23 m/s, and is concentrated on the upstream side of the diffuser. At the intermediate case, U0 = 0.45 m/s, the high lateral push region was slightly weaker and centred at the top of the bubble screen, with resultant velocity vectors corresponding to the highest |V|/|U| aligned almost parallel to the bubble screen. At the highest velocity, U0 = 0.75 m/s, the zone of highest |V|/|U| was still close to the location of the bubble screen on the surface. However, the magnitude of |V|/|U| was much lower compared to lower U0. For all three cases, the airflow rate per unit length was kept constant (values given in ). Achieving a lateral push (or |V|/|U|) near unity at higher mean flow velocities would require an increase in the airflow rate. The hydrodynamics on the surface can thus be used to gain insight into particle redirection, particularly for positively buoyant particles.
Figure 7. Mean velocity ratios |V|/|U| for three different mean flow velocities (U0 = 0.23, 0.45, 0.75 metres per second [m/s]) at an airflow rate, qa = 6 standard cubic metre per hour per metre length for the 60-degree diffuser [cm, centimetres].
![Figure 7. Mean velocity ratios |V|/|U| for three different mean flow velocities (U0 = 0.23, 0.45, 0.75 metres per second [m/s]) at an airflow rate, qa = 6 standard cubic metre per hour per metre length for the 60-degree diffuser [cm, centimetres].](/cms/asset/edb6d9e4-55c8-4847-ad29-468c237cb8d1/tjoe_a_2332994_f0007_c.jpg)
3.3. Particle redirection
We evaluated the efficacy of the OBS based on the number of surrogate eggs redirected to a desired location in the flume (the right, outer wall in this study). Preliminary experiments identified four general trajectories of particles based on their final location: (A) zone of recirculation, (B) full redirection along the bubble screen, (C) partial redirection at the further downstream end of the flume after particles pass through the diffuser, and (D) particle trajectories unimpeded as they pass through the OBS (). These preliminary experiments served as a proof-of-concept to determine the viability of the diffusers, showing different redirection patterns over different flow conditions, with higher lateral push resulting in higher redirection efficiency (Prasad et al. Citation2022). The efficacy of OBS to redirect particles to the desired capture location was quantified using the average percentage of particles captured in each net cell for the three replicates conducted for each configuration for PB, NB, and SB particles, as shown in , respectively.
Figure 8. Mean capture percentages for positively buoyant (PB) particles for different diffuser angles, mean flow velocities, and airflow rates (qa, in cubic metres per hour per metre of diffuser [m3/h/m]): zero air flow (a), low air flow (b–d) and high air flow rates (e–g). A schematic of the net on top-left shows location of the cells with the flow going into the page. Error bars show the standard deviation in the three replicates for each configuration. Only one case was tried for the trial with zero airflow rate because all the particles stayed on the surface for all three angles of the diffusers [m/s, metres per second].
![Figure 8. Mean capture percentages for positively buoyant (PB) particles for different diffuser angles, mean flow velocities, and airflow rates (qa, in cubic metres per hour per metre of diffuser [m3/h/m]): zero air flow (a), low air flow (b–d) and high air flow rates (e–g). A schematic of the net on top-left shows location of the cells with the flow going into the page. Error bars show the standard deviation in the three replicates for each configuration. Only one case was tried for the trial with zero airflow rate because all the particles stayed on the surface for all three angles of the diffusers [m/s, metres per second].](/cms/asset/04cc2c0d-ceb9-44b1-8dc7-ba1413f476d3/tjoe_a_2332994_f0008_c.jpg)
Figure 9. Capture percentages for negatively buoyant (NB) particles for different diffuser angles, mean flow velocities, and airflow rates (qa, in cubic metres per hour per metre of diffuser [m3/h/m]): zero air flow (a–c), low air flow (d–f) and high air flow rates (g–i). Error bars show the standard deviation in the three replicates for each configuration [m/s, metres per second].
![Figure 9. Capture percentages for negatively buoyant (NB) particles for different diffuser angles, mean flow velocities, and airflow rates (qa, in cubic metres per hour per metre of diffuser [m3/h/m]): zero air flow (a–c), low air flow (d–f) and high air flow rates (g–i). Error bars show the standard deviation in the three replicates for each configuration [m/s, metres per second].](/cms/asset/7090c686-f27f-4249-8a62-d5356b7f6131/tjoe_a_2332994_f0009_c.jpg)
Figure 10. Mean capture percentages for semi-buoyant (SB) particles for different diffuser angles, mean flow velocities, and airflow rates (qa, in cubic metres per hour per metre of diffuser [m3/h/m]): zero air flow (a), low air flow (b–d) and high air flow rates (e–g). Error bars are the standard deviation in the three replicates for each configuration [m/s, metres per second].
![Figure 10. Mean capture percentages for semi-buoyant (SB) particles for different diffuser angles, mean flow velocities, and airflow rates (qa, in cubic metres per hour per metre of diffuser [m3/h/m]): zero air flow (a), low air flow (b–d) and high air flow rates (e–g). Error bars are the standard deviation in the three replicates for each configuration [m/s, metres per second].](/cms/asset/09368088-2543-40af-b28b-41bbe8683976/tjoe_a_2332994_f0010_c.jpg)
3.3.1. Positively buoyant (PB) particles
With no airflow, a higher percentage of particles in cells A1 and A2 for U0 = 0.23 and 0.45 m/s was observed for the PB particles. However, we observed a different pattern for the high-velocity treatment, in which the largest percentage was captured in cell A3. A negligible percentage appears in the bottom row of the net (B1–B4) ().
At U0 = 0.23 m/s, all three inclination angles show nearly 100% of particles captured on the right bank (cells A4 and B4), for both high and low airflow rates. Although PB particles remained on the surface, in general, a high percentage of particles were pushed to the bottom row (cell B4) for U0 = 0.23 m/s when they reached the downstream end of the OBS. This downward movement of PB particles shows that the OBS creates a recirculation zone downstream of the OBS strong enough to sink a majority of PB particles during low-velocity flow. High values of the standard deviation corresponding to cells A4 and B4 in show that this variation occurs within the same column (A4 and B4) and is arising only due to variation in the vertical recirculation, not because of uncertainty in lateral distribution. Trials with higher inclination angles (θ = 45° and 60°), however, showed consistent redirection with low standard deviations. For the medium mean flow velocity, U0 = 0.45 m/s, a steady increase in particle redirection can be seen with increasing angle of the diffuser. However, for the highest velocity cases, U0 = 0.75 m/s, we observed the highest redirection for θ = 45° (57%).
High airflow demonstrated almost 100% redirection to the right bank (A4 and B4 cells) for the slowest mean flow velocity at all three angles. More than half of the particles were captured in the second row (cell B4) for θ = 30° and 45° and U0 = 0.23 m/s (, respectively). Redirection increased for U0 = 0.45 and 0.75 m/s as the inclination angle of the diffuser increased. We observed the highest percentage of particles on the right bank for high airflow and high inclination cases () among all the cases for PB particles.
3.3.2. Negatively buoyant (NB) particles
NB particles resulted in a different distribution pattern compared to the PB surrogates. NB particles (SG = 1.04) sank after their release, and then rolled and saltated along the bed. The turbulence created by the diffuser, even at the high airflow rate, was not sufficient to resuspend the NB particles. Most particles were captured by the cell B4 for all three control trials ().
The redirection of NB particles for the control replicates was solely due to their interaction with the physical structure of the diffuser at the flume bed, and not due to recirculation caused by airflow injected into the flume. Due to its oblique placement along the flume bed, the diffuser structure guided the rolling NB particles towards the right bank. At the low airflow rate (), a reduction in the percentage of particles in cell B4 was observed. Even at the high airflow rate, the percentage of particles captured in B4 decreased for the 30° and 60° angles at all flow velocities. The only exception was the high flow velocity (U0 = 0.75) at θ = 45°, where the percentage of particles trapped in cell B4 remained around 80%.
3.3.3. Semi buoyant (SB) particles
Due to their physical properties, SB particles were expected to behave the closest to the invasive carp eggs out of the three surrogates tested. The control replicate (no airflow) was tested for only θ = 60° (). Because the SB particles did not saltate or roll along the bed, repeating the control cases with the remaining two angles was not necessary. Most SB particles were captured by the cells in the top row of the net, towards the left bank (A1–A3) in the control test (). A higher redirection to cells A4 and B4 was observed for the low airflow, but only for the low flow velocity replicates (). The percentage of redirected particles increased with the inclination angle (θ). We also observed a sizeable portion of the SB particles pushed to the bottom row for low velocity for θ = 60° (). However, we did not observe any effect of low airflow for the 30° or 45° diffusers at higher velocities (). An improved particle redirection is observed for θ = 60° diffuser at 0.45 m/s ().
A higher airflow did not increase particle redirection at faster velocities for θ = 30° (). The θ = 45° diffuser demonstrated some increase, and θ = 60° resulted in a much higher particle redirection towards the desired target bank (cell A4) with higher airflow rates (). However, the increased airflow at low flow velocity has an opposite effect and reduces the particle redirection for θ = 45° and θ = 60° ().
3.3.4. Comparison of redirection efficiencies
A summary of particle redirection efficiencies for all configurations of the OBS is given in . For the PB, redirection was observed to increase with increasing the airflow rate and higher inclination angle of diffuser. The pattern was substantially different for the NB particles. Higher redirection efficiencies were observed at low airflow rates compared to high airflow rates for the NB particles. The high airflow replicates with θ = 60° demonstrated the least redirection of the NB particles for all three velocities. However, θ = 60° diffuser demonstrated much more efficient redirection at low airflow compared to the high airflow replicates. A similar pattern was observed for θ = 30° and 45° when airflow rates are compared. The airflow created regions of high turbulence close to the diffuser that induced mixing and disrupted the streamlined movement of NB particles along the diffuser ramp. Redirection of NB particles is more sensitive to the airflow rate compared to the inclination angle of the diffuser.
Figure 11. Effective redirection as a function of diffuser angle, mean flow velocity, and airflow rate for all three types of particles for all the configurations of the oblique bubble screen (OBS). (a), (b) and (c) show the plots for positively buoyant (PB), negatively buoyant (NB), and semi buoyant (SB) particles, respectively. Effective redirection is defined as the average percentage of particles captured in the rightmost column of the net (A4 and B4 in ) [deg, degrees; m/s, metres per second].
![Figure 11. Effective redirection as a function of diffuser angle, mean flow velocity, and airflow rate for all three types of particles for all the configurations of the oblique bubble screen (OBS). (a), (b) and (c) show the plots for positively buoyant (PB), negatively buoyant (NB), and semi buoyant (SB) particles, respectively. Effective redirection is defined as the average percentage of particles captured in the rightmost column of the net (A4 and B4 in Figure 3) [deg, degrees; m/s, metres per second].](/cms/asset/493e521b-abf0-49c6-8e91-bfa3f434704b/tjoe_a_2332994_f0011_c.jpg)
Redirection of the SB particles did not show any straightforward ubiquitous patterns. Instead, the redirection efficiency was strongly dependent on the mean flow velocity and the inclination angle. The lowest mean flow velocity (Uo = 0.23 m/s) with low airflow rate for θ = 45° and θ = 60° resulted in the highest redirection towards the right bank of the flume. But for θ = 30°, the highest redirection was seen at the high airflow rate. At relatively higher mean flow velocities (Uo = 0.45 and 0.75 m/s), redirection efficiencies increased with the inclination angle and airflow. The pattern at higher velocities was found to be similar to the SB particles with high airflow rate and θ = 60° demonstrating the highest redirection efficiency.
3.3.5. Correlation between hydrodynamics and redirection
Lateral redirection of the particles at the water surface, generated by the OBS, is quantified in terms of the mean velocity ratio (|V|/|U|) and shown in . The maximum values of |V|/|U| are found to occur close to the location of the OBS on the surface. A new parameter that is representative of maximum values of |V|/|U| is defined to establish a correlation between the hydrodynamics and particle redirection close to the surface. We defined this new hydrodynamic parameter, the bulk mean velocity ratio (), calculated from the surface PIV results shown in . Bulk mean velocity ratio is defined in EquationEquation (10)
(10)
(10) as:
(10)
(10)
We have chosen 90th-percentile instead of the maximum value of |V|/|U| to avoid any biases because of the errors in surface PIV results. We could see a correlation between () and redirection efficiencies of PB and SB particles (). A higher value of
resulted in better redirection efficiencies for all three angles. The mean velocity ratio was found to decrease with an increase in the flow velocity in the flume at the same airflow rate. Similarly, particle redirection was also found to decrease with higher downstream flow velocities if airflow was unchanged (also shown in ). Because the
is calculated for the surface hydrodynamics and NB particles always stayed close to the bed, we did not expect the mean velocity ratio at the surface (|V|/|U|) to have any effect on the redirection of NB particles.
Figure 12. Correlation between the bulk velocity ratio (<|V|/|U|>; bars) and effective redirection for positively buoyant (PB) and semi buoyant (SB) particles (markers and trendlines) at high airflow rate. Error bars show standard deviation in three replicates for the selected configurations [deg, degrees; m/s, metres per second].
![Figure 12. Correlation between the bulk velocity ratio (<|V|/|U|>; bars) and effective redirection for positively buoyant (PB) and semi buoyant (SB) particles (markers and trendlines) at high airflow rate. Error bars show standard deviation in three replicates for the selected configurations [deg, degrees; m/s, metres per second].](/cms/asset/82c92d4b-c297-465d-ae56-d4c7f306b95e/tjoe_a_2332994_f0012_c.jpg)
4. Discussion
The development of an OBS for redirecting the drifting early life stages of invasive carp could be a potentially transformative technique that can have important benefits for population control, mainly because it is a control technology that is independent of behavioural responses (e.g. larval light trapping) and could be used to target early life stages currently not well represented in population suppression efforts. Overall, our results demonstrate that specific characteristics of an OBS can directly change the trajectory of particles (surrogates for invasive carp eggs) of different densities and, therefore, provide guidance on the targeted redirection of particles or drifting early life stages in lotic ecosystems needed to assist in controlling invasive carp populations. More specifically, in the current study, the target location for the collection of eggs redirected by an OBS is at the trailing end where the bubble screen hits the surface, on the bank furthest downstream. The lateral push created by the OBS changed with velocity for a given airflow rate. High water velocity advects the bubble screen to a much further extent downstream of the diffuser’s physical location. The advection does not happen uniformly across water depth as the top of the bubble screen advects to a longer distance, tilting the bubble screen. Because of this, the surface currents generated by the bubble screen get weaker, resulting in a smaller lateral component at high flow velocities. Therefore, a higher airflow is required, in general, to create a comparable lateral push at a higher streamflow velocity. The location of a capturing mechanism would thus depend on mean flow velocity, assuming that diffusers are fixed at the bed. In laboratory tests, we had to change the location of the net when flow velocity changed, which could require adjustability of a collection system in a field deployment.
Particle density was critical to determining trajectory as particles interact with the OBS, with even slight differences in density resulting in contrasting results. Redirection patterns were noticeably different within the narrow range of SG of the particles (0.9–1.04) tested in this study. Any particles with SG lower than 0.9 would likely exhibit a behaviour similar to the PB particles. Spherical NB particles with SG higher than 1.04 are expected to be redirected along the physical structure of the diffuser, assuming the flow has enough energy to sustain rolling or saltation. A similar result would be expected for the eggs of any organism with densities in such a range. This can have important repercussions in the field application of an OBS where early life stages of non-target species, or other objects with similar physical properties, will exhibit a similar redirection. However, we note that most invasive carp spawning events occur later in the year (Kolar et al. Citation2007) than those of most fish species native to North America, especially those few with drifting eggs, and thus the timing of application of an OBS barrier could thus reduce non-target effects.
Airflow rate and secondary flows correlated positively, ultimately affecting particle redirection, but the effect of secondary flows on particle trajectory was not always straightforward. For the PB particles that always tend to remain on the surface, we see a higher redirection of particles towards our target collection point at higher airflows because of the stronger surface currents that resulted from enhanced recirculation. The redirection results showed a pattern similar to the findings of Spaargaren (Citation2018) where the focus was only on the floating plastic objects. In contrast, increased airflow reduced particle redirection for NB particles by mixing them across the diffuser and thus preventing their rolling along the diffuser’s axis. For the SB particles, this trend was much more complex, and the optimal airflow rate to redirect SB particles towards the collection point was dependent on incoming water velocities such that increasing the airflow rate did not necessarily increase SB particle redirection. This result implies additional tuning to optimize an OBS for live eggs because of their lower settling speed relative to the particles tested currently is warranted (George et al. Citation2017). Because of secondary flows, even slight changes in the flow field might affect the trajectory of SB invasive carp eggs. The optimal airflow rate to maximize particle capture would depend on the settling speed for the SB surrogates. This is of particular interest for determining the optimal airflow rates needed to collect live invasive carp eggs that are also treated as semi-buoyant. An additional factor here is the hemispherical shape of the SB particles. A spherical particle of the same diameter and density will have slightly higher settling speed due to the lesser drag experienced by a perfect spherical shape. The slight difference in the settling speed can potentially have substantial difference in the redirection pattern in the presence of secondary flows.
NB particles were redirected solely by the physical structure of the diffusers along the bottom of the flume, and not due to recirculation of water due to the bubble screen. The likelihood of particle resuspension can be predicted by comparing the shear velocity at the bed and particle settling speed. If bed shear velocity exceeds settling speed, the turbulence generated at the bed can counter the settling and particles can remain in suspension (Rijn Citation1984; Prada et al. Citation2018). Shear velocity at the bed was lower than the settling speed of NB for all flow cases, indicating insufficient turbulence to resuspend the NB particles ( and ). While a strong recirculation was observed in the wake of the diffuser, which could keep NB particles temporarily suspended, eventually, all particles leave the recirculation zone and travel to the net.
An increased angle of the OBS resulted in increased redirection for PB and SB particles, mainly due to strengthened lateral velocity component. However, the cost of installation and operation also increases with the higher inclination angle due to additional materials and airflow required, resulting in a trade-off between the high inclination angle and the cost of installation and operation. For instance, the redirection efficiency of SB surrogates for U0 = 0.75 m/s, at the highest airflow, shows a 10% higher redirection for θ = 60° compared to θ = 45°. But the length of the diffuser for θ = 60° was 1.4 times longer. Longer diffusers also require a higher amount of total airflow rate (Qa) to maintain the same value per unit length airflow rate (qa). A higher inclination angle will thus result into a higher cost of installation and operation. However, findings from Spaargaren (Citation2018) show that, with a higher diffuser inclination, the total airflow needed for the same capture percentage of PB plastic was lower despite a larger diffuser. So, keeping airflow rate per unit length might not be the most optimal strategy to compare the effect of angles on particle redirection because of higher energy consumption. Future experiments could consider this possibility and include an inclination angle higher than θ = 60° at a lower airflow.
Configuration of an OBS is another aspect that warrants further research. We have conceptualized an OBS using a single diagonal diffuser and target location at the downstream end of the bubble screen. The target location would also change with the layout of the OBS. For instance, an inverted V-shaped or chevron configuration of diffusers would push drifting particles towards both banks or to the centre of the channel depending on whether the diffuser “V” was pointing upstream or downstream.
All the experiments in this study were conducted in a laboratory setup using a flume with a rectangular cross-section and mean velocity not exceeding 0.75 m/s. These conditions are different from those in the field whereby stream bottoms are irregular and banks often slope towards the surface. The fundamental approach for the field deployment of an OBS would stay the same even relative to the laboratory study described here. Non-uniform flows, irregular cross-sections, and bed forms in a natural channel impose additional challenges for field implementation of an OBS. Maintaining a uniform secondary flow across the entire width of the stream is challenging and will require sophisticated local controls to keep the hydrodynamics consistent. Moreover, an array of diffusers, rather than the single diffuser used here, might be needed in the field to create a redirection zone wide enough to keep semi-buoyant eggs in suspension for longer durations to facilitate redirection and collection. Testing the interaction of multiple diffusers placed in parallel is also important to see their combined effect on particle redirection.
In addition to the cross-section of the flume, water temperature for all the experiments was controlled in a temperature range of 21 ± 2 °C, but temperature fluctuations and gradients can be substantially higher in the field. Viscosity and density of water change with temperature, resulting in substantial changes in particle settling characteristics (Ahrens and Member Citation2000). Therefore, efforts related to field implementation would benefit from considering the effects of temperature differences on particle behaviour.
Initial studies on other applications of bubble screens relied on experiments and analytical models to predict velocities and width of the bubble screen (Kobus Citation1968; Ditmars and Cederwall Citation1974; Brevik Citation1977), while more recent studies could characterize the turbulence structures of different scales induced by the bubble screens (Bombardelli et al. Citation2003; García and García Citation2006; Bombardelli et al. Citation2010). Computational models capable of incorporating mass transfer and liquid chemistry for a large-scale two-dimensional domain were developed in recent years (Buscaglia et al. Citation2002; Oldeman et al. Citation2020). Because most field prototypes of the bubble screen have occurred at a much larger scale compared to the laboratory-scale models, scaling analysis of hydrodynamics becomes important (Tekeli and Maxwell Citation1978; Bombardelli et al. Citation2010), resulting in various relevant non-dimensional parameters suggested for scaling of bubble screens (Milgram Citation1983; Schladow Citation1992; Asaeda and Imberger Citation1993; Bombardelli et al. Citation2010). Scaling analysis is also important considering the expensive implementation of large field-scale prototypes. For instance, Bombardelli et al. (Citation2010) showed a scaling analysis using results from a prototype, and a model with a geometrical scaling of 10:1 to predict a quasi-universal behaviour of bubble plumes. Following a similar approach, an intermediate scaled prototype of an OBS could be used as a nearly-field scale prototype for scaling analysis in future work using a model of appropriate geometrical scaling.
Another challenge of field implementation may arise due to presence of a mobile bed. Secondary flows created by bubble screens can change the morphology of a mobile sediment bed. Dugué et al. (Citation2015) used a sediment bed (mean particle diameter dm = 2 mm) and noticed that the changed morphology allowed for growth of secondary flows to more than double their extent on a rigid flat bed. The extent of their secondary flow, however, was found to be independent of the scale of the flow, for flow depth in the range 0.1 m to 5 m. This can be of particular importance in the field implementation of OBS, where the stream bed will be susceptible to erosion due to the secondary flows. OBS setup will require modifications to mitigate the unintended effects on sediment transport dynamics in natural streams.
An extension of this study investigating the efficacy of an OBS on redirection of live grass carp eggs using a similar laboratory setup has recently been completed and will be published in a separate article. While an OBS might also be useful for redirecting larvae, further research would be beneficial before any generalizations can be made due to their mobility and unknown behavioural response to the OBS. Grass carp larvae try to avoid regions of high turbulence, particularly areas with turbulent eddies of length scales similar to their size (Prada et al. Citation2021). These additional insights about their behaviour might be helpful in modifying the approach to study the effects of OBS on live larvae of invasive carp in future studies.
5. Conclusions
An oblique bubble screen (OBS) in flowing water produces a much more complex flow distribution than a bubble screen in a stagnant environment. The OBS can redirect nearly 100% of positively buoyant particles to a target collection point at low (0.23 m/s) and intermediate (0.45 m/s) mean channel velocities, and up to 60% at the highest flow velocity evaluated (0.75 m/s). The OBS redirection efficiency was lower for semi buoyant particles—up to 80% at intermediate flow velocity and up to 40% at high flow velocity—indicating a dependence on particle density and settling speeds. Redirection efficiency of semi buoyant particles had an optimal airflow rate corresponding to each flow velocity and angle of diffuser, showing the relevance of both mean flow, air flow rate, and diffuser configuration on redirection efficiency, which can be captured with velocity ratios such as the proposed |V|/|U| ratio at the surface. The airflow did not affect the redirection of negatively buoyant particles, as they are only guided by the physical structure of the diffuser along the bed. The observed redirection patterns of three classes of surrogate eggs within a narrow range of densities demonstrates the potential of OBS as a tool for controlling the dispersal of particulate matter in streams. While most effective for positively buoyant particles, this technology has potential for redirection of semi buoyant eggs of invasive fish, potentially providing a novel technology to target early life stages of invasive fishes and supplement existing control efforts.
Supplemental Material
Download MS Excel (1.4 MB)Acknowledgments
Any use of trade, firm, or product names is for descriptive purposes only and does not imply endorsement by the U.S. Government. We thank Andrew Waratuke, lab manager at Hydrosystems Laboratory, UIUC and CEE Machining shop staff for their help with assembling the initial setup of the oblique bubble diffusers.
Disclosure statement
No potential conflict of interest was reported by the author(s).
Data availability statement
The authors confirm that the data supporting the findings of this study are available within the article and its Supplementary Material.
Additional information
Funding
References
- [ACRCC] Asian Carp Regional Coordinating Committee. 2018. Asian carp monitoring and response plan. [accessed 2023 Jun 24]. https://invasivecarp.us/Documents/MRP2018.pdf.
- Ahrens JP, Member A. 2000. A fall-velocity equation. J Waterw Port Coast Ocean Eng. 126(2):99–102. doi: 10.1061/(ASCE)0733-950X(2000)126:2(99).
- Altenritter ME, DeBoer JA, Maxson KA, Casper AF, Lamer JT. 2022. Ecosystem responses to aquatic invasive species management: a synthesis of two decades of bigheaded carp suppression in a large river. J Environ Manage. 305:114354. doi: 10.1016/J.JENVMAN.2021.114354.
- Asaeda T, Imberger J. 1993. Structure of bubble plumes in linearly stratified environments. J Fluid Mech. 249(1):35–57. doi: 10.1017/S0022112093001065.
- Bernery C, Bellard C, Courchamp F, Brosse S, Gozlan RE, Jarić I, Teletchea F, Leroy B. 2022. Freshwater fish invasions: a comprehensive review. Annu Rev Ecol Evol Syst. 53(1):427–456. doi: 10.1146/annurev-ecolsys-032522-015551.
- Bombardelli FA, Buscaglia GC, Rehmann CR, Rincón LE, García MH. 2010. Modeling and scaling of aeration bubble plumes: a two-phase flow analysis. J Hydraul Res. 45(5):617–630. doi: 10.1080/00221686.2007.9521798.
- Bombardelli FA, García CM, Cantero MI, Rincón L, Waratuke A, Rehmann CR, García MH. 2003. Issues regarding the measurement of turbulence properties in bubble plumes. Proc World Water Environ Resour Congr. 2003:2747–2756. doi: 10.1061/40685(2003)212.
- Brevik I. 1977. Two-dimensional air-bubble plume. J Waterw Port Coast Ocean Div. 103(1):101–115. doi: 10.1061/JWPCDX.0000003.
- Brey MK, Woodley CM, Stanton JC, Fritts AK, Sholtis M, Castro-Santos T, Vallazza JM, Albers JL. 2023. Lock 19 underwater acoustic deterrent system study—interim project update, through 2022. Reston (VA): U.S. Geological Survey Open-File Report 2023-1058;11 p. doi: 10.3133/OFR20231058.
- Bulson PS. 1961. Currents produced by an air curtain in deep water. Dock Harbour Auth. 42:15–22.
- Bulson PS. 1968. The theory and design of bubble breakwaters. Int Conf Coastal Eng. 1(11):64. doi: 10.9753/icce.v11.64.
- Buscaglia GC, Bombardelli FA, García MH. 2002. Numerical modeling of large-scale bubble plumes accounting for mass transfer effects. Int J Multiph Flow. 28(11):1763–1785. doi: 10.1016/S0301-9322(02)00075-7.
- Chapman DC, George AE. 2011. Developmental rate and behavior of early life stages of bighead carp and silver carp. Reston, VA: U.S. Geological Survey. Scientific Investigations Report 2011–5076. doi: 10.3133/sir20115076.
- Chick JH, Gibson-Reinemer DK, Soeken-Gittinger L, Casper AF. 2020. Invasive silver carp is empirically linked to declines of native sport fish in the Upper Mississippi River System. Biol Invasions. 22(2):723–734. doi: 10.1007/s10530-019-02124-4.
- Courtenay C Jr, Williams JD. 1992. Dispersal of exotic species from aquaculture sources, with emphasis on freshwater fishes. In: Rosenfield A, Mann R, editors. Dispersal of living organism into aquatic ecosystem. University of Maryland Publication MU-SG-TS-92-04; p. 49–81. [accessed 2023 Aug 13]. https://pubs.usgs.gov/publication/85767.
- Cupp AR, Brey MK, Calfee RD, Chapman DC, Erickson R, Fischer J, Fritts AK, George AE, Jackson PR, Knights BC, et al. 2021. Emerging control strategies for integrated pest management of invasive carps. J Vertebr Biol. 70(4):21057–21051. doi: 10.25225/JVB.21057.
- Cupp AR, Erickson RA, Fredricks KT, Swyers NM, Hatton TW, Amberg JJ. 2017. Responses of invasive silver and bighead carp to a carbon dioxide barrier in outdoor ponds. Can J Fish Aquat Sci. 74(3):297–305. doi: 10.1139/cjfas-2015-0472.
- Davis JJ, Jackson PR, Engel FL, LeRoy JZ, Neeley RN, Finney ST, Murphy EA. 2016. Entrainment, retention, and transport of freely swimming fish in junction gaps between commercial barges operating on the Illinois Waterway. J Great Lakes Res. 42(4):837–848. doi: 10.1016/j.jglr.2016.05.005.
- Davis JJ, LeRoy JZ, Shanks MR, Jackson PR, Engel FL, Murphy EA, Baxter CL, Trovillion JC, McInerney MK, Barkowski NA. 2017. Effects of tow transit on the efficacy of the Chicago Sanitary and Ship Canal Electric Dispersal Barrier System. J Great Lakes Res. 43(6):1119–1131. doi: 10.1016/j.jglr.2017.08.013.
- Dennis CE, Sorensen PW. 2020. High-intensity light blocks bighead carp in a laboratory flume. MBI. 11(3):441–460. doi: 10.3391/mbi.2020.11.3.07.
- Dennis CE, Zielinski D, Sorensen PW. 2019. A complex sound coupled with an air curtain blocks invasive carp passage without habituation in a laboratory flume. Biol Invasions. 21(9):2837–2855. doi: 10.1007/s10530-019-02017-6.
- Dettmers JM, Boisvert BA, Barkley T, Sparks RE. 2005. Potential impact of steel-hulled barges on movement of fish across an electric barrier to prevent the entry of invasive carp into Lake Michigan. INHS Center for Aquatic Ecology; [accessed 2023 Apr 9]. https://hdl.handle.net/2142/10091.
- Ditmars JD, Cederwall K. 1974. Analysis of air-bubble plumes. Int Conf Coastal Eng. 1(14):128. doi: 10.9753/icce.v14.128.
- Dugué V, Blanckaert K, Chen Q, Schleiss AJ. 2015. Influencing flow patterns and bed morphology in open channels and rivers by means of an air-bubble Screen. J Hydraul Eng. 141(2):04014070. doi: 10.1061/(asce)hy.1943-7900.0000946.
- Embke HS,Kocovsky PM,Garcia T,Mayer CM,Qian SS. 2019. Modeling framework to estimate spawning and hatching locations of pelagically spawned eggs. Can J Fish Aquat Sci. 76(4):597–607. doi: 10.1139/cjfas-2018-0047.
- Feely JR, Sorensen PW. 2023. Effects of an ensonified bubble curtain and a cyclic sound on blocking 10 species of fishes including 4 invasive carps in a laboratory flume. Biol Invasions. 25(6):1973–1989. doi: 10.1007/s10530-023-03022-6.
- Fritts AK, Gibson-Reinemer D, Stanton JC, Mosel K, Brey MK, Vallazza JM, Appel D, Faulkner J, Tompkins J, Castro-Santos T, et al. 2023. Multimodal invasive carp deterrent study at Barkley Lock and Dam—Status update through 2022. Reston, VA: U.S Geological Survey Open-File Report 2023-1051. doi: 10.3133/OFR20231051.
- García CM, García MH. 2006. Characterization of flow turbulence in large-scale bubble-plume experiments. Exp Fluids. 41(1):91–101. doi: 10.1007/s00348-006-0161-6.
- Garcia T, Murphy EA, Jackson PR, Garcia MH. 2015. Application of the FluEgg model to predict transport of Asian carp eggs in the Saint Joseph River (Great Lakes tributary). J Great Lakes Res. 41(2):374–386. doi: 10.1016/j.jglr.2015.02.003.
- George AE, Garcia T, Chapman DC. 2017. Comparison of size, terminal fall velocity, and density of bighead carp, silver carp, and grass carp eggs for use in drift modeling. Trans Am Fish Soc. 146(5):834–843. doi: 10.1080/00028487.2017.1310136.
- George AE, Garcia T, Stahlschmidt BH, Chapman DC. 2018. Ontogenetic changes in swimming speed of silver carp, bighead carp, and grass carp larvae: implications for larval dispersal. PeerJ. 6(11):e5869. doi: 10.7717/PEERJ.5869.
- Gozlan RE. 2008. Introduction of non-native freshwater fish: is it all bad? Fish Fish. 9(1):106–115. doi: 10.1111/j.1467-2979.2007.00267.x.
- Haider A, Levenspiel O. 1989. Drag coefficient and terminal velocity of spherical and nonspherical particles. Powder Technol. 58(1):63–70. doi: 10.1016/0032-5910(89)80008-7.
- Heer Tej,Wells MG,Jackson PR,Mandrak NE. 2020. Modelling grass carp egg transport using a 3-D hydrodynamic river model: the role of egg retention in dead zones on spawning success. Can J Fish Aquat Sci. 77(8):1379–1392. doi: 10.1139/cjfas-2019-0344.
- Holliman FM, Killgore KJ, Shea C. 2015. Development of operational protocols for electric barrier systems on the Chicago Sanitary and Ship Canal: induction of passage-preventing behaviors in small sizes of silver carp. Engineer Research and Development Center (U.S.), Technical Note ERDC/TN ANSRP-15-1. [accessed 2022 Aug 4]. http://hdl.handle.net/11681/5087.
- Irons KS, Sass GG, McClelland MA, Stafford JD. 2007. Reduced condition factor of two native fish species coincident with invasion of non-native Asian carps in the Illinois River, U.S.A. Is this evidence for competition and reduced fitness? J Fish Biol. 71(sd):258–273. doi: 10.1111/j.1095-8649.2007.01670.x.
- Islam MR, Zhu DZ. 2013. Kernel density–based algorithm for despiking ADV data. J Hydraul Eng. 139(7):785–793. doi: 10.1061/(ASCE)HY.1943-7900.0000734.
- Jackson PR, Lageman JD, LeRoy JZ, Beaulin RE, Koebel CM, Matson LA, Metzker JE, Crawford CA, Chen C. 2019. Velocity, discharge, and dye concentrations during a dye tracer study on the lower Sandusky River, Ohio, July 11-13, 2017. U.S. Geological Survey data release. https://doi.org/10.5066/F7M9080M.
- Jelks HL, Walsh SJ, Burkhead NM, Contreras-Balderas S, Diaz-Pardo E, Hendrickson DA, Lyons J, Mandrak NE, McCormick F, Nelson JS, et al. 2008. Conservation status of imperiled North American freshwater and diadromous fishes. Fisheries. 33(8):372–407. doi: 10.1577/1548-8446-33.8.372.
- Kates D, Dennis C, Noatch MR, Suski CD. 2012. Responses of native and invasive fishes to carbon dioxide: potential for a nonphysical barrier to fish dispersal. Can J Fish Aquat Sci. 69(11):1748–1759. doi: 10.1139/f2012-102.
- Kelly AM. 2011. Alternative methods to use of black carp for snail control in aquaculture ponds. Am Fish Soc Symp. 74:73–87.
- Kelly AM, Armstrong ML, Freeze M, Mitchell AJ, Dupree HK. 2011. History of introductions and governmental involvement in promoting the use of grass, silver, and bighead Carps. Am Fish Soc Symp. 74:163–174.
- Kobus HE. 1968. Analysis of the flow induced by air-bubble systems. Int Conf Coastal Eng. 1(11):65. doi: 10.9753/icce.v11.65.
- Kočovský PM, Chapman DC, Qian S. 2018. “Asian carp” is societally and scientifically problematic. Let’s replace it. Fisheries. 43(7):311–316. doi: 10.1002/fsh.10087.
- Kolar CS, Chapman DC Jr, Housel CM, Williams JD, Jennings DP. 2007. Bigheaded carps : a biological synopsis and environmental risk assessment. Am Fish Soc Spec Publ 33. doi: 10.47886/9781888569797.
- LeRoy JZ, Davis JJ, Shanks MR, Jackson PR, Murphy EA, Baxter CL, Trovillion JC, McInerney MK. 2019. Efficacy of increasing discharge to reduce tow-mediated fish passage across an electric dispersal barrier system in a confined channel. J Great Lakes Res. 45(6):1320–1331. doi: 10.1016/j.jglr.2019.08.007.
- Leung B, Lodge DM, Finnoff D, Shogren JF, Lewis MA, Lamberti G. 2002. An ounce of prevention or a pound of cure: bioeconomic risk analysis of invasive species. Proc Biol Sci. 269(1508):2407–2413. doi: 10.1098/RSPB.2002.2179.
- Lodge DM, Williams S, Macisaac HJ, Hayes KR, Leung B, Reichard S, Mack RN, Moyle PB, Smith M, Andow DA, et al. 2006. Biological invasions: recommendations for U.S. policy and management. Ecol Appl. 16(6):2035–2054. doi: 10.1890/1051-0761(2006)016[2035:BIRFUP]2.0.CO;2.
- Milardi M, Soana E, Chapman D, Fano EA, Castaldelli G. 2020. Could a freshwater fish be at the root of dystrophic crises in a coastal lagoon? Sci Total Environ. 711:135093. doi: 10.1016/J.SCITOTENV.2019.135093.
- Milgram JH. 1983. Mean flow in round bubble plumes. J Fluid Mech. 133:345–376. doi: 10.1017/S0022112083001950.
- Mitchell AJ, Kelly AM. 2006. The public sector role in the establishment of grass carp in the United States. Fish Mag. 31(3):113–121. doi: 10.1577/1548-8446(2006)31[113:TPSRIT]2.0.CO;2.
- Moy PB, Polls I, Dettmers JM. 2011. The Chicago sanitary and ship canal aquatic nuisance species dispersal barrier. Am Fish Soc Symp. 74:121–137.
- Murchy KA, Cupp AR, Amberg JJ, Vetter BJ, Fredricks KT, Gaikowski MP, Mensinger AF. 2017. Potential implications of acoustic stimuli as a non-physical barrier to silver carp and bighead carp. Fish Manage Eco. 24(3):208–216. doi: 10.1111/fme.12220.
- Murphy EA, Jackson PR. 2013.Hydraulic and water-quality data collection for the investigation of Great Lakes tributaries for Asian carp spawning and egg-transport suitability. Reston, VA: U. S. Geological Survey. doi: 10.3133/sir20135106.
- Noatch MR, Suski CD. 2012. Non-physical barriers to deter fish movements. Environ Rev. 20(1):71–82. doi: 10.1139/a2012-001.
- Oldeman AM, Kamath S, Masterov MV, O’Mahoney TSD, van Heijst GJF, Kuipers JAM, Buist KA. 2020. Numerical study of bubble screens for mitigating salt intrusion in sea locks. Int J Multiph Flow. 129:103321. doi: 10.1016/j.ijmultiphaseflow.2020.103321.
- Parker AD, Glover DC, Finney ST, Rogers PB, Stewart JG, Simmonds RL. 2016. Fish distribution, abundance, and behavioral interactions within a large electric dispersal barrier designed to prevent Asian carp movement. Can J Fish Aquat Sci. 73(7):1060–1071. doi: 10.1139/cjfas-2015-0309.
- Pendleton RM, Schwinghamer C, Solomon LE, Casper AF. 2017. Competition among river planktivores: are native planktivores still fewer and skinnier in response to the Silver Carp invasion? Environ Biol Fish. 100(10):1213–1222. doi: 10.1007/s10641-017-0637-7.
- Pimentel D, Zuniga R, Morrison D. 2005. Update on the environmental and economic costs associated with alien-invasive species in the United States. Ecol Econ. 52(3):273–288. doi: 10.1016/j.ecolecon.2004.10.002.
- Prada AF, George AE, Stahlschmidt BH, Chapman DC, Tinoco RO. 2018. Survival and drifting patterns of grass carp eggs and larvae in response to interactions with flow and sediment in a laboratory flume. PLoS One. 13(12):e0208326. doi: 10.1371/journal.pone.0208326.
- Prada AF, George AE, Stahlschmidt BH, Jackson PR, Chapman DC, Tinoco RO. 2021. Using turbulence to identify preferential areas for grass carp (Ctenopharyngodon idella) larvae in streams: a laboratory study. Water Resour Res. 57(2):e2020WR028102. doi: 10.1029/2020WR028102.
- Prasad V, Suski C, Jackson PR, George A, Chapman D, Fischer J, Tinoco R. 2022. Assessing the efficacy of oblique bubble screens for control of aquatic invasive species. In: Proceedings of the 39th IAHR World Congress, Granada:International Association for Hydro-Environment Engineering and Research (IAHR); p. 1565–1570. doi: 10.3850/IAHR-39WC2521711920221833.
- Raboin M, Plumb JM, Sholtis MD, Smith DL, Jackson PR, Rivera JM, Suski CD, Cupp AR. 2023. Movement and behavioral states of common carp (Cyprinus carpio) in response to a behavioral deterrent in a navigational lock. Mov Ecol. 11(1):42. doi: 10.1186/S40462-023-00396-Z.
- Riesgraf AT, Finger JS, Zielinski DP, Dennis CE, Whitty JM, Sorensen PW. 2022. Evaluation of a broadband sound projected from the gates of a navigation lock in the Mississippi River shows it to be a weak deterrent for common carp and unable to block passage. MBI. 13(1):220–232. doi: 10.3391/mbi.2022.13.1.13.
- Rijn LCv. 1984. Sediment transport, Part II: suspended load transport. J Hydraul Eng. 110(11):1613–1641. doi: 10.1061/(asce)0733-9429(1984)110:11(1613).
- Sass GG, Hinz C, Erickson AC, McClelland NN, McClelland MA, Epifanio JM. 2014. Invasive bighead and silver carp effects on zooplankton communities in the Illinois River, Illinois, USA. J Great Lakes Res. 40(4):911–921. doi: 10.1016/j.jglr.2014.08.010.
- Schladow SG. 1992. Bubble plume dynamics in a stratified medium and the implications for water quality amelioration in lakes. Water Resour Res. 28(2):313–321. doi: 10.1029/91WR02499.
- Spaargaren L. 2018. [The bubble barrier] [master’s thesis]. Delft, Netherlands: Delft University of Technology. [accessed 2023 May 6]. https://repository.tudelft.nl/islandora/object/uuid%3A7e08919f-b3f5-49b2-9c3f-5f8489e47a0c.
- Socolofsky SA. 2001. Laboratory experiments of multi-phase plumes in stratification and crossflow [dissertation]. Cambrige (MA): Massachusetts Institute of Technology. [accessed 2023 Nov 15]. https://dspace.mit.edu/handle/1721.1/74884.
- Tekeli S, Maxwell WHC. 1978. Behavior of air bubble screens. Urbana (IL): Department of Civil Engineering, University of Illinois at Urbana-Champaign.
- [TGBB] The Great Bubble Barrier. 2019. Amsterdam - the great bubble barrier® [Internet]; [accessed 2023 Jul 11]. https://thegreatbubblebarrier.com/amsterdam/.
- Thielicke W, Sonntag R. 2021. Particle image velocimetry for MATLAB: accuracy and enhanced algorithms in PIVlab. JORS. 9(1):12. doi: 10.5334/jors.334.
- Thompson CEL, Amos CL, Jones TER, Chaplin J. 2003. The manifestation of fluid-transmitted bed shear stress in a smooth annular flume: a comparison of methods. J Coast Res. 19(4):1094–1103.
- Tsehaye I,Catalano M,Sass G,Glover D,Roth B. 2013. Prospects for fishery‐induced collapse of invasive Asian carp in the Illinois River. Fisheries. 38(10):445–454. doi: 10.1080/03632415.2013.836501.
- [USFWS] U.S. Fish & Wildlife Service. 2010. Great lakes restoration initiative. U.S. Fish & Wildlife Service [Internet]; [accessed 2022 Nov 2]. https://www.fws.gov/initiative/great-lakes-restoration-initiative.
- Vetter BJ, Cupp AR, Fredricks KT, Gaikowski MP, Mensinger AF. 2015. Acoustical deterrence of Silver Carp (Hypophthalmichthys molitrix). Biol Invasions. 17(12):3383–3392. doi: 10.1007/s10530-015-0964-6.
- Vetter BJ, Murchy KA, Cupp AR, Amberg JJ, Gaikowski MP, Mensinger AF. 2017. Acoustic deterrence of bighead carp (Hypophthalmichthys nobilis) to a broadband sound stimulus. J Great Lakes Res. 43(1):163–171. doi: 10.1016/j.jglr.2016.11.009.
- Wilcove DS, Rothstein D, Dubow J, Phillips A, Losos E. 1998. Quantifying threats to imperiled species in the United States. Bioscience. 48(8):607–615. doi: 10.2307/1313420.
- Yih P, Liang T. 1964. Natural conditions of the spawning grounds of the “domestic fishes” in Yangtze River and essential external factor for spawning. ACTA Hydrobiol Sin. 5(1):1–15.
- Zhang E, Stocchino A, De Leo A, Fang JK-H. 2022. Performance assessment of bubbles barriers for microplastic remediation. Sci Total Environ. 844:157027. doi: 10.1016/J.SCITOTENV.2022.157027.
- Zielinski DP, Sorensen PW. 2015. Field test of a bubble curtain deterrent system for common carp. Fish Manage Ecol. 22(2):181–184. doi: 10.1111/fme.12108.
- Zielinski DP, Sorensen PW. 2016. Bubble curtain deflection screen diverts the movement of both Asian and common carp. N Am J Fish Manag. 36(2):267–276. doi: 10.1080/02755947.2015.1120834.
- Zolper TJ, Smith DL, Jackson PR, Cupp AR. 2022. Performance of a carbon dioxide injection system at a navigation lock to control the spread of aquatic invasive species. J Environ Eng. 148(4):04022011. doi: 10.1061/(ASCE)EE.1943-7870.0001987.