
 ?Mathematical formulae have been encoded as MathML and are displayed in this HTML version using MathJax in order to improve their display. Uncheck the box to turn MathJax off. This feature requires Javascript. Click on a formula to zoom.
Abstract
Many port cities suffer from congestion and greenhouse gas (GHG) and other emissions. City governments and port authorities seek ways to reduce the negative impacts on quality of life, health, climate, and the local economy. Congestion across the United States, United Kingdom and Germany alone cost close to $461 billion in 2017 or $975 per capita. Artificial intelligence and machine learning can help to understand and predict traffic volumes and enable simulation of alternative solutions to smooth flows and reduce congestion. This article reflects on optimising the utilisation of road transport infrastructure to reduce GHG emissions in the Valencia port city environment. This real-life study case shows that data, data sharing and AI systems can contribute to reducing congestion and with that GHG emissions and other negative impacts for port cities.
Using a 2019 sample of port-bound container traffic flow data from the Port of Valencia, this article describes an analysis methodology to enable the optimisation of operations and traffic flows, thereby providing efficiencies, and easing congestion, and at the same time reducing GHG and other emissions in a port city.
Cities are mega infrastructure projects where traffic flows need to be managed; so are ports. Seaports are naturally connected to major cities and economic centres, which makes them city ports located within or near port cities (Lind et al. Citation2020a). Dimitriou, Ward, and Wright (Citation2015) explain a port city mega transport infrastructure as a land-based transport infrastructure that has required/requires a major investment over US$1 billion within and connecting major urban and metropolitan regions with sea borne transport or combinations of these. Cities and ports require infrastructure particularly for energy, transport, communication, and data exchanges, as well as the movement of people and goods.
Today, many cities and ports suffer from daily road congestion. The traffic situation in many cities has become challenging but when port-bound traffic flows are added the situation gets even worse. The combined volume of both flows and the resulting road congestion, particularly during city and port peak times causes major challenges for city governments from an environmental/climate, and social/health, and economic perspective. Congestion brings various risks to the port cities, directly affecting the wellbeing and health of city dwellers and port workers and indirectly exposing coastal assets and infrastructure to climate change induced natural disasters and rising sea levels.
Road congestion and stop-and-go traffic have significant negative effects. Environmentally, congestion increases emissions of greenhouse gases (Barth and Boriboonsomsin Citation2009) providing the basis for a call for congestion mitigation strategies avoiding peaks and ensuring a continuous flow of traffic and an optimised co-utilisation of city and port infrastructure. Hence, flattening the flows of port-bound container traffic in the port city reduces greenhouse gas (GHG) and other traffic-induced emissions like volatile organic compounds (VOCs) or hydrocarbons (HCs), nitrogen oxides (NOx), and particulate matter (PM). Socially, air pollution has become the biggest environmental cause of premature death with a value of $1.6 trillion, almost the size of the Canadian economy, and road transport is likely responsible for about half of that (OECD Citation2014). Economically, congestion across the United States, United Kingdom and Germany alone cost close to $461 billion in 2017 or $975 per capita (INRIX 2017 Traffic Scorecard).
Technology and in particular artificial intelligence (AI) and machine learning (ML), based on existing information sources, can help to understand and predict traffic volumes during days, weeks and seasons and enable simulation of alternative solutions to smooth flows and reduce congestion. Data and AI-driven advanced traffic analysis and management is an important component of smart city and smart port developments. The transformation towards smart cities (Eremia, Toma, and Sanduleac Citation2017) and smart ports (Lind et al. Citation2020b) requires large-scale digitalisation of businesses, governmental services, buildings, and transport systems. The sharing and holistic use of data (Endsley Citation1995) is an important aspect of port-city integration.
As a real-life study we have chosen the port city of Valencia, Spain. The Port of Valencia is the largest port in terms of import, export, and transshipment operations in the Mediterranean region. In 2021, the city port has become the fifth largest port in Europe in container traffic volume. Its steady growth of freight volumes has caused continuous increases in the level of congestion in peak traffic times. As a conurbation Valencia is linked to one of Spain’s main motorways (the CV-30 road) that connects several city areas. The regular road congestion is having an impact not only on port efficiency but also on the well-being of city dwellers and port workers. The application of traffic prediction algorithms as the basis for flow optimisation is considered by the port and city planners to be a key risk mitigator to explore.
This article reflects on optimising the utilisation of road transport infrastructure to reduce GHG emissions in the Valencia port city environment through applying analytical approaches empowered by publicly available and shared data. Based on this real-life study case with data from the Port of Valencia we reflect on how to better predict and synchronise port-bound road traffic flows in the port city of Valencia. The contribution starts with setting the scene and providing the context, followed by a more technical description of an AI system, before we conclude with implications and key considerations for relevant stakeholders, such as decision-makers at port authorities and local governments, and city and port planners who are using such new tools.
The Valencia case shows that data, data sharing and AI systems can contribute to reducing congestion and with that GHG emissions and other negative impacts, some of which were mentioned before. AI system-powered analysis and simulation can help to flatten peaks and increase infrastructure productivity through, in this case study, modifying the operating hours of a city port.
1. The ‘smart’ concept in a port city context
Connectivity and wealth are linked. Connectivity was foundational to the global ‘Wirtschaftswunder’ (‘economic miracle’) called globalisation which was powered by the logistical links between major economic centres and cities across the globe. The 21st century goods trade, where about 90 percent is moved over the oceans, requires not only physical but also digital connectivity (Lind et al. Citation2020a). The resultant multi-layered international connectivity has spawned a global network of nodes/hubs, linking up economic centres and cities. This network gives people across the globe access to resources and capabilities that are unequally spread and otherwise difficult to access. This maritime logistics network is the backbone of the global economy. The better a city is integrated, the broader the set of possibilities to generate wealth. Digital tools, including AI and ML help to better manage the flows and optimise ships, fleets, and voyages. The more optimised the network, the lower the GHG emissions.
City ports or in its broader sense port cities are important hubs in the multimodal (global) supply chain networks which engage different modes of transport such as shortsea, feeder and inland waterways shipping, road, rail, river and even air transport, as well as transport nodes like other seaports, inland ports, or combi terminals. A transport node is a transition point where the goods or people carried by the network shift from one carrier to another, within the same mode or between different modes of transport. Historically, the focus of seaports has been on ensuring that the visits of each means of transport are as optimised as possible, but attention now needs to be directed to making the entire port logistics chain efficient (Ascencio et al. Citation2014; Vieira, Neto, and Ribeiro Citation2015). When adopting a perspective of the port as a logistical node within a global network or system that generates wealth not only for the port city but also for places far beyond its location, we need to investigate how those different means of transport are inter-linked. In the context of port cities, the cities and the ports should co-develop and implement common practices of synchronisation (Jugović, Sirotić, and Peronja Citation2021).
Over time the volumes carried by the maritime logistics network tend to grow, driving a continuous increase in capacity including expansions of ports and growth of port-bound road traffic, congestion and related GHG emissions. Smart cities and ports can deploy technological solutions to mitigate such downsides.
A prerequisite for making ports and cities smart is data sharing and analytics as a foundation for global digital integration and the management of the movement of goods and people in a holistic fashion. In the port context, digital integration plays out on multiple layers, first within the port, second between the port and the city (or the larger city area the port is located in), third between the port and the hinterland (the landside area the port is serving (which is connected through a multimodal network)), fourth between the port and the sea-side (the carriers and other data generating and data gathering entities or infrastructure), and fifth, between the port and other connected ports across the global networks. These five areas and related communities, namely port, city, hinterland, seaside, and the global network of ports are increasingly digitally connected to ensure optimal fluidity of the movements of goods through interfaced systems and data exchange for far-reaching synchronisation of the flows handled by the different actors to reduce delays, costs, and GHG emissions. With that also the global maritime network is becoming increasingly smart. Digital connectivity is the key to reaching the next level of optimisation within city ports, port cities and the global network of ports and cities. This enables the sharing of data between relevant parties. Important data providers for the optimisation of port container traffic are port authorities and port/ship terminal operators. Although model development, predictions and simulation can be performed using only publicly available data, sharing data helps to optimise outputs.
In our understanding, the ‘smart’ concept goes beyond solely economic considerations and should also include the social and environmental dimensions. ‘Smart’ results from a bundle of technologies that should be used to make the port more sustainable in an economic, social, and environmental sense. ‘The sustainable port is a node that generates value-creating services for its customers, owners, and the outside world. The sustainable port is operated on a commercial basis and as a transport node, the port contributes to a sustainable use of the transport system by being an integral part of global, regional, and local transport systems where different modes of transport are included and interact’ (project I.Hamn). Without digitalisation and integration there is no smart port (Lind et al. Citation2020b) and smart port city. Ports also have a great possibility to act as energy nodes supplying sustainable energy to the various transport systems being used (Lind et al. Citation2020c). Considering the increasing pressure for the sector to become more sustainable, both seaborne and inland waterways transport can contribute to introducing sustainable energy. The sustainable port is thus to be conceived as a sustainable transport node (Lind et al. Citation2021b), energy node (Lind et al. Citation2020c), and digital node (see ) (Lind et al. Citation2021a).
Figure 1. The sustainable port as a transport node, energy node, and digital node (Lind et al. Citation2021a; Illustration: Sandra Haraldson).

A port network requires road movements and other modes of transport which carry freight from and to ships to function. The road transport industry which is continuously growing and amongst the hardest to decarbonise, faces rising scrutiny in particular because of the health and climate risks it causes. Also, modes like road and rail are getting smarter.
When dealing with port and city planning and traffic management data is a prerequisite to produce satisfactory results (Gurzhiy et al. Citation2021). The main assumption is that to be able to cope more efficiently with variation in inbound and outbound port road traffic volumes in city traffic management, it is necessary to model and predict this over time as early and accurately as possible. Data and AI can reveal the patterns that provide the baseline to better understand idle and peak situations. The analysis also provides indication about gaps and adjustments that may optimise the situation. Data and AI allow the simulation of future scenarios to compare alternative options.
2. AI system development to optimise port container exit flows
Research has previously been performed in the field of intelligent transport systems and simulation on modelling hinterland traffic rates generated by ports on multiple time scales from yearly trends down to hourly predictions, as summarised recently in Nadi et al. (Citation2021). Relevant examples focusing on daily or weekly traffic predictions include, e.g. Li, Tan, and Tran (Citation2016), where detailed truck traffic simulation of a bulk port is implemented, Xie and Huynh (Citation2010) where Kernel-based methods are compared with neural network models in predicting daily truck traffic rates based on cargo operations events during a fixed preceding time range, and Luo and Huang (Citation2020), where wavelet neural networks are applied to predict truck flow rates based on discharged cargo volumes from vessels.
The Monte Carlo simulation approach that we highlight in this article is transparent and explainable and allows evaluation of the effects of multiple component models on the overall prediction accuracy and time range. The approach allows simulating, for example, changes in parameters such as operating hours more flexibly than black box traffic rate regression models such as those considered in Xie and Huynh (Citation2010) and Luo and Huang (Citation2020), without requiring model retraining.
In this article, our focus is not on quantitative analysis of component model performance, but rather on using the considered modelling framework to highlight relevant data sharing needs from a practical perspective where, ideally, model development and predictions could be performed using only publicly available data, but in practice sharing of (often more sensitive) data at least in the model training phase is beneficial to optimise predictions. Furthermore, we consider the potential advantage in increased prediction time range achievable by using modern ML methods for global vessel schedule prediction to support the hinterland traffic simulations.
Collaboration already happens between city ports and city traffic management through the sharing of, for example, vehicle traffic rate estimates related to ro-ro (roll-on/roll-off) vessel port calls where land vehicle entries and exits mainly coincide with vessel port call schedules. However, this represents only a small subset of traffic in many city ports such as Valencia. As will be demonstrated in this article, the relationship between port call schedules and truck traffic is much more complex for container vessels, and related traffic coordination requires the kind of predictive models discussed below.
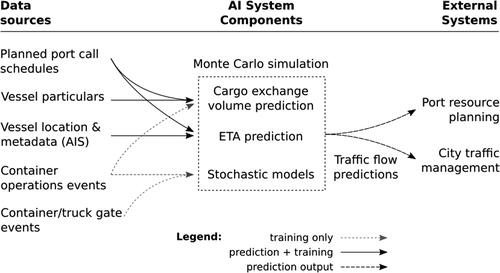
This article outlines an AI system which predicts container traffic flow rates between the port and city by combining machine learning and stochastic models to implement predictive simulations. The predictions are based on integrated information from multiple data sources along the multimodal supply chain, from global vessel information systems to local port community systems providing port call plans to terminal and port operating systems providing cargo and hinterland carrier time event data. The produced traffic flow predictions can be used, for example, by port authorities and operators to plan resources according to predicted congestion, or by city traffic management to prepare in advance for peaks in truck traffic caused by port operations. illustrates the AI system components, inputs, and potential applications.
Figure 2. System overview.
We demonstrate an application of this modelling approach using datasets from one of the terminals of the Port of Valencia, Spain. Port of Valencia suits the analysis well since the port is situated next to the city and trucks need to pass through the city for container deliveries and container pick-ups. Upon the arrival of large ships, substantial congestions build up within the city. While traffic peaks could be reduced, for example, by expanding the opening hours of the port (as demonstrated also by simulations in this article), it would be much more efficient to target the use of resources such as extended operation times only to those days or weeks where traffic peaks will occur. Such targeted resource allocation requires the kind of prediction capability provided by the model being discussed in this article.
The port of Valencia is the fifth busiest seaport in Europe and the busiest port in the Mediterranean. It is situated within the city of Valencia, less than five kilometres from the city centre. Close vicinity to the city highlights the need for the port to operate under strict sustainability guidelines, as outlined in the Port Authority of Valencia’s Environmental and Energy PolicyFootnote1. Quoting this policy, Shipping is an essential element in the flow and exchange of goods. Modern port management and market competition have led port companies to concentrate and increase the volume of their activities and accordingly, they use ever larger amounts of resources, which makes the inclusion of ecoefficient management criteria increasingly more important. One of the business strategy priorities of the Port Authority of Valencia, as the managing body of one of the main port areas in the Mediterranean, is sustainable development, combining respect for the environment with the economic and social growth of port activities in the facilities it manages.
One of the key targets in the sustainability policy of the port is prevention and minimisation of emissions, consumption, discharges, noise, and waste produced because of its activities. A key motivation of the work presented in this article is to provide tools for better predicting the truck congestion which contributes to emission and noise in the port city. Being able to predict congestion is seen as an important enabler for taking steps to reduce related disadvantages.
2.1. Data requirements
A significant characteristic of the AI system that we are discussing here is that operational data which is typically considered sensitive, such as container exchange volumes, cargo operations timestamps, and gate event timestamps are only required as reference data to train machine learning models and to configure stochastic models. These do not retain information on individual events, but rather represent the related processes statistically.
Once the component models of the prediction system have been properly trained and configured, only publicly shareable vessel scheduling information is required to produce predictions. Therefore, it is possible to perform the necessary modelling in collaboration with, for example, port operators without sharing sensitive information to a wider group of actors, while still enabling the use of the resulting prediction system also by external parties. In the following we outline the specific datasets used in this study for model training and performing predictions.
2.2. Model training
We apply a predictive simulation model for container traffic at Port of Valencia, Spain, using multiple historical datasets on vessel port call schedules, vessel particulars (e.g. characteristics such as vessel size and gross tonnage), cargo operations events (e.g. container-level load and discharge event times), and port gate events (e.g. arrival and departure times of trucks and containers at the gate). More specifically, the following data were available for the study for the year 2019:
Vessel port call history. Features used for the model development include
Actual vessel arrival times at port
Estimated arrival and departure times
Port call and vessel identifiers
Container operations events from one terminal operator, including
Source ports for discharged containers
Indicators for operation type (discharge/load) and containers carried out of the port by train
113 637 total container events (54 810 load, 58 827 discharge)
Port call and container identifiers to combine datasets
Truck and container gate entry and exit timestamps
127 509 container gate exit events in total
Including container identifiers enabling combining with cargo discharge events
The modelling is limited to the subset of data where timing information is available for all steps of the cargo flow in the port, including vessel arrival, container discharge, and exit through the gate by truck. This subset contains a total of 7751 container exits, which is a relatively small subset of the total traffic out of the port, but sufficient for statistical analysis and demonstrating the considered modelling principle. Usually, each truck carries one container, but in some cases, they could carry two. This dataset contains only cases where each truck carries a single container. In modelling the full traffic of a port, it may be necessary to also estimate the frequency and delay characteristics of trucks carrying two containers, as neglecting this may cause bias in the modelling, depending on the frequency of such events.
The wider applicability of the prediction system requires it to be able to produce predictions by using as few input features as possible, and to use features which are widely available to parties potentially benefiting from the considered traffic predictions. We believe that if sufficient data coverage is available for model training, it is possible to produce usable predictions based only on publicly shareable port call data including basic information such as port call arrival and departure time estimates and vessel gross tonnage.
2.3. System description
The fundamental idea is that individual vessel arrival times can be estimated using existing information sources and ML models, and while it is difficult to predict the dwell time of an individual container in the port, the total flow rates of containers related to the vessel port calls can be approximated using stochastic models. In the following, we demonstrate a model for truck exit volume variation based on the available subset of container traffic data from the Port of Valencia. Truck entry volumes are not considered here due to lack of corresponding data, but the same modelling approach could be applied also for inbound traffic to the port.
The aim is to simulate the number of containers transported by trucks out of the port during a selected time range R. This is implemented as a Monte Carlo (MC) simulation (Raychaudhuri Citation2008), where the target value is obtained as
(1)
(1)
Monte Carlo simulation uses repeated random sampling to evaluate the outcome of a stochastic process. It is applied here because while we can estimate the overall probability distributions of container dwell times in the port, these do not provide reliable estimates for individual containers. Therefore, it is reasonable to also base the output rate estimation on averaging the outcome of many samples from the relevant distributions, using a Monte Carlo simulation.
Here, and
are indicator functions accounting for whether a simulated output event is within the simulation time range, or within blocked time periods, respectively. These are formally defined as
where
are the limits of the time range for which events are simulated, and
,
,
where
is a set of blocked days when no events are allowed (for example, there is typically no truck traffic in the Port of Valencia on Sundays).
and
are i.i.d random variables corresponding to the delay between vessel arrival and container discharge and the delay between container discharge and gate exit, respectively. In the simplest case, we assume that these distributions are not dependent on variables such as time or container discharge location within the port, but thanks to larger datasets such dependencies could be taken into account for example by applying ML models.
is the arrival time of vessel j, where
These times are obtained either as actual observed vessel arrival times or as estimates of future arrival times using planned arrival times or estimated time of arrival (ETA) prediction models.
is a random variable used to shift generated exit times falling on blocked days. This is a heuristic meant to disperse values more evenly around the blocked days instead of, for example, simply shifting the events to the next possible time. In the considered examples, a uniform distribution is used with a range of approximately one week.
is the number of containers discharged from vessel j estimated to be leaving the port by truck. This is a critical parameter for the simulation, which should ideally be obtained from port/terminal/ship operators, shipping agents, and port authorities. Alternatively, this number can also be estimated using dedicated models, as considered below.
is the number of vessels predicted to be arriving to the port contributing to the traffic simulation.
is the Monte Carlo simulation parameter specifying how many trials are performed to obtain the cargo flow estimates.
We consider the above Monte Carlo simulation model for predicting the number of containers exiting the port of Valencia by truck during 2019. This study is limited to the subset of container traffic for which vessel discharge and gate event data is available and can be considered as a demonstration of the simulation method outlined above. The same approach is applicable to extended datasets and potentially also to other transport modalities such as containers leaving the port by train or feeder vessels, and containers entering the port.
In our example, the vessel arrival times are obtained from the records of actual times of arrival in the Valencia port call dataset, and the numbers of outbound containers by truck
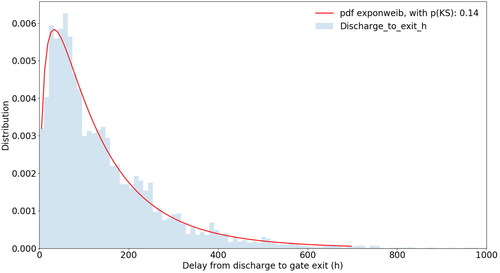
are estimated from the container operations and gate events datasets. The distributions for the discharge and gate exit delays
and
are estimated empirically by fitting to the observed events. The sample distributions and best matching fits (based on a Kolmogorov-Smirnov test (Kolmogorov Citation2008)) are illustrated in and . These follow the beta and exponentiated Weibull distributions, respectively.
Figure 3. Distribution of times from vessel arrival to container discharge ().
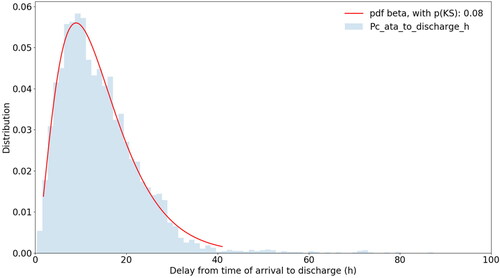
Figure 4. Distribution of times from container discharge to gate exit ().
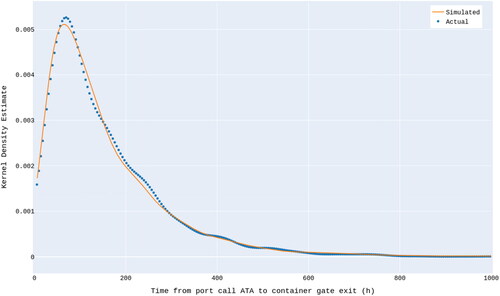
The combination of the random variables estimates the total dwell time of a container in the port. illustrates the distribution of the simulated dwell times compared to the actual observed events.
Figure 5. Kernel density estimates of the empirical distributions of actual and simulated total container dwell times in the port of Valencia.
Using the above-described distributions for the random variables, we can perform Monte Carlo simulations of the gate traffic rates as described in Equationequation (1)
(1)
(1) . shows weekly simulated versus true container exit numbers for 2019.
Figure 6. Simulated vs. actual weekly numbers of containers leaving Port of Valencia by truck.
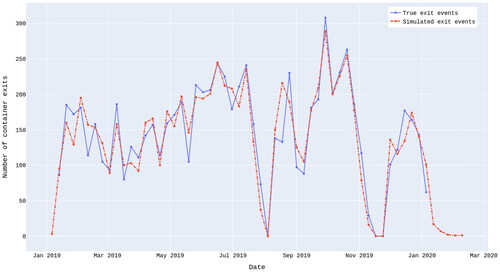
In addition to the discharge and port dwell time distributions, which are here assumed to be stationary, the main dynamic inputs needed for the model described above are the vessel arrival times and numbers of containers to be discharged per vessel to be carried out of the port by trucks. Of these, the container discharge numbers can be expected to be more difficult to obtain, as terminal operators typically do not share such cargo exchange information publicly.
Below, we consider the effect on the traffic rate simulation of applying a separate ML model for predicting the container discharge numbers. For a subset of 424 port calls in the Valencia dataset we have both cargo exchange information and detailed port call and vessel information available. To predict the number of containers discharged per port call, we apply the XGBoost extreme gradient boosting library (Chen and Guestrin Citation2016) to train a decision tree-based regression model which uses as features the vessel size information, estimated port call duration as reported by shipping agents before the port calls, and the arrival time of the vessel to the port. XGBoost is one of the most common frameworks for implementing ML regression models with structured data. For details on the model architecture and training process see, for example, the original publication in Chen and Guestrin (Citation2016).
The model hyperparameters were optimised by nested cross-validation (Varma and Simon Citation2006), which also provided test data for performance evaluation. The modelling results are summarised in and . Note that the ‘F score’ presented in is not related to the F-score used in statistical analysis of binary classification but represents the basic feature importance score of the XGBoost model quantising the impact of each input variable to the trained model.
Figure 7. Feature importance histogram of the features used in predicting the number of containers to be discharged per port call. ‘EstortCallDurationHours’ is the estimated port call duration as reported in advance for each port call, and ‘vesselGT’ is the gross tonnage of the vessel.
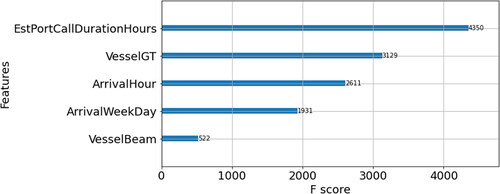
Figure 8. Histogram of prediction error for the example regression model predicting the numbers of containers discharged per vessel. The mean absolute prediction error is 39, with standard deviation 52, and median 21. The mean number of containers discharged per port call in the dataset was 101, with standard deviation 151.
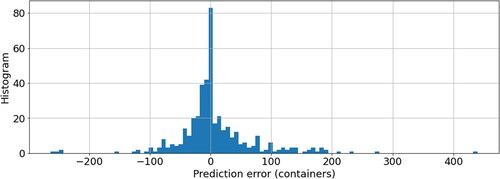
It should be noted that the dataset available for training this model was relatively small, and better performance can be expected using a larger historical dataset or additional features giving information on the container exchange amounts. However, we can use this model to demonstrate the effect of imperfect information in the overall container traffic simulation model.
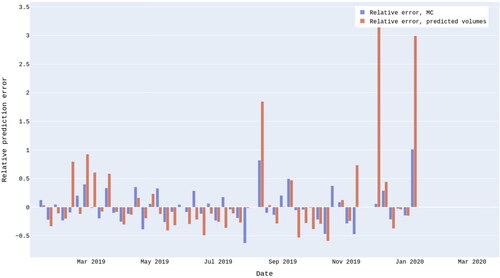
When using the above-described regression model in the Monte Carlo simulation, we also need to consider that not all discharged containers exit the port by truck. Since in the available dataset there is no information that could be used to predict the ratio of transport modalities per port call, we use the observed average of 20 percent exits by truck to scale the number of predicted discharged containers for each port call. Applying the scaled model output in the MC simulation model, we obtained the predictions illustrated in .
Figure 9. Relative prediction error per week for the Monte Carlo model using true container discharge numbers (blue bars) vs. applying container discharge numbers predicted by an XGBoost regression model (orange bars). The median absolute relative error using the true container numbers was 12.6%, while using the predicted container numbers this was 24.2%. The latter also produces more significant outliers in the predicted weekly traffic rates.
How far in the future can the model be applied? What is the prediction horizon is a relevant question regarding the application possibilities of the predictive simulation model that we are describing here. This is determined by the availability of vessel arrival time information and the total container dwell time distribution of the port as illustrated in . In the current case study, the average dwell time of a container from vessel arrival to gate exit is approximately 160 hours (6–7 days). This indicates that the model can be applied on a time scale of one week forward if vessel arrival times are based on actual events, meaning that, the model would be applied only for vessels which have already arrived at the port.
However, in practice vessels do not arrive at port unannounced, and port actors have advance information on planned port calls over varying time horizons. The main challenge in applying this information for predictive modelling is that currently data is not generally shared effectively or automatically between actors. Terminal operators or shipping agents, for example, may have relevant scheduling information available long before this is shared with port authorities or external organisations.
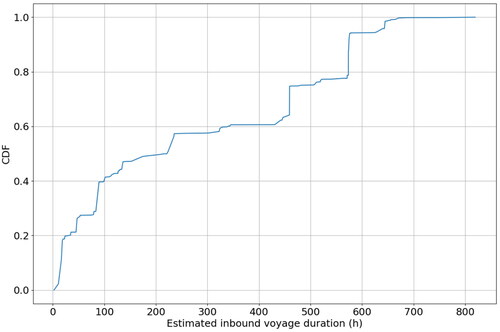
To quantify the time scale at which vessel schedule information can be assumed to be available, we considered the voyage durations of container vessels arriving at the port. Once a vessel has departed the previous port of call, we can assume that information on the destination of the current voyage exists, and also the arrival time of the vessel to the next destination can generally be estimated using, for example, ML models or data-driven analytics (Alessandrini, Mazzarella, and Vespe Citation2019) or publicly available information from the vessel – commercial vessels are required to share their location and schedule information through the global automatic identification system (AIS).
shows the estimated cumulative distribution of voyage durations of container shipments arriving at Port of Valencia according to the available dataset. Here the mean travel time is approximately 270 hours (11.25 days). Combining this with the port dwell time analysis, the estimated mean time from a container departing the previous port to its exit by truck at Valencia is approximately 430 hours, (just over two and a half weeks). This shows that it is valuable to apply vessel estimated time of arrival (ETA) predictions in the traffic rate simulation model to extend the prediction time horizon.
Figure 10. Cumulative distribution of estimated voyage durations for container arrivals to Port of Valencia.
The results above demonstrate that when suitable historical data on port operations are available for ML model development, it is possible to construct an AI system that predicts traffic rates across transport modalities in a port. Specifically, we demonstrated that even based on public vessel schedule information only, useful predictive models for truck traffic rates can be applied on varying time scales. Furthermore, we also demonstrated how data sharing of information such as cargo exchange or advanced vessel scheduling information helps to improve prediction accuracy and time range.
2.4. Application example: simulating operational changes to reduce variation of traffic levels
In the following we consider cases where gate events are simulated without the spreading term S in Equationequation (1)(1)
(1) . This means that the port is assumed to operate continuously, and traffic events can occur at any time and date.
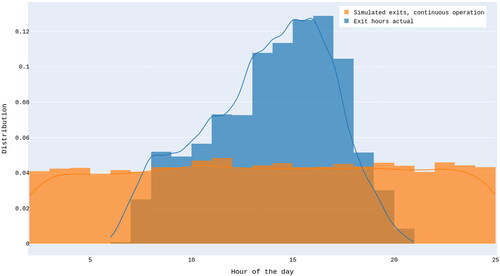
The figure below shows the actual distribution of gate exit events by hour of the day, and the simulated distribution of exit events when no hourly restrictions are set. In reality, the distribution would probably not be this uniform even if the port was operating continuously, but the outcome of the simulation indicates that there is capacity for distributing traffic more evenly.
This observation also means that the opportunities for port-city integration once realised may significantly reduce the congestion induced burdens like GHG and other emissions on city ports and port cities mitigating climate and health risks of city dwellers and port workers ().
Figure 11. Actual distribution of exit events by hour of the day compared with a hypothetical scenario where the port is open 24 hours a day.
shows actual and simulated daily numbers of truck exit events for the first half of 2019, and a hypothetical simulation where the port is operating continuously, meaning that events are allowed also during Saturdays, Sundays, and holidays.
Figure 12. Daily event rates from observation data, simulations, and simulations assuming continuous operation of the port.
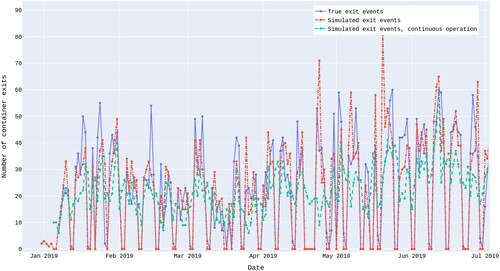
On the daily scope, this has a significant effect on the variation of event rates, as demonstrated by the statistics in . In this simulation, the standard deviation of the number of events per day (considering only the active days) is reduced by 30–40% if continuous traffic is enabled. The table compares the actual and predicted statistics for daily exit events at Port of Valencia.
Table 1. Comparison of statistics for daily exit event numbers for true traffic, simulated traffic with actual port operation days, and simulated traffic for a hypothetical scenario where the port is operating seven days a week. Only active days are included in the statistics.
From the table, the conclusion can be drawn that Valencia would experience less congestions and emissions if the opening hours of its port were expanded. Another alternative would be to allow for longer storage of containers within the port area, but that has a cost to capital impact and leads to extended delivery times too.
3. Implications and some key considerations
The application examples described in this article are simplified but certainly serve to demonstrate how the modelling approach that we have described could be adapted to simulate effects of changes in operational parameters. Our study shows only initial outcomes of the AI system based on broad and high-level assumptions, but so far, the approach and technologies have proven to be robust and reliable. Furthermore, the impact on traffic flows indicated by the analysis and outcomes even at this small scope is certainly encouraging.
The results of the Port of Valencia real-life study case on predictability and simulation indicate the benefits that AI systems can bring to planners and decision-makers in port cities and city ports alike. The new approach to optimising port-bound container traffic flows in a port city environment allows to identify operational models that reduce congestion and thereby GHG and other emissions. This represents a small but important step towards an improved synchronisation of flows across the entire city environment and the global networks of the movement of people and goods.
The implementation of such AI-powered approaches can not only benefit port cities and city ports but entire ecosystems like the global maritime supply chain network. That such changes are feasible is illustrated by the shift of the ports of Los Angeles and Long Beach to a 24/7 mode in September and October 2021. The change was implemented to reduce extreme waiting times on the seaside and the landside at both ports. The impact of the change in operating hours implemented last year was a reduction of queues of vessels and trucks alike. The ports themselves could increase their throughput. A real-life case decision-makers and planners in port cities, ports and other nodes of transport can use as a basis of reflection and experimentation.
But digital transformation is not only about technology. Digital transformation is as much about people as about technologies. AI systems are based on trust and data sharing. Building trust hinges on the involvement of trustworthy parties and their communication and actions. The adoption of AI systems relies on a general understanding across major actors. In the Valencia case it has been about accepting that optimising traffic flows in the port city as a part of the interconnected and interdependent self-organising world of maritime supply chains requires belief in advanced technology, a holistic view and a minimum level of collaboration in respect to data sharing between port authority, port/terminal/ship operators, and shipping agents. A lesson that should guide others that consider the implementation of advanced technology-based solutions.
While thinking and technology is advancing the major challenge remains the implementation of necessary adjustments to policies and practices. It was probably the port congestion crisis that made the swift modifications of operating hours at the ports of Los Angeles and Long Beach possible. Dependent on the location, continuous port operations may need changes to current labour contracts or even regulations requiring consent of several stakeholder groups. Stakeholder and project management will therefore not only come handy in such change programs but in digital transformation projects in general. Appointing a well-skilled person to lead the effort has always been the most critical but also challenging task.
Gradually, data and advanced analytics will make cities and ports smart. It may take some time but with the maturity of AI-driven systems and the increasing number of studies and pilots being conducted in the private and public sector the level of awareness, knowledge and trust in such solutions will solidify encouraging their implementation and bringing ports and cities to the next level of performance.
Disclosure statement
No potential conflict of interest was reported by the author(s).
Additional information
Funding
Notes
References
- Alessandrini, A., F. Mazzarella, and M. Vespe. 2019. “Estimated Time of Arrival Using Historical Vessel Tracking Data.” IEEE Transactions on Intelligent Transportation Systems 20 (1): 7–15.
- Ascencio, L. M., R. G. González-Ramírez, L. A. Bearzotti, N. R. Smith, and J. F. Camacho-Vallejo. 2014. “A Collaborative Supply Chain Management System for a Maritime Port Logistics Chain.” Journal of Applied Research and Technology 12 (3): 444–458.
- Barth, M., and K. Boriboonsomsin. 2009. “Traffic Congestion and Greenhouse Gases.” Access Magazine 1 (35): 2–3. https://escholarship.org/content/qt3vz7t3db/qt3vz7t3db.pdf
- Chen, T., and C. Guestrin. 2016. “XGBoost: A Scalable Tree Boosting System.” In Proceedings of the 22nd ACM SIGKDD International Conference on Knowledge Discovery and Data Mining, 785–794. New York: ACM. https://doi.org/10.1145/2939672.2939785
- Dimitriou, H. T., J. E. Ward, and P. G. Wright. 2015. Lessons for Mega Transport Project Developments and the Future of UK Cities and Regions. London: OMEGA Centre, Bartlett School of Planning University College London.
- Endsley, M. R. 1995. “Toward a Theory of Situation Awareness in Dynamic Systems.” Human Factors: The Journal of the Human Factors and Ergonomics Society 37 (1): 32–64.
- Eremia, M., L. Toma, and M. Sanduleac. 2017. “The Smart City Concept in the 21st Century.” Procedia Engineering 181 (2017): 12–19.
- Gurzhiy, A., S. Kalyazina, S. Maydanova, and R. Marchenko. 2021. “Port and City Integration: Transportation Aspect.” Transportation Research Procedia 54: 890–899.
- Jugović, Alen, Miljen Sirotić, and Ivan Peronja. 2021. “Sustainable Development of Port Cities from the Perspective of Transition Management.” Transactions on Maritime Science 10 (2): 466–476. · November 2021
- Kolmogorov, A. N. 2008. “Kolmogorov–Smirnov Test.” In The Concise Encyclopedia of Statistics, edited by Y. Dodge, 283–287. New York: Springer. https://doi.org/10.1007/978-0-387-32833-1_214
- Li, B., K. W. Tan, and K. T. Tran. 2016. “Traffic Simulation Model for Port Planning and Congestion Prevention.” In Proceedings of the 2016 Winter Simulation Conference (WSC), 2382–2393.
- Lind, M., M. Michaelides, R. Ward, and R. T. Watson. 2020a. Maritime Informatics. Heidelberg: Springer.
- Lind, M., M. Michaelides, R. Ward, and R. T. Watson. 2021b. Maritime Informatics: Additional Perspectives and Applications. Heidelberg: Springer.
- Lind, M., S. Haraldson, K. Lind, W. Lehmacher, M. Svan, M. Renz, J. Gardeitchik, S. Singh, and P. Zuesongdham. 2021a. “Ports of Tomorrow: Measuring Digital Maturity to Empower Sustainable Port Operations and Business Ecosystems.” Article No. Article No. 82 [UNCTAD Transport and Trade Facilitation Newsletter N°92 – Fourth Quarter 2021]. https://unctad.org/news/ports-tomorrow-measuring-digital-maturity-empower-sustainable-port-operations-and-business
- Lind, M., S. Pettersson, J. Karlsson, B. Steijaert, P. Hermansson, S. Haraldson, M. Axell, and A. Zerem. 2020c. “Sustainable Ports as Energy Hubs.” The Maritime Executive, November 27. https://www.maritime-executive.com/editorials/sustainable-ports-as-energy-hubs
- Lind, M., W. Lehmacher, S. Haraldson, X. Fu, P. Zuesongdham, R. Huesmann, and S. Fich. 2020b. “Smart Ports as Lighthouse Nodes of Supply Chain Networks.” Port Technology International – the e-Journal of Ports and Terminals 104-2020. https://www.porttechnology.org/technical-papers/smart-ports-as-lighthouse-nodes-of-supply-chain-networks/
- Luo, Y., and L. Huang. 2020. “Port Short-Term Truck Flow Forecasting Model Based on Wavelet Neural Network.” In Proceedings of the International Conference on Intelligent Transportation, Big Data & Smart City (ICITBS), 43–47.
- Nadi, A., S. Sharma, M. Snelder, T. Bakri, H. van Lint, and L. Tavasszy. 2021. “Short-Term Prediction of Outbound Truck Traffic from the Exchange of Information in Logistics Hubs: A Case Study for the Port of Rotterdam.” Transportation Research Part C: Emerging Technologies 127: 103111. https://doi.org/10.1016/j.trc.2021.103111.
- OECD. 2014. The Cost of Air Pollution: Health Impacts of Road Transport. Paris: OECD Publishing. https://doi.org/10.1787/9789264210448-en.
- Raychaudhuri, S. 2008. “Introduction to Monte Carlo Simulation.” In Proceedings of the 2008 Winter Simulation Conference, 91–100.
- Varma, S., and R. Simon. 2006. “Bias in Error Estimation When Using Cross-Validation for Model Selection.” BMC Bioinformatics 7: 91. https://doi.org/10.1186/1471-2105-7-91.
- Vieira, G. B. B., F. J. K. Neto, and J. L. D. Ribeiro. 2015. “The Rationalization of Port Logistics Activities: A Study at Port of Santos (Brazil).” International Journal of e-Navigation and Maritime Economy 2: 73–86.
- Xie, Y., and N. Huynh. 2010. “Kernel-Based Machine Learning Methods for 18odelling Daily Truck Volume at Seaport Terminals.” In Proceedings of the 51st Annual Transportation Research Forum, Arlington, VA, March 11–13.