
Abstract
RATIONALE
There is limited real-world evidence on evaluation of chronic disease management initiatives provided by general physicians to patients with chronic obstructive pulmonary disease (COPD).
OBJECTIVES
We aimed to evaluate changes in COPD-related healthcare resource utilization between COPD patients who had general physician’s provided comprehensive annual care plan (CACP) and those who did not have CACP.
METHODS
We conducted a retrospective cohort study using health administrative data (Alberta) from 2009 to 2016. COPD patients who received a CACP were identified and matched with two control patients based on age, sex, provider, date of service and qualifying comorbidities. Controlled interrupted-time series analysis was used to evaluate changes in COPD-specific hospitalizations, emergency department (ED) visits, physician visits and claims for pulmonary function test (PFT). Immediate and temporal changes were calculated for the difference in outcomes 1 year before and 1 year after receiving the CACP for the intervention group and matched controls.
RESULTS
Eligible patients (N = 88,002), of whom 35,847 had received CACPs were matched to a total of 52,155 controls. In 1 year after the CACPs implementation the number of COPD-related hospitalization visits significantly increased by 105.33 (95% CI 58.17-152.49), ED visits increased by 172.65 (95% CI 168.09–177.20), general practitioners (GP) visits increased by 359.53 (95% CI 247.64–471.41), specialist visits increased by 77.21 (95% CI 31.58–122.85) and PFT claims increased by 50.82 (95% CI 35.33–66.30) when compared to the controls who did not receive CACP per 10,000 patients per month. However, only increase in ED and specialist visits was confirmed by the sensitivity analysis.
CONCLUSIONS
Annual care plans provided by physicians were found to be associated with a statistically significant increase in COPD-related events (including ED visits) in the following year; however, clinical significance was minimal.
RÉSUMÉ
JUSTIFICATION
Il existe peu de données concrètes sur l'évaluation des initiatives de prise en charge des maladies chroniques offertes par les médecins généralistes aux patients atteints de MPOC.
OBJECTIFS
Nous avons cherché à évaluer les changements dans l'utilisation des ressources de santé liées à la MPOC chez les patients atteints de MPOC ayant bénéficié d'un plan de soins annuel complet offert par un médecin généraliste et ceux qui n'ont pas bénéficié d'un tel plan.
METHODES
Nous avons mené une étude de cohorte rétrospective à l’aide de données administratives de santé (Alberta) de 2009 à 2016. Les patients atteints de MPOC ayant bénéficié d’un plan de soins annuel complet ont été répertoriés et appariés à deux patients témoins en fonction de l'âge, du sexe, du prestataire, de la date de service et des comorbidités admissibles. Une analyse contrôlée de séries temporelles interrompues a été utilisée pour évaluer les changements dans les hospitalisations spécifiques à la MPOC, les visites aux urgences, les visites chez le médecin et les demandes de tests de la fonction pulmonaire (TFP). Les changements immédiats et temporels ont été calculés pour déterminer la différence dans les résultats un an avant et un an après avoir bénéficié d’un plan de soins annuel complet pour le groupe d'intervention et les témoins appariés.
RESULTATS
Les patients admissibles (N = 88 002), dont 35 847 avaient bénéficié d’un plan de soins annuels complet, ont été appariés à un total de 52 155 témoins. Un an après la mise en œuvre du plan, le nombre d'hospitalisations liées à la MPOC a augmenté de 105,33 (IC 58,17-152,49), les visites aux urgences ont augmenté de 172,65 (IC 168,09-177,20), les visites chez les médecins généralistes ont augmenté de 359,53 (IC 247,64-471,41), les consultations de spécialistes ont augmenté de 77,21 (IC 31,58-122,85) et les demandes de tests de la fonction pulmonaire ont augmenté de 50,82 (IC 35,33-66,30) par rapport aux témoins qui n'ont pas bénéficié d’un plan de soins annuel complet par 10 000 patients par mois. Cependant, seule l'augmentation des visites aux urgences et chez les spécialistes a été confirmée par l'analyse de sensibilité.
CONCLUSIONS
Les plans de soins annuels offerts par les médecins ont été associés à une augmentation statistiquement significative des événements liés à la MPOC (y compris les visites aux urgences) au cours de l'année suivante, mais la signification clinique était minime.
Introduction
Chronic obstructive pulmonary disease (COPD) is a major target condition for chronic disease management (CDM) initiatives such as comprehensive care plans, medication therapy management and integrated disease management.Citation1–3 These initiatives aim to align with key evidence-based recommendations to address gaps in COPD care, including strategies to prevent and manage acute exacerbations.Citation4 Existing evidence on the effectiveness of such interventions in controlled environments is promising. The Best Care COPD Program (Ontario) in primary care demonstrated not only improved quality of life and lung function but also reduced use of urgent health services, in both a randomized controlled trial as well as in the clinical program setting.Citation2,Citation5 Another retrospective observational study of a COPD integrated disease management program in primary care showed a reduction in the total number of hospital days as well as increased hospitalization preventions for participants in the program for 3–12 months.Citation6
The question remains whether the evidence from similar studies can be transferred to ongoing long-term, real-world practice and whether similar outcomes can be achieved. Importantly, the economic effectiveness of such investment (ie, reimbursement of healthcare providers to incentivize CDM) is not clearly established in Canada.Citation7 In British Columbia, the incentive payment initiative for primary care physicians decreased total health care costs for patients with COPD by CAD$496 per patient, and the program also reduced both net COPD-related hospital admissions (by 32.5 admissions per 1000 patients) and the average length of stay (by 0.6 days per regular admission).Citation8 In parallel, an interrupted time series (ITS) analysis of the same program showed a minimal amount to no change in primary care visits, continuation of care, total hospital admissions, or costs following the introduction of incentives, relative to pre-intervention periods.Citation9 The difference in results is explained by the analytical approach (ie, cross-sectional comparison vs ITS analysis).
In Alberta, between 2009 and 2020 “most responsible” primary care general practitioners (GP) were compensated (health service code 03.04 J in a fee-for-service model) for coordination of the comprehensive care of patients with complex medical needs living in their homes or in assisted living.Citation10 This initiative aimed to incentivize provision of quality care to patients with co-morbidities, emphasizing comprehensive coordinated care by means of developing a comprehensive annual care plan (CACP). The CACP was defined as a written document with key information about the patient’s medical history, current therapies, health challenges, other healthcare providers involved in the patient’s care and other relevant information that can affect the patient’s health or treatment choices. The patient’s personal values, specific health goals and health care needs were addressed, and the CACP was signed by both the patient and their care provider after being prepared. The overarching goal was to ensure optimal therapy, address patient concerns, identify and prioritize health goals so the patients were well equipped to manage their chronic condition(s). Eligibility criteria were two or more of the following conditions: asthma, diabetes, COPD, heart disease, heart failure or hypertension (Group A), or one of the Group A conditions combined with one or more of the following: obesity, mental health problems, addiction disorder or tobacco use (Group B). The CACP could be claimed once per patient per year and there was no cap on the number of CACPs claimed by a GP.Citation10
Although this initiative was implemented with the intention of improving care for patients with complex needs, including patients with COPD, no performance metrics were outlined at the start of the program. In 2014 (after 5 years of program implementation), the Auditor General highlighted the need for assessment of effectiveness of physician care plans on a continual basis.Citation11 Since then, the only effort to address this need was done by the team of coauthors, and their findings demonstrated minimal reductions in major healthcare utilization outcomes.Citation12 The effectiveness of CACPs on health care outcomes in patients with COPD, however, is still unknown. As such, the purpose of this study was to assess the effectiveness of CACPs on patients with COPD within the province of Alberta. We hypothesized that provision of CACPs reduces health services utilization. Evidence related to the effectiveness of CDM initiatives within the context of COPD care management will provide insight into how such incentives should be monitored and evaluated in real-world settings.
Methods
Data source
We conducted a population-based cohort study using health administrative data from the province of Alberta. The provincial system allows capturing healthcare records of over four million residents. Deidentified information on a population was provided by Alberta Health with the following data: (1) the Provincial Registry for basic demographic information, (2) the Discharge Abstract Database containing all hospital admission data, (3) the Ambulatory Care Classification System containing all ED visits information and (4) Alberta Physician Claims data for all outpatient physician services, including diagnosis, procedures and physician specialty. The study period covered the fiscal years 2009/2010 to 2015/2016, providing up to 7 years of data. Ethics approval was obtained from the University of Alberta’s Research Ethics Board (Pro00060499).
Study design and population
A population-based cohort study was completed using a controlled ITS method to measure healthcare service utilization while comparing COPD patients who received a CACP (CACP group) to a cohort of matched controls who had a COPD diagnosis and were eligible for the CACP, but did not receive a CACP (Control group). Eligible patients were identified through physician reimbursement billing codes (03.04 J) between 2009 and 2015. COPD diagnosis was determined based on the ICD-9-CM code (491, 492, 496) available in the submitted physician’s claim. Those patients who had less than 1 year of data prior to and following a CACP were not eligible for the study. The first occurrence of a CACP served as the index date for the CACP group. For each patient within the CACP group, we identified two matched controls who were diagnosed with COPD, but did not receive a CACP. Patients within the control group were assigned a pseudo-CACP index date which was the index date of a CACP for the intervention group. Controls were matched on the basis of age (within 5 years), sex, physician, date of service (within 1 year), and the qualifying conditions based on a 5-year history within the Alberta Health administrative data. Due to confidentiality, matching was performed by Alberta Health. Similarly, patients in control group who had less than 1 year of data prior to and following a pseudo-CACP index date were not eligible for the study.
We used a controlled ITS (CITS) design to compare change in healthcare utilization outcomes between the two groups. Traditional ITS has a limitation of not protecting from time-varying confounders, such as other interventions or historical events occurring around the time of intervention and also might contribute to the changes of the study outcome.Citation13 To address this challenge the CITS utilizes additional time-series data from a nonequivalent comparison group over the same period of time, which helps to control for history bias. “The simplest CITS analysis entails a difference-in-difference estimate where the difference between the pre- and post-intervention means in the comparison group is used as the counterfactual against which the mean difference in the treatment group is evaluated. In more complex CITS analyses, the means and slopes of the pretreatment values are used to assess not only changes in mean levels but also changes in trend, in the variation around these trends, or in the pattern of temporal variability.”Citation14 CITS takes into consideration time-varying confounders that may affect outcomes and thus increases validity.Citation13 The main goal of the controlled series is for them to have the same exposure to possible co-interventions or external events than the intervention group. CITS is not meant to compare the actual outcomes in the intervention versus control group, but rather compares pre- and post-differences, as well as changes in trends in intervention group vs changes in trends in control group. Thus, the matched comparison group is not expected to be similar in all characteristics. The purpose of the control group is to exclude time-varying confounders. For example, other events or interventions that could co-occur with the intervention of interest (provision of CACP) might be responsible for changes in the studied outcomes. Thus, analysis of the control group allows limiting this threat to validity.Citation13
Outcomes
To characterize changes in healthcare utilization we evaluated COPD-related hospitalizations, ED visits, GP visits, specialist visits, respiratory medicine (RM) visits, and pulmonary function tests (PFT) before and after the CACP index dates in both the CACP group and control group. We looked at data 1 year before and after the CACP index dates to evaluate any impact of the CACP on healthcare utilization.
Data analysis
To characterize the CACP patients and controls with respect to age, sex, comorbidity burden and qualifying conditions prior to the CACP index date (or pseudo-index date for controls) we used descriptive statistics (means, proportions). Comorbidity burden was determined using the well-validated Elixhauser Comorbidity Index, which has been shown to be effective in predicting future health care costs, health care utilization, morbidity and is widely used due to its validity in measuring disease burden.Citation15 To understand the difference in mean and total number of COPD hospitalizations, ED visits, GP visits, specialist visits, RM visits and PFTs before and after the index dates, we used interrupted time series to model healthcare resource use within each group prior to the CACP index date (or pseudo-index date for controls) and up to 1 year after.Citation13,Citation16,Citation17 As we noticed some inconsistent lower or higher number of events in the month preceding the intervention, we decided to run a sensitivity analysis with and without 30 days before and after the index date.
Within the model, all patient utilization data was aggregated into 12 monthly intervals in the year prior to and after the index dates. We included linear trend variables to represent the period of time before and after the CACP index date. We estimated the absolute effect of the CACP program at 12 months post-intervention for each outcome using the model which accounts for both the immediate level change and the change in trend over the 12 months.Citation18–19 All healthcare service utilization is presented as rates per 10,000 patients and the rate difference within the CACP group was compared to the rate difference within the control group. Since each group served as their own control, there was no need to adjust for covariates. All statistical tests were performed with SAS version 9.4 (SAS Institute Inc., Cary, NC, USA).
Results
Study population
The study included 88,002 eligible patients, of whom 35,847 (40.7%) had received CACPs (CACP group), and were matched to a total of 52,155 controls (Control group) based on age, sex, physician, qualifying conditions, and date of service. Both the CACP group and the control group consisted of 47% females. The CACP group had an average age of 65 years while the control group had an average age of 67 years (p < .0001) at the CACP index date and pseudo-index date. Other than COPD, the most commonly occurring qualifying conditions in CACP and control groups were hypertension (54% and 51%, respectively) and mental health disorder (45% and 47%, respectively). Overall, the CACP group had a lower comorbidity burden, compared to the control group, based on the baseline Elixhauser score (0.09 vs 0.20). Although overall comorbidity burden was low for both groups ().
Table 1. Characteristic of study population: qualifying conditions, comorbidity burden, and demographics.
Healthcare utilization: COPD-specific hospitalizations
When evaluating the change, among the patients who received a CACP, there was a statistically significant immediate level increase in the mean monthly number of COPD-specific hospitalizations by a rate of 25.71 per 10,000 patients (level change, p = .02) (). Subsequently, there was a significant month-to-month trend increase in the mean monthly number of COPD-specific hospitalizations of 6.63 per 10,000 patients (slope change, p < .0001) (; ). The overall effect of the program is characterized by the absolute difference which was statistically significant in favor of the control group of 105.33 (95% CI 58.17–152.49) hospitalizations per 10,000 patients after the CACP implementation, which accounts for both the level and mean monthly change in the year following the CACP.
Figure 1. Difference and overall trend in mean monthly COPD-related hospitalizations per 10,000 patients in CACP group compared to Control group. Abbreviations: CACP, comprehensive annual care plan; COPD, chronic obstructive pulmonary disease.
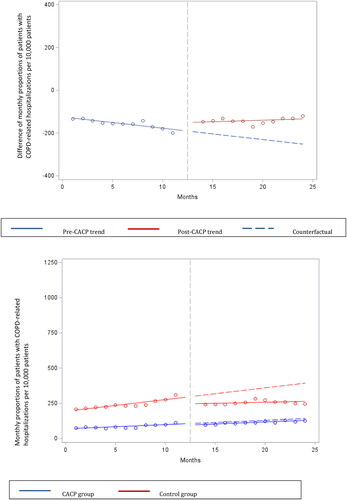
Table 2. Interrupted time series analysis of healthcare utilization before and after CACP in COPD patients (1 year pre- and post-CACP index date) per 10,000 patients.
Healthcare utilization: COPD-specific ED visits
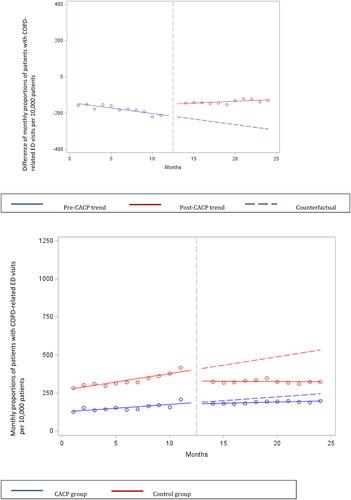
When evaluating the change, among the patients who received a CACP, there was a significant immediate level increase in the mean monthly number of COPD ED visits by a rate of 77.75 per 10,000 patients (p < .0001). Similarly, there was a significant month-to-month trend increase in the mean monthly number of COPD ED visits of 7.91 per 10,000 patients (p < .0001) (; ). A significant absolute difference of 172.65 (95% CI 168.09 to 177.20) ED visits per 10,000 patients after the CACP implementation was observed.
Figure 2. Difference and overall trend in mean monthly COPD-related ED visits per 10,000 patients in CACP group compared to Control group. Abbreviations: CACP, comprehensive annual care plan; COPD, chronic obstructive pulmonary disease.
Healthcare utilization: COPD-specific GP visits
When evaluating the change, among the patients who received a CACP, there was a significant immediate level increase in the mean monthly number of COPD GP visits by a rate of 251.29 per 10,000 patients (p < .0001) (). There was a significant month-to-month trend increase in the mean monthly number of COPD GP visits of 9.02 per 10,000 patients (p = .006) (; Online Supplementary e-Figure 1). A significant absolute difference of 359.53 (95% CI 247.64–471.41) GP visits per 10,000 patients after the CACP implementation was observed.
Healthcare utilization: COPD-specific specialist visits
When evaluating the change, among the patients who received a CACP, there was a significant immediate level increase in the mean monthly number of COPD specialist visits of 57.24 per 10,000 patients (p = .001) (). There was a non-significant month-to-month trend increase in the mean monthly number of COPD specialist visits of 1.66 per 10,000 patients (p > .05) (; Online Supplementary e-Figure 2). A significant absolute difference of 77.21 (95% CI 31.58–122.85) specialist visits per 10,000 patients after the CACP implementation was observed.
Healthcare utilization: RM visits
When evaluating the change, among the patients who received a CACP, there was a significant immediate level increase in the mean monthly number of COPD RM visits by a rate of 33.15 per 10,000 patients (p < .0001) (). There was a significant month-to-month trend increase in the mean monthly number of COPD RM visits of 1.65 per 10,000 patients (p = .02) (; Online Supplementary e-Figure 3). A significant absolute difference of 52.96 (95% CI 35.75–70.18) RM visits per 10,000 patients after the CACP implementation was observed.
Healthcare utilization: PFT
When evaluating the change, among the patients who received a CACP, there was a significant immediate level increase in the mean monthly number of PFTs of 61.39 per 10,000 patients (p < .0001) (). There was a non-significant month-to-month trend decrease in the mean monthly number of PFTs of 0.88 per 10,000 patients (p > .05) (; Online Supplementary e-Figure 4). A significant absolute difference of 50.82 (95% CI 35.33–66.3) PFTs per 10,000 patients after the CACP implementation was observed.
The sensitivity analyses results were consistent with the previously presented results for ED visits and specialist visits, whereas all other outcomes were found to be inconsistent. Specifically, COPD-related hospitalizations, GP visits and RM visits failed to demonstrate significant difference, while PFT demonstrated significant decrease (Online Supplementary Table e1, Online Supplementary Figures e5–e10).
Discussion
Our study aimed to determine the 1-year impact of physician-provided care plans to patients with COPD on healthcare utilization in the province of Alberta, Canada. We found a statistically significant increase in COPD-specific ED visits and specialist visits, and no significant change in other healthcare encounter. The number of claims for PFT following a physician-provided care plan is inconsistent. The overall effect was more apparent for ED visits; however, the clinical significance is less obvious. Our results can further be utilized for implementation and evaluation of current and future CDM initiatives for family physicians.
Overall, the low level of change in healthcare utilization for patients with COPD is consistent with previous summary studies on the effect of a fee-for-service (FFS) model in primary care on healthcare utilization and overall costs.Citation7,Citation20,Citation21 Some similarities and differences with regard to specific outcomes are worth further exploration and discussion. We did observe a significant difference in hospitalizations between the two groups, which is consistent with Lavergne et al. reporting significant increase in COPD-specific hospitalizations (by 18.8%) compared to pre-intervention period.Citation9 However, Lavergne et al. noted that the rates of COPD hospitalizations are less stable over time, and thus their results should be interpreted with caution. In their analysis, total hospitalizations for patients with COPD increased insignificantly. Our sensitivity analysis also fails to confirm the statistical results. Similarly, there were inconsistent findings for ED visits: whereas we found an increase in ED visits following CACP provision, the observed increase in Lavergne et al.’s study was insignificant. It can be proposed that patients who had CACP became more aware of their condition and symptoms of exacerbations, which could increase their intention to see a physician, including at the ED. For GP visits, our findings were consistent with Lavergne et al.’s study, with a non-significant difference observed between the pre- and post-period.Citation9
Another outcome of interest was specialist visits, and we identified a significant increase in the year following the care plan provision compared to pre-post change in the comparison group. We assert that this is a positive and expected outcome, as COPD patients generally might not receive enough specialty care compared to other chronic conditions.Citation22 Pulmonologist care is a critical part of COPD care in optimizing care and minimizing exacerbations; for example, a recent Ontario study demonstrated that the higher index of family physician-specialist continuity of care is associated with reduced hospitalizations.Citation23 Yet, data suggest that less than half of hospitalized patients were seen by a pulmonologist.Citation22
We found inconclusive results for the PFT claims. In the study by Lavergne et al., there was an increase in spirometry right after the incentive introduction which subsequently went down.Citation9 It can be explained by both GPs and specialists intending to confirm the diagnosis as many patients with COPD live without the confirmed diagnosis.
There are a number of considerations to better understand these programs, their evaluation, and future research. One is the selection of patients. Both our study, as well as that of Lavergne et al., may not have shown drastic changes in health services utilization due to relatively stable patient cohorts that are targeted by the CDM initiative. Unlike with more severe cases, there is limited room for change in this group. In a similar vein, the retrospective cohort study with Ontario data demonstrated that only around 30% of hospitalized patients had a physician follow-up within 7 days of discharge; furthermore, women, rural residents, patients without a family doctor, residents of low-income regions and those with prolonged hospital stays were less likely to have a follow-up.Citation23,Citation24 This raises the same questions of who should be targeted for the CDM initiatives and how those who are less likely to see a physician post-admission can receive more equitable care.
Another consideration in chronic management of COPD is continuity of care, including follow-up appointments. It is important to note that our study did not consider the quality or quantity of physician follow-up following the administration of CACPs. A systematic review of the literature, aimed to determine the impact of a COPD exacerbation action plan, found that an action plan, including a follow-up physician phone call, significantly reduced hospitalizations and ED visits (combined rate) for COPD patients over a 12-month period (0.59, 95% CI 0.44–0.79).Citation25 As such, future research on CDM initiatives should consider physician follow-up.
As the Canadian health care system proceeds through a transformation in primary care practice models, one challenge among many is the question of performance of primary care physicians, which is often discussed in the areas of quality improvement or accountability.Citation26–27 It is possible that our findings, particularly the insignificant impact of care plans provided to patients with COPD (eg, the observed increase in ED visits and hospitalizations) was also affected by the challenging landscape of primary care and a lack of consensus on specific outcomes that represent high-quality primary care.Citation28 For example, Alberta’s primary care networks introduced measures of primary care networks performance that target primary health care system outcomes, but these do not reflect health utilization outcomes.Citation28 The autonomy of primary care physicians as independent contractors, who operate mainly fee-for-service payment model, makes it difficult to identify health system performance measures that would be attributable to primary care. Pay-for-performance models might address this challenge. As an example, the U.K. national primary care pay-for-performance scheme demonstrated a decrease of 2.7–8.0% in hospital admissions for ambulatory care sensitive conditions (including COPD) compared to non-incentivized ambulatory care sensitive conditions.Citation29 This raises a question of what outcomes should be considered in determining the effectiveness of COPD management in primary care in a predominantly fee-for-service model. Future research should address this question and consider the importance of integrated care in COPD, which puts emphasis on care coordination including transition of care, continuity of care and self-management.Citation2,Citation5,Citation30 Integrated disease management for COPD in primary care showed improvement in quality of life and a decrease in exacerbation-related outcomes.Citation5,Citation23 Furthermore, improved access to after-hours primary care can reduce some less-urgent ED visits.Citation31 This might be another reason for clinically insignificant changes in hospitalizations and ED visits as rural residents use hospitals more frequently in the absence of or limited access to primary care and/or specialists. Although this care plan program was terminated in 2020, the present evaluation raises important questions about the current remuneration model and primary care accountability, and our results can better inform future steps of primary care reorganization and chronic disease management. Specifically, for the RM community it is important to propose the quality indicators (QIs) that are specific to COPD and can be targeted at the primary care level. With this, the work by Gershon et al. on developing a set of QIs for COPD management in primary care and then measuring these QIs using Ontario EMR provides important baseline measures, as well as highlights what aims can be set with the proposed QIs to evaluate GPs provided care in COPD management.Citation32–33
This study should be interpreted with consideration for several limitations. First, as previously noted, we were not able to consider the quality of provided care plans or the quality and quantity of physician follow-up appointments. Second, our study does not account for the severity of disease and/or history of COPD hospitalizations/ED visits within the patient population and the impact of this on healthcare service utilization. It is possible that the low rate of hospitalizations is a result of care plans being targeted to patients with milder disease. Third, we assessed the impact of care plans only for the following year, which might not be enough time to see any differences in high-level health utilization outcomes, such as hospitalizations or ED visits. Fourth, factors that could influence the decision of a physician to offer a CACP, of a patient to accept or reject the offer, were not taken into consideration since these data were not available; however, these factors might explain the observed lack of impact. Additionally, patients’ awareness and intentions of the care plans and their motivation and role in changing behavior are not known. Similarly, we could not assess whether physicians’ characteristics, such as years in practice, urban or rural location, affiliation with the primary care network, as well as overall extend and quality of care affected the results. This is something that should be further explored in the future with primary data.
Conclusion
Healthcare for patients with COPD continues to be a significant cost for health systems, particularly related to hospitalizations and ED visits. Effectively organized primary care can be instrumental in decreasing exacerbations. In Alberta, annual care plans provided by physicians did not demonstrate a decrease in COPD-related hospitalizations and COPD-related ED visits in the following year. CACP provision also increased the number of specialist appointments during the following 12 months. As policymakers continue to identify opportunities to improve primary care and its accountability, further evaluation strategies need to be considered.
Author contributions
T. Makhinova had full access to all of the data in the study and takes responsibility for the integrity of the data and the accuracy of the data analysis and was responsible for the drafting of the manuscript and study supervision. T. Makhinova, D.T. Eurich, J.K. Minhas-Sandhu, J.A. Johnson, C. Necyk and M. Bhutani were responsible for the study concept and design. D.T. Eurich, J.K. Minhas-Sandhu and J.A. Johnson were responsible for the acquisition of data. All authors were responsible for the analysis and interpretation of data, as well as the critical revision of the manuscript. T. Makhinova, D.T. Eurich, J.A. Johnson, C. Necyk and M. Bhutani were responsible for obtaining the funding for the study.
Author note
Part of the results were accepted and presented at the 2021 Annual Canadian Association for Health Services and Policy Research (CAHSPR) Conference (May 19–21, 2021; Virtual).
Supplemental Material
Download MS Word (564.8 KB)Acknowledgments
This study is based on data provided by Alberta Health. The interpretation and conclusions of the results are those of the researchers and do not necessarily represent the views of the government of Alberta nor the funder (M.S.I. Foundation).
Disclosure statement
M. Bhutani has consulted for Astra Zeneca, GlaxoSmithKline, Boehringer Ingelheim, Valeo, Covis and Sanofi. The authors declare no other relevant conflicts of interest or financial relationships.
Data availability statement
The dataset from this study is held securely in coded form at the School of Public Health, University of Alberta. Access may be granted to those who meet pre-specified criteria for confidential access.
Additional information
Funding
References
- Vachon B, Giasson G, Gaboury I, et al. Challenges and strategies for improving COPD primary care services in Quebec: results of the experience of the COMPAS + quality improvement collaborative. Int J Chron Obstruct Pulmon Dis. 2022;17(17):259–272. doi:10.2147/COPD.S341905.
- Ferrone M, Masciantonio MG, Malus N, et al. The impact of integrated disease management in high-risk COPD patients in primary care. NPJ Prim Care Respir Med. 2019;29(1):8. doi:10.1038/s41533-019-0119-9.
- Poot CC, Meijer E, Kruis AL, et al. Integrated disease management interventions for patients with chronic obstructive pulmonary disease. Cochrane Database Syst Rev. 2021;8(9):CD009437.
- Global Initiative for Chronic Obstructive Lung Disease (GOLD). Global Strategy for Prevention, Diagnosis and Management of COPD: 2023 Report. https://goldcopd.org/2023-gold-report-2/. Accessed May 14, 2023.
- Hussey AJ, Wing K, Ferrone M, Licskai CJ. Integrated disease management for chronic obstructive pulmonary disease in primary care, from the controlled trial to clinical program: a cohort study. Int J Chron Obstruct Pulmon Dis. 2021;16(16):3449–3464. doi:10.2147/COPD.S338851.
- Lisspers K, Johansson G, Jansson C, et al. Improvement in COPD management by access to asthma/COPD clinics in primary care: data from the observational PATHOS study. Respir Med. 2014;108(9):1345–1354. doi:10.1016/j.rmed.2014.06.002.
- Houle SK, McAlister FA, Jackevicius CA, Chuck AW, Tsuyuki RT. Does performance-based remuneration for individual health care practitioners affect patient care?: a systematic review. Ann Intern Med. 2012;157(12):889–899. doi:10.7326/0003-4819-157-12-201212180-00009.
- Hollander MJ, Kadlec MA. Incentive-based primary care: cost and utilization analysis. Perm J. 2015;19(4):46–56. doi:10.7812/TPP/15-045.
- Lavergne MR, Law MR, Peterson S, et al. Effect of incentive payments on chronic disease management and health services use in British Columbia, Canada: interrupted time series analysis. Health Policy. 2018;122(2):157–164. doi:10.1016/j.healthpol.2017.11.001.
- Alberta Health and Wellness. Alberta Health Care Insurance Plan Bulletin Med 141. April 6, 2009. https://open.alberta.ca/dataset/2e891144-da13-43f6-8b81-f0d021a46614/resource/ab085bce-e1ca-4802-a5a0-0ed5fef0fbbc/download/ahcip-bulletin-medspecialedition-compcareplan-2009.pdf. Accessed March 14, 2023.
- Saher MN. Report of the Auditor General of Alberta: Health–chronic disease management. 2014. https://www.oag.ab.a/wp-content/uploads/2020/05/2014_-_Report_of_the_Auditor_General_of_Alberta_-_September_2014_srwoIwD.pdf. Accessed March 14, 2023.
- Necyk CM. 2020. A Population-Wide Evaluation of Comprehensive Annual Care Plans by Physicians and Pharmacists in Alberta [Doctoral thesis]. University of Alberta. https://era.library.ualberta.ca/items/dd878966-f6b9-4db7-b549-ace10d890799. Accessed December 14, 2022.
- Bernal JL, Soumerai S, Gasparrini A. A methodological framework for model selection in interrupted time series studies. J Clin Epidemiol. 2018;103:82–91. doi:10.1016/j.jclinepi.2018.05.026.
- St CT, Helberg K, Cook TD. The validity and precision of the comparative interrupted time-series design: three within-study comparisons. JEBS. 2016;41(3):269–299.
- Chu YT, Ng YY, Wu SC. Comparison of different comorbidity measures for use with administrative data in predicting short- and long-term mortality. BMC Health Serv Res. 2010;10(1):140. doi:10.1186/1472-6963-10-140.
- Bernal JL, Cummins S, Gasparrini A. Interrupted time series regression for the evaluation of public health interventions: a tutorial. Int J Epidemiol. 2017;46(1):348–355.
- Lavergne MR, Law MR, Peterson S, et al. A population-based analysis of incentive payments to primary care physicians for the care of patients with complex disease. CMAJ. 2016;188(15):E375–E383. doi:10.1503/cmaj.150858.
- Wagner AK, Soumerai SB, Zhang F, Ross-Degnan D. Segmented regression analysis of interrupted time series studies in medication use research. J Clin Pharm Ther. 2002;27(4):299–309. doi:10.1046/j.1365-2710.2002.00430.x.
- Zhang F, Wagner AK, Soumerai SB, Ross-Degnan D. Methods for estimating confidence intervals in interrupted time series analyses of health interventions. J Clin Epidemiol. 2009;62(2):143–148. doi:10.1016/j.jclinepi.2008.08.007.
- Scott A, Sivey P, Ait Ouakrim D, et al. The effect of financial incentives on the quality of health care provided by primary care physicians. Cochrane Database Syst Rev. 2011;9:CD008451.
- Clarke L, Anderson M, Anderson R, et al. Economic aspects of delivering primary care services: an evidence synthesis to inform policy and research priorities. Milbank Q. 2021;99(4):974–1023. doi:10.1111/1468-0009.12536.
- Cho EE, Mecredy GC, Wong HH, Stanbrook MB, Gershon AS. Which physicians are taking care of people with COPD? Chest. 2019;155(4):771–777. doi:10.1016/j.chest.2018.12.018.
- Tranmer J, Rotter T, O'Donnell D, et al. Determining the influence of the primary and specialist network of care on patient and system outcomes among patients with a new diagnosis of chronic obstructive pulmonary disease (COPD). BMC Health Serv Res. 2022;2922(1):1210. doi:10.1186/s12913-022-08588-w.
- Appleton AJ, Lam M, Allen BN, et al. Potential barriers to physician follow-up within 7 days of discharge from a chronic obstructive pulmonary disease hospital admission. Can. J. Respir. Crit. 2020;5(5):283–292.
- Howcroft M, Walters EH, Wood-Baker R, Walters JA. Action plans with brief patient education for exacerbations in chronic obstructive pulmonary disease. Cochrane Database Syst Rev. 2016;12(12):CD005074. doi:10.1002/14651858.CD005074.pub4.
- Marchildon GP, Hutchison B. Primary care in Ontario, Canada: new proposals after 15 years of reform. Health Policy. 2016;120(7):732–738. doi:10.1016/j.healthpol.2016.04.010.
- McKay M, Lavergne MR, Lea AP, et al. Government policies targeting primary care physician practice from 1998-2018 in three Canadian provinces: a jurisdictional scan. Health Policy. 2022;126(6):565–575. doi:10.1016/j.healthpol.2022.03.006.
- Leslie M, Khayatzadeh-Mahani A, Birdsell J, et al. An implementation history of primary health care transformation: Alberta’s primary care networks and the people, time and culture of change. BMC Fam Pract. 2020;521(1):258. doi:10.1186/s12875-020-01330-7.
- Harrison MJ, Dusheiko M, Sutton M, et al. Effect of a national primary care pay for performance scheme on emergency hospital admissions for ambulatory care sensitive conditions: controlled longitudinal study. BMJ. 2014;349(349):g6423. doi:10.1136/bmj.g6423.
- Nici L, ZuWallack R. Integrated care in chronic obstructive pulmonary disease and rehabilitation. COPD. 2018;15(3):223–230. doi:10.1080/15412555.2018.1501671.
- Hong M, Thind A, Zaric GS, Sarma S. Emergency department use following incentives to provide after-hours primary care: a retrospective cohort study. CMAJ. 2021;193(3):E85–E93. doi:10.1503/cmaj.200277.
- Gershon AS, Mecredy GC, Aaron SD, et al. Development of quality indicators for chronic obstructive pulmonary disease (COPD): a modified RAND appropriateness method. Can. J. Respir. Crit. Care, Sleep Med. 2019;3(1):30–38. doi:10.1080/24745332.2018.1476030.
- Lee TM, Tu K, Ivers NM, Barnsley J, Gershon AS. Measuring chronic obstructive pulmonary disease (COPD) quality indicators using primary care electronic medical records (EMRs) in Ontario, Canada. Can. J. Respir. Crit. Care, Sleep Med. 2022;6(3):169–183. doi:10.1080/24745332.2021.1913079.