
ABSTRACT
Controller Area Network (CAN-bus) is a default solution for digital control in machinery. The CAN-bus structure uses connector components to extend cabling and join subsystems. The connectors are IP-classified, so they tolerate humidity and particle ingress. Ingress protection also provides durability against other stress factors. Usually, connectors are exposed to multiple stress factors, but the stress levels are durable. In mining applications, however, stress levels can be high, and other factors become significant, so IP classification does not necessarily indicate sufficient durability. Tailored testing can be used to identify suitable components for a specific purpose. In this study, the actual stress factors of an underground mine drill were used in tailored tests. The results showed significant differences in reliability between connector models with the same IP code. The ranking of the components varied depending on the stress factors used. This highlights the importance of using actual operating conditions when evaluating reliability.
Introduction
Automation is becoming increasingly important in modern vehicles and machinery. Autonomous vehicles and machinery have proceeded from the concept level to field tests and limited use. As more functions are automated, the reliability of individual components becomes even more important.
Digital control is often realized with CAN-bus, a multiplexing system where subsystems communicate with each other through the same wiring (Lokman et al. Citation2019). The physical layer of the network does not have redundancy or complex interconnecting wiring, so it is simple and cost-effective. However, this requires the components in the signal transfer chain to be highly reliable. If a component in the signal transfer chain fails, subsystems behind the failed component are cut-off from the network and functionalities are lost. The benefits of automation are reduced if equipment down-time is increased greatly due to maintenance and repairs. In the global market, a reputation as a provider of high-quality machinery is an important asset that should not be endangered by the need for excessive maintenance.
The reliability of components is tested from the design phase to the burn-in or test phase before product delivery to the customer. Such testing is a well-developed, proven branch of engineering that includes standards and methods for many applications and conditions. A very common classification of electronic components used in vehicles and machinery is IP-coding. The IP standard (SFS Citation2000) defines the limits for ingress protection against humidity and foreign objects, and it gives components easily interpretable codes.
Humidity and dirt are the fundamental stress factors in the operating conditions of heavy machinery, so a sufficient IP code is a minimum requirement for the components used. The IP code is also used as a generic indicator of ‘robustness’. In most applications, this is a valid generalization. However, the standard covers only specific, well-defined, and limited conditions. In the case of heavy machinery, other stress factors can also become significant.
In practice, the reliability of CAN-bus connectors in challenging conditions is not at the level expected according to the IP code. One way to address this problem is to use testing that considers other major stress factors present in the operating conditions. Tailored tests give a more accurate estimation of reliability in the specific application and operation conditions.
In this study, tailored testing was applied to CAN-bus connectors in an underground mining drill. Tailored tests are designed to simulate the actual stress environment of the underground drill’s operation. The ingress of humidity and dirt are apparent stress factors, but the effects of vibration, bending, stretching, and the ‘human factor’ were also included.
Designers can use the applied approach and developed tests as tools to select suitable components from the large catalogue of components with the same IP code and functional specifications. Information on the weaknesses and strengths of each candidate component can be utilized in the design process to achieve the better overall reliability and uptime of the machinery.
Tailored and accelerated testing
In test tailoring, the specifications of the tests are based on actual stress factors and levels in field operation rather than on the fixed conditions of generic, standardized tests. Typically, the tailoring process includes an analysis of the product lifecycle, the collection of stress data in different operating conditions, and the design of a test programme (Lalanne Citation2014). This approach gives more detailed information about the reliability of critical components in specific conditions. Typical tailored stress factors include vibration under operation (Hietala et al. Citation2017) and environmental loads (MIL-STD-810G Citation2008).
A fundamental principle of accelerated testing is the compaction of the cumulative load of the product’s lifespan into a shorter time (Nelson Citation1990). This is realized by exposing the device under test (DUT) to an increased use rate or stress level in testing when compared to normal operative use. The accelerated testing concept is applicable to two types of tests (Escobar and Meeker Citation2006), namely qualitative testing and quantitative testing. In general, qualitative testing is used to reveal a hidden weakness in a product, while quantitative testing is used in the estimation of the lifetime distribution or degradation process under certain stress factors. The terminology varies, but qualitative tests are usually referred to as environmental stress screening (ESS) and quantitative tests as accelerated life tests (ALTs).
Qualitative tests include many methods with a specific purpose. Tests known as the ‘shake-and-bake test’, ‘elephant test’, and highly accelerated life testing (HALT) use a single extreme level of stress to reveal latent defects, weaknesses, and probable failure modes (Misra Citation2008). This information can be used in the re-design of a product before initiating production. Highly accelerated stress screening (HASS) (Silverman Citation1998) that applies progressively increasing stress levels, environmental stress screening (ESS), and burn-in are used to test products before delivery to remove defective products that would fail quickly in field use (Dodson and Schwab Citation2006). These tests are also applied in defining the boundaries of operating conditions.
ALTs are used to acquire lifetime data at a specific stress level. This information can be used in defining the warranty period of products or scheduling equipment maintenance. A common practice in ALT is to use multiple stress levels and determine the relation between the stress level and lifetime distribution. This makes it possible to estimate the product’s lifespan under certain stress levels and design inspections and maintenance more efficiently.
In many applications, the operating conditions contain many simultaneous stress factors. These factors may be independent, but some stress factors affect each other and must be analysed in multivariate testing. For example, fretting corrosion (Martin Citation2006) happens on the contact surfaces of metal assemblies that are not designed to move against each other but small oscillations occur due to vibration. While the assembly parts remain immobile, a protective treatment or an inert oxide layer on the metal protects the surface from further corrosive damage. If this layer is removed by the abrasive movement of assembly parts, an unprotected metal surface is revealed. Thus, vibration itself does not corrode metal, but it makes metal prone to corrosion. Conversely, metal surfaces tolerate vibrating abrasive stress to some extent, but corrosion reduces the strength of the metal, making it more prone to abrasion.
In the multivariate testing, the variables were divided into two classes: accelerating and non-accelerating variables. Accelerating variables are quantities whose level is elevated above the normal operating level to hasten the degradation process. Non-accelerating variables, or engineering variables (Escobar and Meeker Citation2006), are stress factors that affect degradation, but their magnitude is the same as in normal operating conditions. Furthermore, a non-accelerating variable can be a factor that does not directly affect the product’s lifespan but works as a catalyst, making an initially inert object susceptible to stress factors. Accelerated testing has been used and developed since the 1930s (Strieter and Snoke Citation1936), and today it is a well-established branch of reliability engineering. Sources such as the standard MIL-STD-810G (Citation2008); the textbooks by Meeker and Escobar (Citation1998), Nelson (Citation1990), Crowe and Feinberg (Citation2001), and Lalanne (Citation2014); and the publication by Escobar and Meeker (Citation2006) give a solid background for the planning of an accelerated reliability study and instructions on how to design case-specific tailored tests.
Test material and failure criteria
In this study, the CAN-bus connectors of an underground mine drill were used as a case study, but a similar approach would be applicable to other heavy machinery as well. The starting point of the test development was IP classification. The IP standard defines the protection level against the ingress of liquids and particles. The IP67 rating is very common for outdoor applications because it is the first rank of rating that is tested with water immersion, not sprayed water – in other words, it is rated as waterproof rather than as merely water resistant. IP67 requires protection against talcum powder exposure for eight hours and water immersion for 30 min in conditions specified under standard EN 60529:1991 (SFS Citation2000). In this study, these ingress stress factors are supplemented with other stress factors present in the operation of an underground mine drill, and the tailored tests were planned accordingly.
Information about other stress factors in underground mine conditions was collected by interviews, first-hand observations, and measurements in both the field and the laboratory. The field study took place in the test mine of Sandvik Mining and Construction Oy© in Tampere, Finland.
During operation, the mine drill uses water to flush crushed stone out of the drilled hole. The use of water prevents dust exposure but the water exposure is continuous, thus increasing the importance of waterproofness. Crushed rock can make water chemically aggressive, meaning that it corrodes electric contacts and wiring if it seeps through into the connector. Due to the absence of dust exposure, water exposure was used as a representative stress factor for ingress protection and the failure of waterproofness as a failure criterion.
The other major stress factors identified were vibration, stretching, and bending. The operation of a typical mine drill is based on the hammering of rock with a hard, durable bit at the end of a drill rod. Vibration at the percussion frequency is transmitted through the frame of the drill machine. Vibration affects the connectors directly and through the moving cables. The inertia of the moving cables and connector present dynamic stretching and bending stresses to the cable contacts and connector structure. The boom and the drill feeder with the drill itself are designed to be very mobile to enable drilling in all directions. The movement of the boom and the drill feeder also contributes to the stretching and bending stress.
In addition, confined space introduces another potential risk to reliability. Connectors are often mounted in a confined space within or under the structure. The confined space and design of connectors might demand non-optimal mounting that causes a static bending stress to the component. In manufacturing, trained personnel know the importance of procedures and following instructions, but this is not necessarily the case in field maintenance and repairs. If special tools are needed or mounting in a confined space is considered difficult, there is the possibility for the violation of the instructions and assembly error due to poor craftsmanship. Therefore, the ‘human factor’ is considered as a stress factor.
Tested components
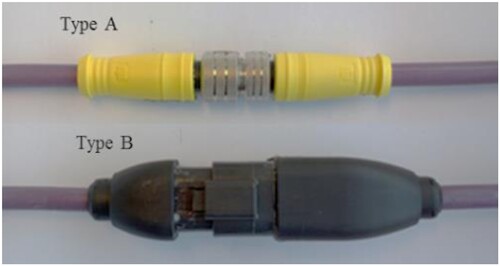
Two types of connector components (henceforth, type A and type B) with different structures were studied. Both are commonly used in CAN-bus solutions for machinery. The connectors have the same generic design: there is a waterproof housing with two overlapping parts that protect the contacts and cable openings at both ends. Type A has a threaded structure that is closed with a specific torque wrench. The waterproofness is provided by an O-ring that seals the structure when the parts are tightened together. Type B has an extension cord structure with a locking clip on the outer surface of the housing to attach the parts together. Waterproofing is provided by silicon flanges between the overlapping housing parts. The connectors are shown in .
Figure 1. Two CAN-bus connectors with different designs: type A (top) and type B (bottom) (Ojala et al. Citation2017a). (Images are available in colour online)
In the static salt fog test (Section 4.2.), one sample set of six type-B connectors was of an obsolete version of type B, which was no longer used at the time of testing. This set is considered as a third connector model, marked as type Bo.
Resistance as an indicator of degradation and failure criteria
The function of a connector is to transfer a digital control signal without quality degradation. This requires the resistance of the signal transfer chain to remain constant over time. If the resistance changes, the interpretation of the signal becomes uncertain. There are two main mechanisms that affect the resistive properties of the connector: (1) failure of waterproofness and (2) fatigue damage to the signal wires and contacts. Failure of waterproofness has two effects. In the short term, it short-circuits the signal wires, disturbing the signal, and in the long term, the chemically aggressive flush water corrodes the contacts, increasing their resistance and simultaneously reducing their strength, making them more prone to fatigue damage. Fatigue damage directly affects the physical structure of the signal transfer chain. Vibration and other movement cannot be totally eliminated from the connector structure, and over time the wire breaks or detaches from the solder contact.
Both failure mechanisms were monitored by representative resistance quantity measurements. Integrity was monitored with short circuit resistance (SC) between the signal wires. When the waterproofing fails, humidity forms a conductive path between the contact pins, and the resistance drops by a measurable level. Fatigue damage was monitored by the connector’s pass-through resistance (PT). A rise in the PT value indicates the degradation of the signal transfer capability.
The threshold for component failure for the SC mode was based on the measurement equipment. When the inside of a connector is dry, the short circuit resistance (SC) is very high and out of the range of an ordinary multimeter. When conductive liquid seeps into the connector, it short-circuits pin-socket pairs and the resistance drops into the dynamic range of the multimeter (<120 MΩ) used in this study, and failure is recorded. The test solution used in tests was deionized water with 5% by weight NaCl. NaCl increases the conductivity of the solution and makes detection of the waterproofing failure consistent.
For the PT mode, the failure threshold was based on the application-specific test result. In the testing of the mine drill machinery control, an increase of 10 Ω in the resistance of the whole CAN-bus caused errors in the interpretation of the control signal. This was set as the failure threshold for the PT mode.
Test tailoring
Based on the presented stress factors, four tests were designed. Specialists of the mining industry and drill equipment were consulted to confirm the authenticity of the stress factors and levels used. Continuous humidity exposure was used as a common factor in all tests, since waterproofness is an essential criterion for components used in drill machinery and it is a representative factor for ingress protection. Each test was planned to study how a combination of humidity and another stress factor would affect the reliability of an IP67-coded connector. The tests simulated the worst-case scenario in normal operative use. The underground drill with 3-axial accelerometers attached to the base of the drill feeder and the boom are shown in .
Figure 2. Underground rock drill (Sandvik) and 3-axial accelerometers (Ojala et al. Citation2017a). (Images are available in colour online)
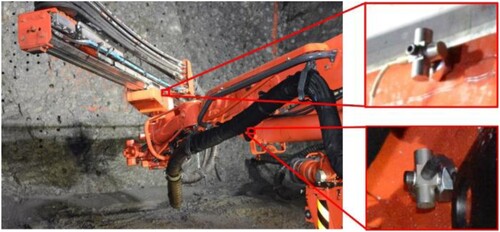
The highest stress levels are close to the drill in the boom, where the stress factors are also present simultaneously. Due to the flush water, humidity exposure is continuous during operation and the acceleration levels of the vibration caused by the drill percussion are high. Additionally, the movement of the drill feeder and boom cause bending and stretching stress in the connectors. The developed tests and simulated stress scenarios are presented in .
Table 1. Test set-ups.
The RS and SF tests were carried out at multiple stress levels to study the degradation process more closely and reveal the model of the lifetime. DS and DB were carried out at only one stress level, but two failure modes were monitored simultaneously.
For type A, the effect of deficient assembly was included in all tests. In the assembly of type A, a special torque wrench tool should be used to achieve the recommended tightness. In the field, this special tool might be unavailable or considered unnecessary, and the assembly might therefore be done manually. In such a case, the required tightness might not be achieved. In addition, the threaded structure is susceptible to the ingress of foreign material. Extra material – such as a grain of sand or metal flakes from machining – in the screw groove increase friction and the applied torque might not be enough to achieve sufficient tightness for waterproofness, even when the instructions are followed. This is not likely in the clean, controlled conditions of a factory assembly line, but it is a plausible source of reliability risk in field maintenance. This scenario was simulated by applying the required torque to tighten type A connectors before loosening by half a turn.
Resonance shaker test (RS)
The RS test (Ojala et al. Citation2017a) studied the effect of vibration on the ingress protection of the connectors. The accelerating factors were continuous water exposure, the acceleration level of vibration (used unit g = 9.81 m/s2), and the use of a resonance frequency that maximizes the amplitude of movement.
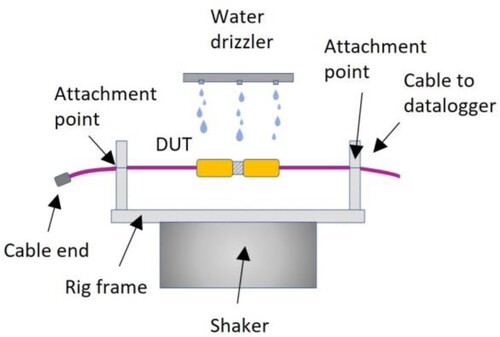
The equipment comprised a shaker, a sample rig, a water drizzler, and a datalogger. The water drizzler system kept the DUT continuously exposed to water. Vibration distributed water all over the connector and cables. The receptacle side cable was capped off and resistance between the signal wire pins on the plug side was monitored with a multiplexing datalogger. The level of vibration was controlled by the shaker settings. A schematic drawing of the RS test set-up is presented in .
Figure 3. Schematic drawing of the resonance shaker test. (Images are available in colour online)
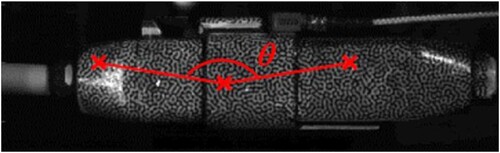
The mechanical response of the connector structure to the resonance frequency vibration was observed by high-speed imaging. Deflection of the DUT was measured with a digital image correlation (DIC) (Sutton et al. Citation2009) method that mapped three locations in a set of consecutive images. Deflection was used as a generic indicator of robustness. The observed geometry at the followed locations (red crosses) used in deflection measurements is presented in .
Figure 4. Observed geometry of type B in the resonance shaker test. (Images are available in colour online)
Salt fog test (SF)
The effect of static bending and long-term humidity exposure was studied with the SF test (Ojala et al. Citation2017b). The test set-up comprised a salt fog (salt spray) chamber and a sample rig. The salt fog test chamber was run according to the standard SFS-EN ISO 9227 (SFS Citation2012). Samples were attached in the sample rig under static bending to simulate mounting in the confined space available in mining machinery. The sample rig with type B samples is presented in .
Figure 5. Test samples in the test rig used in the multivariate static test. (Images are available in colour online)
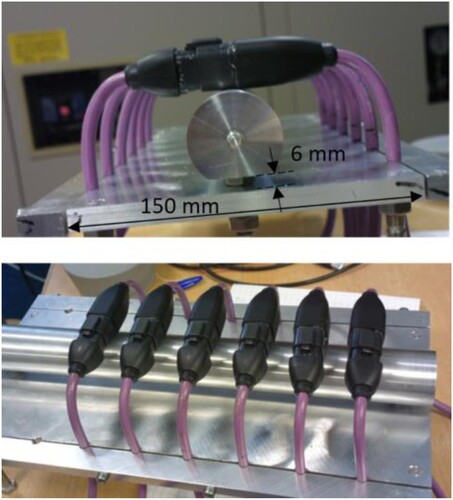
The sample rig comprised two parts, a frame and a bar. The samples were attached to the frame and the bar projected static bending stress to the connector samples. In the initial position shown in , the elevation between the bottom of the bar and rig frame was 6 mm; the bar merely touches the samples and bending stress comes only from the installation of the samples in the curved position. Elevation of the bar causes additional static bending and stretching stress, which is expressed as elevation from the initial position in millimetres.
Dynamic stretching test (DS)
The mounting of the cabling is designed according to the range of boom movement, but part of the movement can be transferred to the cable and the connector, causing stretching stress. Furthermore, if the mounting of cable bundles enables horizontal swinging, the inertia of the cabling causes an axial force component to the connector cable joining point. This scenario is simulated with the DS test set-up presented in .
Figure 6. Schematic drawing of the test set-up combining vertical stretching and humidity exposure. (Images are available in colour online)
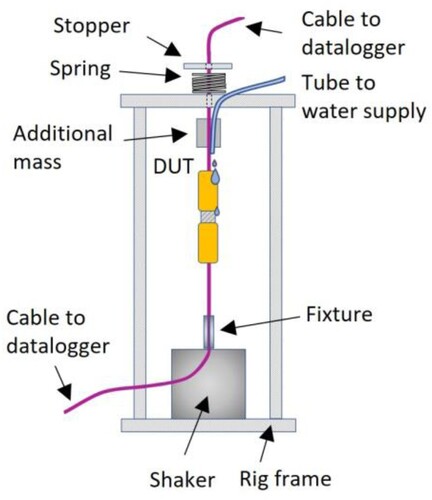
The shaker moves the DUT vertically and the stopper limits movement in the downward direction, resulting in stretching stress in each cycle. An additive mass was attached to the cable to simulate the inertia of a longer and heavier cable assembly. Between the stopper and the upper surface of the rig is a spring to lower the gradient of the stretching force. The humidity exposure was kept continuous by a water drizzler attached to the cable above the DUT.
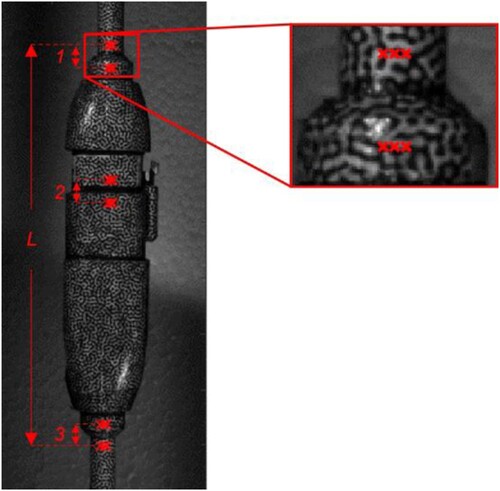
Mechanical response to the dynamic stretching was studied with high-speed imaging and DIC. Stretching of the DUT was monitored with four measures: the dimension over the connector (L), between the top cable and casing (1), between the casing parts (2), and between the bottom cable and housing part (3). The locations (red crosses) that are used in the DIC method and the monitored dimensions are presented in .
Figure 7. Schematic drawing of the test set-up combining vertical stretching and humidity exposure. (Images are available in colour online)
Dynamic bending stress test (DB)
The movement of the booms and the drill feeder is a potential mechanism for bending stress on the connectors. Tolerance to dynamic bending was studied with a test set-up where a sample is fixed to a rig and a shaker rod forces the DUT upwards in the middle. A schematic drawing is presented in .
Figure 8. Schematic drawing of the test set-up combining horizontal bending and humidity exposure. (Images are available in colour online)
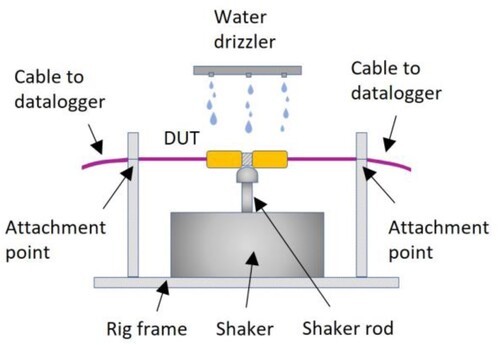
The sample was mounted on the rig so that it remained in contact with the shaker rod and under tension during work cycles.
Fault types and analysis methods
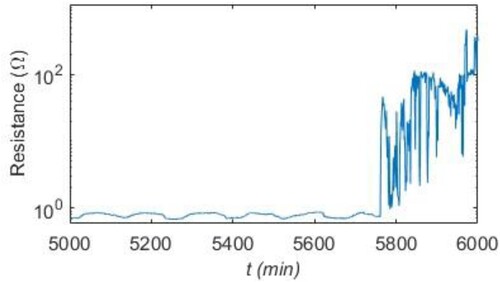
Depending on the details of the test set-up and monitored failure mechanism, the resistance data had different generic types. In the dynamic tests RS, DS, and DB, the degradation process was very clear and uncomplicated. The change in the monitored resistance quantities was drastic and permanent in both failure modes. In the data analysis of these tests, the first-hitting-time principle was used. When the observed quantity reaches a predefined level, the DUT is interpreted to have failed. Measurement data of a typical fault for the SC failure mode of the RS test is presented in , and the PT failure mode for the DS test is shown in . In all resistance data graphs, values beyond the range of the multimeters are set to 109 Ω for presentational clarity.
Figure 9. Measurement data of a typical fault of the SC failure mode in the RS test. (Images are available in colour online)
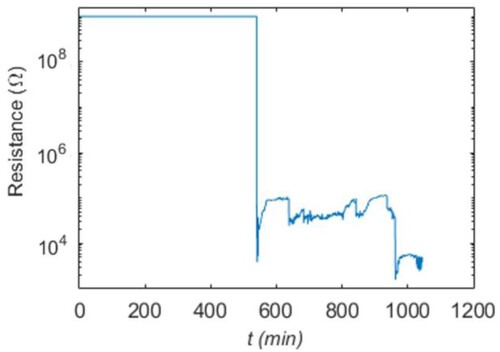
Figure 10. Measurement data of a typical fault of the PT failure mode in the DS test. (Images are available in colour online)
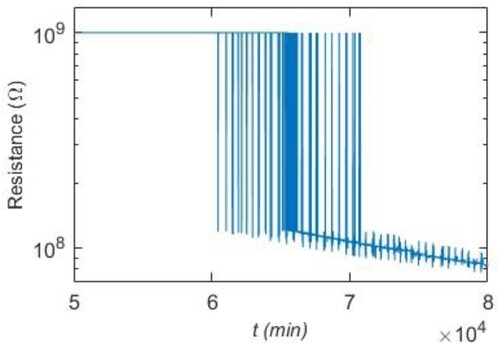
The SF test was static, and the observed degradation process was very different. After the first hit at the predefined threshold, the resistance reading returned to a level indicating an intact condition. As testing continued, the threshold crossings became increasingly frequent until the resistance remained permanently at the SC level indicating failure.
Even the first hit of the predefined threshold could be used as an indicator of fault, but it could lead to inefficient maintenance. The time from the first indication of a fault to a confirmed failure could be long, so a more robust analysis method was used. This intermittent degradation process was analysed with a method that uses the properties of the transition matrix of the Markov process to confirm failure (Ojala et al. Citation2017b). When it is more probable that the next resistance value will hit the threshold than remain above it, the DUT is interpreted to have failed. An example of the oscillating data of the SF test is presented in .
Figure 11. Observation of an intermittent fault in the salt fog (SF) test. (Images are available in colour online)
Results and discussion
Resistance measurements
Failure time data for the tests that were carried out at many stress levels are presented in and as graphs, and data for the tests that were run at only one stress level but observed two failure modes simultaneously are presented in and . The data are type-I censored (Meeker and Escobar Citation1998), where the data are either failure time or run-out time (where the sample has not failed in the duration of the test). In the tables, run-out times are marked with (ro) behind a numeric value. In and , each sample has two failure times, one for both of the SC and PT failure modes.
Figure 12. Failure time data of the SC failure mode in the resonance shaker (RS) test. Accelerating variable: Acceleration level of vibration. Failure times marked with a cross (×) and run-out data with a circle (○). (Images are available in colour online)
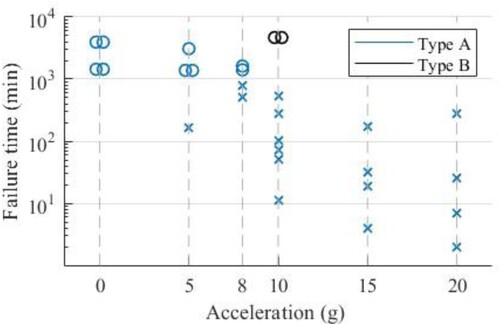
Figure 13. Failure time data of the SC failure mode in the SF test. Accelerating variable: Elevation from the initial position in millimetres. Failure times marked with a cross (×) and run-out data with a circle (○). (Images are available in colour online)
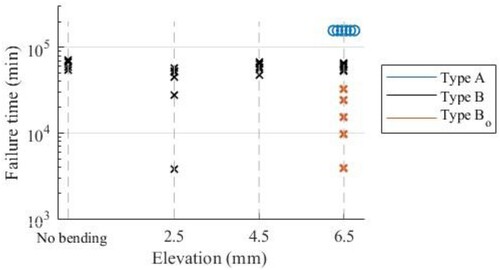
Table 2. Failure time (min) data of the SC and PT failure modes in the dynamic stretching test.
Table 3. Failure time (min) or run-out (ro) time data of the SC and PT failure modes in the dynamic bending test.
In the RS and SF tests, both connector types were tested first with the same stress level. After testing at the initial stress level, the failed connector type was studied more closely by using multiple stress levels to reveal the stress-lifetime relationship. Reference tests were made with no additional stress factors, with humidity exposure as the only stress factor present. In the RS test, the reference was a static condition without vibration (0 g), and in the SF test, the sample was tested without a rig and no bending stress was applied (no bending).
DS and DB studied two failure modes, failure of the waterproofness and the degradation of signal transfer capability. In and , each sample has two failure times, one each for the SC and PT failure modes.
Resonance shaker test
The resonance shaker test (RS) studied the effect of vibration on ingress protection. The results are very clear. Type B with a secured lock mechanism passed the test without failures. Type A with the threaded structure that relied on assembly with a special tool was vulnerable to vibration. The failure time follows the inverse power law-lognormal (IPL-lognormal) model where the lifetime decreases as the acceleration level of vibration increases (Ojala et al. Citation2017a).
Salt fog test
The effect of long-term humidity exposure and static bending was studied with the SF test. In static conditions, type A passed the test without failure. Under long-term humidity exposure, the integrity of type B failed. Static bending was used as an accelerating stress variable, and it reduced the lifespan a little. There was no clear relation between the level of bending stress and lifespan.
One set of the previous design of type B was also tested (marked as type Bo). The results showed a significant improvement in the current design compared to the previous one. This indicates the resolution capability of the salt fog test.
Dynamic stretching
The effect of dynamic stretching on the SC and PT failure modes was tested with the DS test. All samples were tested until failure in both failure modes.
Axial mechanical stress highlighted a significant durability difference between the components’ designs. The time to failure of the PT failure mode for type B was greater by two decades compared to type A. The SC mode did not show as drastic a difference in reliability, but type B maintained integrity much longer compared to type A.
Dynamic bending
The effect of dynamic bending on the SC and PT failure modes was examined with the DB test. The results are similar to the DS test results. PT mode defined the reliability, and type B performed better in both failure modes.
High-speed camera measurements
In the resonance vibration (RS) and dynamic stretching (DS) tests, the response to dynamic loading was measured with high-speed camera imaging. In the RS test, the angle (Δθ) of the connector’s bending under vibration at the resonance frequency was determined. The deflection of the type A connector was almost four times greater compared to that of type B. The maximum deflections are presented in .
Table 4. Deflection under resonance vibration.
Response to dynamic axial stress was measured in the DS test. Elongation for each location (1, 2, 3) and the total length (L) for both connector types are presented in .
Table 5. Component elongation (10−3%) in four locations of the connector in the dynamic stretching test.
Elongation was the greatest between the cable and the housing on the top (location 1). There was also movement between the plug and socket parts (location 2), but this does not inevitably cause failure. These parts are designed to provide galvanic contact, but also to be detachable, so the mechanism is yielding and more tolerant to cyclic stretching stress.
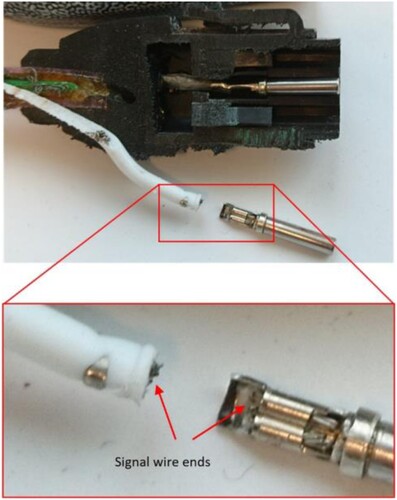
Strain values yield information about the robustness of the cable attachment. If the cable moves in relation to the housing, it is very likely that the movement is transferred further into the structure. This movement causes metal fatigue in the signal wire-pin attachment and leads to component failure, as presented in (Type B, sawed open).
Figure 14. Severed signal wire inside the type B connector. (Images are available in colour online)
The strain values are almost the same for the two types, but between the housing and cable (in location 3), the elongation in type A was twice that found in type B. This correlates with the PT mode failure times in the DS and DB tests. Additionally, the deflection measurement is in line with PT failure times. The unyielding structure of type B tolerates dynamic stretching and bending stress better than the more yielding type A.
Confirmation of failure mechanisms
The mechanisms of failure were confirmed after testing. The seep-through of saltwater into the connector structure was studied with scanning electron microscopy (SEM) JEOL IT500©. An element analysis function of SEM showed that traces of sodium and chloride could be found inside the type B sample that had been in the SF test until failure, but the same elements could not be found on the inside surfaces of the unexposed reference samples (Ojala et al. Citation2019).
The second failure mechanism was fatigue damage to the signal chain contacts. The type B sample that was tested to failure in the DS test was studied more closely to confirm the mechanism of failure. The sample was sawn open and the signal wire was found to be severed close to the connection of the wire and the contact pin. The opened type B component is presented in .
Discussion
The tests revealed significant differences in reliability between the two designs of IP67-rated connectors. Depending on the combination of stress factors used in the test, the ranking of the connector types varied. In three tests, type B was more reliable than type A, but in the static SF test, type A was superior to type B. A summary of the test results and observations is collected in .
Table 6. Failure times (min) of the first failed samples in tests or run-out (ro) times if no failure occurred, and qualitative comparisons based on observations and high-speed camera measurements.
In the RS test, type A proved to be vulnerable to vibration. Even when an apparently sufficient tightness is used in assembly, vibration at the resonance frequency loosens the threaded structure and humidity seeps through. Type B was in general more robust and tolerated vibration stress due to its fail-safe locking mechanism. The effect of the acceleration level of vibration can be seen in the failure time data. The failure time follows the IPL-lognormal model and decreases exponentially as the acceleration level of the vibration rises (Crowe and Feinberg Citation2001).
In static conditions, type A was waterproof. The duration of type A testing was more than twice as long compared to the tests for type B, which were run until the failure of all samples. The probable cause for this difference in waterproofness is the fundamental difference in design. In type A, ingress protection is realized with a rubber O-ring, an approved method for watertightness in many applications. In the static condition, the threaded structure does not loosen under vibration and the robust O-ring seals the structure, despite the deficient assembly. The overall structure of type B is unyielding, and waterproofness is provided by three thin silicon flanges between the housing parts, but they are not firmly pressed like the O-ring in type A. The silicon flange structure gives waterproofness that surpasses the requirements of the IP67 classification, but it does not withstand long-term exposure to humidity.
The DS and DB tests monitored two failure modes. In the PT failure mode, fatigue damage to the wiring and contacts proved to be the more important failure mechanism than the failure of waterproofness. The resistive properties of the galvanic contact changes much sooner than the waterproofness fails. In these tests, type B performed clearly better. The more robust structure withstands mechanical stress better, protects the signal wire and contacts from fatigue damage, and maintains waterproofness longer. However, the difference was not as drastic as in the RS test. A fixed loading cycle frequency was used and hence none of the resonance that proved to be problematic for type A occurred.
Conclusions
The IP code is a useful generic indicator of reliability in most applications. Protection against the ingress of humidity and foreign objects is a fundamental requirement for electric components used in machinery. A structure that meets the requirements for a high IP code is also strong enough to provide relatively good protection against other stress factors. In demanding applications, however, this generalization does not apply.
Tailored tests that simulate underground mine conditions revealed weaknesses and failure mechanisms that should be considered in the design of a CAN-bus controlled system. Neither of the studied components proved to be clearly more reliable than the other. Survivability depended on the details of the test. Thus, to achieve better reliability, the actual stress factors of the operating conditions must be identified and the components selected accordingly. Acquired information about the strengths and weaknesses of connector types can be utilized in the design of the overall structure. If the component is known to be vulnerable to a specific stress factor but is otherwise suitable for the application, then the structure can be designed to provide protection against that specific factor. For example, as in the presented mine drill machinery case study, if a type A connector is used, vibration damping mounting should be used, while if a type B connector is selected, the cabling should be protected from flush water.
The failure times of waterproofness and mechanical structure are quantitative, measurable technical properties that are simple to use in the assessment of reliability. Proneness to misassembly is an important factor, yet its importance is not so straightforward to estimate. If manufacturing, maintenance, and repairs are done by authorized personnel and according to instructions, human error as a stress factor can be overlooked. However, in conditions where field repairs are done without proper equipment or by unauthorized personnel, the fail-safe structure of components is a significant advantage that cannot be ignored.
In the design of CAN-bus machinery, many factors must be considered: What are the main stress factors and suitable connectors for these conditions? Can protective structures be added to the equipment so that functionalities are not disturbed, or are the expenses of such a structure alteration too high? Does the end-user have the opportunity and desire to use authorized maintenance personnel? Overall design is always a compromise between competing factors. Even connector components are only part of the subsystem of the machinery, and the possibility to affect all details is limited. Nevertheless, more detailed information about the components’ strengths and weaknesses help in designing machinery that is more reliable and efficient.
Acknowledgements
The authors gratefully acknowledge the Henry Ford Foundation (Henry Fordin säätiö in Finnish), the Dunderberg Foundation (K.F. ja Maria Dunderbergin testamenttisäätiö in Finnish), Business Finland, and the companies Valtra Oy, Sandvik Mining and Construction Oy, TVO Oyj, and Fortum Power and Heat Oy for funding the research.
Disclosure statement
No potential conflict of interest was reported by the author(s).
Additional information
Funding
References
- Crowe D, Feinberg A. editors 2001. Design for reliability. Boca Raton (FL): CRC Press (Electronics handbook series).
- Dodson B, Schwab H. 2006. Accelerated testing: a practitioner’s guide to accelerated and reliability testing. 2nd ed. Warrendale (PA): SAE International. [accessed 2022 Jun 20]. https://www.sae.org/publications/books/content/r-518/.
- Escobar LA, Meeker WQ. 2006. A review of accelerated test models. Stat Sci. 21(4):552–557. doi:10.1214/088342306000000321.
- Hietala J, Ojala P, Multanen P, Miettinen J, Saarenrinne P. 2017. Fatigue lifetime estimation of machine component using accelerated testing. In: Čepin M, Briš R, editors. Safety and reliability. Theory and application. Proceedings of European safety and reliability conference, ESREL 2017; June 18–22; Portorož; Slovenia. Boca Raton (FL): CRC Press: Taylor & Francis Group; p. 2165–2172.
- Lalanne C. 2014. Mechanical vibrations and shock analysis, Specification Development Vol. 5. 3rd ed. Hoboken (NJ): John Wiley
- Lokman S-F, Othman AT, Abu-Bakar M-H. 2019. Intrusion detection system for automotive Controller Area Network (CAN) bus system: a review. EURASIP J Wirel Commun Netw. 1(184). doi:10.1186/s13638-019-1484-3.
- Martin JW. 2006. Materials for engineering, 3rd ed. Cambridge: Woodhead. doi:10.1533/9781845691608.
- Meeker WQ, Escobar LA. 1998. Statistical methods for reliability data. New York (NY): Wiley (Wiley series in probability and statistics. Applied probability and statistics section).
- [MIL-STD-810G] MIL-STD-810G Working Group. 2008. Department of Defence – Test Method Standard, “environmental engineering considerations and laboratory tests”. Aberdeen Proving Grounds (MD): Department of Defence.
- Misra K. 2008. Handbook of performability engineering. London: springer-verlag London. doi:10.1007/978-1-84800-131-2.
- Nelson W. 1990. Accelerated testing statistical models, test plans, and data analyses. Hoboken (NJ): John Wiley.
- Ojala P, Hietala J, Miettinen J, Julkunen P, Nieminen I. 2017a. Modelling of seep through of humidity to electric connector with stochastic processes. In: Čepin M, Briš R, editors. Safety and reliability. Theory and application. Proceedings of European safety and reliability conference, ESREL 2017; June 18–22; Portorož; Slovenia. Boca Raton (FL): CRC Press: Taylor & Francis Group; p. 3027–3034.
- Ojala P, Pippola J, Hietala J, Miettinen J, Frisk L. 2017b. Multivariable accelerated testing of seep through of humidity due to vibration in electric connector. In: Walls L, Revie M, Bedford T, editors. Risk, reliability and safety: innovating theory and practice. Proceedings of the 26th European safety and reliability conference, ESREL 2016; September 25–29. Glasgow, London: CRC Press: Taylor & Francis Group; p. 23–30.
- Ojala P, Rämö J, Nieminen I, Miettinen J. 2019. Modeling of degradation of electric connectors under varying humidity conditions. In: Beer M, Zio E, editors. e-proceedings of the 29th European Safety and Reliability Conference (ESREL). September 22–26. Hannover, Singapore: Research Publishing Services; p. 930–937. doi:10.3850/978-981-11-2724-3_0227-cd.
- [SFS] SFS Finnish Standard Association. 2000. SFS-EN 60529 + A1. This standard consists European Standard EN 60529:1991, with the incorporation of its amendment A1:2000. Degrees of protection provided by enclosures (IP code). Helsinki, Finland: Finnish standard association. [accessed 2021 Jul 6]. https://online.sfs.fi/fi/index/tuotteet/SFSsahko/CENELEC/ID2/6/171518.html.stx.
- [SFS] SFS Finnish Standard Association. 2012. SFS-EN ISO 9227. This standard consists European Standard EN ISO 9227:2012 Corrosion tests in artificial atmospheres. Salt spray tests. Helsinki, Finland: Finnish standard association https://online.sfs.fi/en/index/tuotteet/SFS/CENISO/ID6/9/245460.html.stx.
- Silverman M. 1998. Summary of HALT and HASS results at an accelerated reliability test center. In: IEEE (Reliability Society), editor. Annual reliability and maintainability symposium (reliability & maintainability symposium proceedings). January 19–22; Anaheim (CA): IEEE; p. 30–36.
- Strieter O, Snoke H. 1936. A modified accelerated weathering test for asphalts and other materials. J Res Natl Bur Stand (1934). 16:481–485. doi:10.6028/jres.016.028.
- Sutton M, Schreier H, Orteu J-J. 2009. Image correlation for shape, motion and deformation measurements: basic concepts, theory and applications. New York (NY): Springer. doi: 10.1007/978-0-387-78747-3