
ABSTRACT
Background
Childhood obesity prevention is crucial. This study aimed to assess the effect of a 6-month intervention with nutritional training and physical activity education on body fat, BMI-SDS, and consumption of sugary drinks and sweets in a sample of 69 Viennese schoolboys aged 8–11 years.
Methods
The “EDDY-Kids” study was a prevention project in a Viennese elementary school aiming to prevent excessive weight gain and obesity by increasing nutrition knowledge and daily physical activity. During the school year 2018/2019, 69 boys were recruited; weight, height, fat mass, and consumption of sugary drinks and sweets were examined at the beginning (December 2018) and at the end of the project (June 2019). Only the intervention group received nutrition lessons and physical activity education once and twice weekly, respectively.
Results
At baseline, 19/36 boys in the intervention group had overweight/obesity and 11/33 in the control group (p = 0.14). After the intervention, no significant differences in changes in BMI-SDS between the intervention and the control group were observed (p = 0.35). Body fat percentage changed from 30.5% (25.8–31.7%) to 29.4% (24.3–30.4%) in the intervention group, and from 23.3% (22.0–27.0%) to 23.7% (21.7–26.8%) in the control group (p = 0.013). At baseline, there were no differences in the consumption of sugary drinks and sweets between the intervention and the control group. After 6-months of intervention, the median consumption of sugary drinks and sweets remained similar in the intervention and the control group, and no differences between groups (p > 0.40) were found.
Conclusion
A 6-month combined intervention promoting healthier dietary and physical activity habits in schoolboys from Vienna positively and modestly affected the percentage of body fat. Reduced body fat may be beneficial independently of changes in BMI-SDS.
Introduction
The global prevalence of people with overweight and obesity increased dramatically among adults and children between 1980 and 2013 (Ng et al. Citation2014). Abarca-Gómez et al. showed an increase in the worldwide prevalence of overweight and obesity among children between 1975 and 2016. Among girls, the proportion of people with obesity rose from 0.7% to 5.6% and among boys from 0.9% to 7.8% (Bentham et al. Citation2017). In Austria, 30% of the boys and 22% of the girls between 6 and 9 years old were overweight and with obesity (WHO European Childhood Obesity Surveillance Initiative (COSI) Citation2021).
Childhood obesity as excessive fat accumulation can lead to physical, social, or emotional health problems. Children with overweight or obesity are much more likely to suffer from asthma, diabetes, high blood pressure, skeletal disorders, mental health problems, and other illnesses in adulthood (Llewellyn et al. Citation2016). Excessive weight gain during childhood is a complex phenomenon involving multiple risk factors, including genetics, behavior, and obesogenic environment, leading to overweight and obesity (Kohut et al. Citation2019). The two main modifiable factors contributing to weight gain are the increased consumption of energy-rich foods with high fat and sugar content and decreased physical activity (Beaglehole et al. Citation2011). Therefore, approaches to increasing physical activity and healthy eating have been identified as efficient means to prevent excessive weight gain during childhood (Fornari et al. Citation2021), evidence supports school-based interventions’ effectiveness (Wang et al. Citation2015).
Besides physical inactivity and unhealthy diet being two main determinants, other risk factors such as weight at birth, parents’ nutritional status, social factors, and puberty timing also play a major role (Parsons et al. Citation1999).
The user-friendliest way to measure overweight and obesity is through the body mass index (weight in kilograms [kg] divided by squared height [m] – BMI). As the size and weight change during development, so does the body-to-body fat ratio. For this reason, the interpretation of the BMI must be made in relation to other children of the same sex and age. Therefore, the BMI-for-age percentiles or BMI standard deviation (BMI-SDS) are used for children and teens, which include age and sex specification (Kromeyer-Hauschild et al. Citation2001). Although the latter can be used to assess body fat in children (Alves Junior et al. Citation2017), it does not necessarily identify fat distribution.
Moreover, body fat in the pediatric population varies between sex, race, and puberty stage (Daniels et al. Citation1997; Kyle et al. Citation2015), and the location of adipose deposits implies a different risk of health complications. Thus, body composition assessment through Bioelectrical Impedance Analysis (BIA) is also used. Although BIA generally underestimates body fat in subjects with obesity (Bosaeus et al. Citation2014), it is widely used in clinical practice as it is a non-invasive, cheap, and simple method that evaluates total body water. Although the preferred method to estimate body fat is Dual-energy X-ray absorptiometry (DXA), this procedure is expensive, difficult to implement in practice and special equipment is necessary; therefore, its use in clinical practice is limited (Lee and Gallagher Citation2008).
Priority actions for preventing overweight and obesity in children include increased consumption of fruits and vegetables, limiting the intake of energy-dense, nutrient-poor foods (such as sugary drinks and sweet snacks), as well as regular physical activity and adequate sleep (Beaglehole et al. Citation2011). Studies have shown that a higher intake of added sugars, particularly sugary beverages, is associated with higher weight gain and obesity in children by its high sugar content and lower satiety feeling compared to solid foods (Malik et al. Citation2006). A US national survey analysis observed an average increased intake of 278kcal/day from 1977 to 2001 by the expense of sugary beverages (Nielsen and Popkin Citation2004).
The EDDY study was an evaluated prevention project carried out at a Viennese elementary school for several years, aiming to prevent childhood obesity and progressive excessive weight gain through nutrition and physical activity lifestyle intervention. Previous results from the EDDY project have shown an overall trend for a less increase in body fat and reduced consumption of sweets after the intervention (Widhalm et al. Citation2018). The effect of sex in body composition is difficult to assess: the prevalence of obesity in boys compared with girls seems to be higher during teenage (Bygdell et al. Citation2021), and in boys aged 6–11 years old, a more accentuated increase in fat mass percentage has been reported when compared to girls (Santos et al. Citation2019). Moreover, obesity in Austrian boys almost doubled in girls compared to the age group. Although most interventions studies for preventing overweight or obesity in children aged 6–12 years do not analyze the effects of the interventions by gender, a recent review has shown inconclusive results, with a trend for girls in improving BMI or percentage of body fat in the intervention groups (Brown et al. Citation2019).
Moreover, interventions focusing on physical activity (Podnar et al. Citation2021) have shown larger effects in girls than in boys. In contrast, those targeting diet combined with physical activity have proven to may be effective (Brown et al. Citation2019), usually associated with small weight reductions of no clinical relevance (Pereira and Oliveira Citation2021). A cross-sectional study in Tyrol, Austria, found that boys had lower nutritional knowledge and higher consumption of soft drinks than girls (Egg et al. Citation2020). Another study in Iran has shown similar results (Naeeni et al. Citation2014); however, a school-based trial in the Netherlands, including older kids, observed after 12-month intervention a reduction in intake of sugary beverages in both sexes (Singh et al. Citation2009).
This study aimed to assess the effect of a 6-month intervention with nutritional training and physical activity program on body fat, BMI-SDS, and consumption of sugary drinks and sweets in a sample of 69 Viennese schoolboys aged 8 to 11 years.
Subjects and methods
The EDDY prevention project was developed to avoid childhood obesity through nutrition training and physical activity (Widhalm et al. Citation2018). The intervention took place at a Viennese elementary school in the school year 2018/2019. The intervention phase lasted half a school year (January 2019 – June 2019). The children were tested twice as part of the study. Once, before the start of the intervention (t0 = December 2018) and six months after the intervention ended (t1 = June 2019).
A total of 146 pupils aged 8–11 participated in the study. The kids were divided in two study groups: an intervention group (4th-grade) and a control group (3rd-grade). The control group students did not receive any intervention and were not involved in the intervention process.
According to the aim of the present analysis, only male participants (n = 69) were considered. A total of n = 36 boys were assigned to the intervention group, and n = 33 pupils were assigned to the control group.
Inclusion and exclusion criteria
All male students between the ages of 8 and 11 years in elementary school during the school year (2018/2019) were included. In addition, a declaration of consent from the participant’s legal guardian had to be available for participation. Additionally, we consider students who took part in both tests (t0 = December 2018 and t1 = June 2019). Students who joined during the school year were excluded.
Detail of the intervention
As part of school lessons, the intervention group received nutrition lessons once a week and two physical activity classes per week (each 50 minutes). The practical and interactive nutrition lessons were organized and conducted by trained members of the EDDY team. The objective of the nutrition lessons was to teach the students the basics of a balanced and healthy diet and adequate use of food. Therefore, different foods and food components were studied. Physical activity lessons were organized and held by sports students from the University of Vienna. The primary goal was to improve endurance performance through various exercises and build students’ physical strength. The multidisciplinary intervention was intended to take preventive measures to counteract the further spread of obesity and prevent possible secondary diseases.
Anthropometric, body composition, and dietary components measurements
During testing points, anthropometric and body composition data from all children (control and intervention group) were obtained by trained technicians. The children’s height was measured using a stadiometer (SECA 213, Germany), with the child standing without shoes. In light indoor clothes, body weight and fat percentages were determined by bioelectric impedance analysis using a multi-frequency segmental body composition analyzer. The investigator entered information such as age, sex, and height, and once the scale assessed body weight, a complete segmental analysis was performed in less than 20 seconds. After body weight and height were measured, BMI (kg/m2) was calculated and subsequently transformed to BMI-SDS and percentiles to classify nutritional status using the German national reference criteria by Kromeyer-Hauschild et al. (Kromeyer-Hauschild et al. Citation2001). Low weight was classified <3rd percentile, normal weight ≥3rd percentile and overweight ≥90th percentile. The obesity category was considered as the sum of the obesity (≥97th percentile) and extreme obesity (≥99.5th percentile) original categories (Kromeyer-Hauschild et al. Citation2001).
Along with the anthropometric and body composition data, we assessed the intake of sugary drinks (such as Soda, Coke, Lemonade, and Iced Tea) and sweets consumption (such as gummy sweets, candy, and chocolate) within a week through a questionnaire (times/week) (Truthmann et al. Citation2011).
Ethics
Approval for the EDDY-Study was obtained from the Ethical Committee of the Sigmund Freud University, Vienna (PAFGRW9O@EFQV885378). Written informed consent was obtained from each child and one of their legal guardians before participating in the study.
Statistical Analysis
Normality was tested by using the Shapiro-Wilk Test.
Descriptive variables were presented as median and 95% confidence interval (95% CI) and as absolute numbers and percentages according to study group and testing points t0 and t1.
Changes in body fat percentages, BMI-SDS, and the times/week of sugary drinks and sweets consumed between study groups were measured using the Mann-Whitney-U Test. The difference in proportions of categories of BMI was assessed using the Chi-squared test.
The program IBM SPSS Statistics 26 was used for statistical analysis of the data. Statistical tests were two-sided. P-values smaller than 0.05 were considered statistically significant.
Results
Median age of the kids in the intervention group was 10.2 (10.1–10.4) years (min 9.4; max 11.3 years), and in the control group 9.4 (9.2–9.6) years (min 8.4; max 10.6) (p < 0.001). At baseline, children in the intervention group had higher weight, height, and body fat percentage (p < 0.05). 19/36 boys had overweight/obesity, while the control group was 11/33 (p = 0.14). The general characteristics of the participants are shown in .
Table 1. General characteristics of participants at baseline (t0) by study group.
Changes in BMI-SDS and percentage of body fat after six months
Changes in BMI-SDS and percentage of body fat after six months among the intervention and control groups are summarized in .
Table 2. Changes in BMI-SDS and percentage of body fat after 6 months by study group.
After the intervention, the median (95% CI) BMI-SDS of the intervention group was 1.45 (0.64–1.58) compared to 0.89 (0.19–1.14) in the control group (p = 0.12).
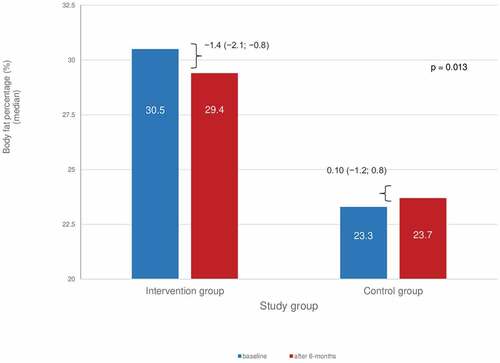
No differences were observed in changes in BMI-SDS between study groups after 6-months of intervention (p = 0.35). In the six-month follow-up measurement, a significant difference in changes in body fat percentage between the intervention and control group was observed (p = 0.013). In the intervention group, the reduction in the percentage of body fat was significantly higher than in the control group (). In the former, the percentage of body fat decreased from 30.5% (25.8–31.7%) to 29.4% (24.3–30.4%), while in the control group the percentage of body fat changed from 23.3% (22.0–27.0%) to 23.7% (21.7–26.8%).
Figure 1. Percentage of body fat at baseline and after 6 months by study group.
The frequency of boys according to BMI classification after six months of intervention are shown in . After 6 months, no difference was observed in BMI classification between study groups (p = 0.27).
Table 3. BMI classification after 6 months by study group.
Changes in consumption of sugary drinks and sweets after six months
At baseline, boys from the intervention group reported consuming sugary drinks 2.0 (2.1–4.2) times/week and sweets 2.0 (1.9–4.6) times/week. In the control group, sugary drinks were consumed 2.0 (1.9–3.5) times/week and sweets 2.0 (2.8–4.8) times/week. At baseline, no statistical difference was found between the consumption of sugary drinks (p = 0.53) and sweets (p = 0.32) between the intervention and control groups. After 6-months of intervention, the median of consumption of sugary drinks and sweets remained similar in the intervention group [2.0 (1.8–3.1) times/week and 2.0 (2.1–3.2) times/week, respectively], and no differences were observed with the control group [2.0 (1.8–3.5) times/week p = 0.94; and 2.0 (1.8–3.4) times/week, p = 0.44, respectively].
Discussion
After a 6-month intervention with nutritional training and physical activity program in Viennese schoolboys aged 8 to 11 years, our study showed a positive modest effect on reduction in the percentage of body fat. Although no difference in BMI-SDS was observed between the study groups, changes in body composition (related to lifestyle changes or puberty), such as in fat or fat-free mass, can occur without affecting BMI (Stackpole et al. Citation2020). Moreover, the reduction in BMI-SDS achieved by the intervention group was in line with that reported recently, suggesting that reductions of 0.6 BMI-SDS might successfully reduce adiposity (Birch et al. Citation2019), which could positively affect metabolic health. The lack of association with a reduction in BMI-SDS in the intervention group compared to the control group could be related to the short duration of the follow-up (Malik et al. Citation2006).
As pupils in Vienna are regularly examined by their school doctors, they could play a key role in obesity prevention by detecting excessive weight gain through periodic measurements of weight or body composition to take the first preventive steps.
At baseline, participants in the control group had a lower body fat percentage than those assigned to the intervention group. This baseline difference could be attributed to the fact that the control group (3rd-grade students) was approximately one year younger than the intervention group (4th-grade students); therefore, being the older children closer to puberty can accentuate increases in body fat percentage. Moreover, boys in the intervention group had a median body fat percentage corresponding to excessive body fat (Lobstein and Brinsden Citation2019). According to Mc Carthy et al., normal body fat percentage is ranked between the 2nd and 85th percentile, representing in a 10-year-old boy a range between 12.8% and 22.8% (Lobstein and Brinsden Citation2019). Boys classified with obesity in the intervention group almost doubled the number of boys in the control group (16/36 versus 8/33). Therefore, the intervention promoting healthier diet habits and increasing physical activity may have had a greater impact on this group’s reduction of body fat. Nevertheless, the BMI classification at baseline and after the intervention showed no positive effect on nutritional status categories; the children with excessive body weight for age remained in these categories.
The percentage of boys with overweight or obesity exceeded national estimates of 30% between the ages of 6 and 9 years, which could be related to the fact that this School has a high number of children with a migration background. Although this data was not available from this group, it has been previously assessed that a 46% of school children from Vienna had a migration background (Segna et al. Citation2012). Vienna is a cultural-mixed capital, and it is not uncommon for the parents of children born in Austria to have a migration background. Other investigators from Vienna (Segna et al. Citation2012) examined the prevalence of extreme obesity in relation to the children’s mother tongue (as an indicator for migration background) in a Viennese sample of almost 25.000 children and adolescents. Their study found that non-German-native-speaking participants showed a higher prevalence of extreme obesity (Segna et al. Citation2012). Two trials in Germany (Will et al. Citation2005; Zhou et al. Citation2018), a country with a close cultural and linguistical proximity to Austria, showed that the prevalence of overweight and obesity in children with a migration background was higher than in children with German roots. It is suggested that the higher prevalence of overweight and obesity among immigrant children is related to socio-economic status. This situation related to nutritional status in children from Vienna emphasizes the need to support integrated strategies that contribute to tackling this nutritional problem with important repercussions later on in life. Furthermore, it highlights the importance of a multicomponent approach (involving parents, teachers, and the community) instead of single approaches to fighting against this public health problem with long-term consequences (Bleich et al. Citation2018; Koletzko et al. Citation2020).
Due to the importance of limiting high calorie-low nutrient intake of beverages and foods to prevent excessive weight gain in children (Beaglehole et al. Citation2011), our study assessed the effect of a lifestyle intervention on the intake of sugary drinks and sweets. The results show that the intervention group’s average consumption of both – sugary drinks and sweets – did not change over the 6-month period. This was similar in the control group. As reported recently, evidence linking sugary drinks and particularly sweets with obesity is still contradictory (Poorolajal et al. Citation2020). A recent systematic review and meta-analysis reported that consuming sugary sweetened drinks ≥4 times/week can increase the risk of childhood obesity by 31%; however, intake of sweets showed surprising results, as consuming them ≥3 versus <3 times/week was associated with a 22% decrease in childhood obesity risk (Poorolajal et al. Citation2020). One possible explanation could be related to the fact that sweets are consumed between hours – limiting energy intake in the next meal – and to the lower satiety feeling of sugary drinks compared to solid foods (Malik et al. Citation2006). Although changing the consumption of sugary drinks may be one of the simplest dietary changes to achieve because they are easy to identify, our results could be related to the fact that our study lacked information on the amount of sweet beverages and products consumed within a week. On the other hand, water from the tap is the most common beverage in Austria (University of Vienna – Bundesministerium für Gesundheit Citation2008); therefore, the quantity of intake of sugary drinks may be limited in this group. In this sense, as schools pose an ideal setting for promoting healthy habits that contribute to preventing excessive weight gain, interventions aiming to promote drinking water instead of sugar-containing beverages are particularly important from the early stages of childhood (Wethington et al. Citation2020).
This study has several weaknesses that should be addressed. The study’s main limitation is its small number of participants, which may not provide sufficient power to observe differences in BMI-SDS or sugary drinks and sweets intake. Moreover, our results cannot be extrapolated to all Austrian schoolboys. Additionally, for practical reasons, the intervention addressed children that were in 4th-grade whereas the controls were in 3rd-grade, which may have affected the results. Furthermore, only the times/week of sugary drinks and sweets consumed were assessed, not the quantity. Strengths of this study include the evaluation of body fat mass through BIA.
In conclusion, our results showed that a 6-month combined intervention promoting healthier dietary and physical activity habits in schoolboys from Vienna positively affected the percentage of body fat, which can be considered a measure of success independently of changes in BMI-SDS. No changes were reported regarding the consumption of sugary drinks and sweets. A holistic, long-term approach must be considered to improve dietary and lifestyle behaviors. Multiple factors influence food choices (such as gender, family culture, socioeconomic status, food advertising, and public policies, among others) and contribute to the epidemic of childhood obesity.
Author contributions
JM, PM and KW designed the research. JM was responsible for data acquisition. PM and JM analyzed the data and performed statistical analysis. PM and JM drafted the manuscript. KW reviewed the manuscript. All authors read and approved the final manuscript.
Statement of Ethics
The current study was conducted according to the guidelines laid down in the Declaration of Helsinki. All procedures followed were approved by the Ethical Committee of the Sigmund Freud University, Vienna (PAFGRW9O@EFQV885378). Written informed consent was obtained from all participants for being included in the study.
Disclosure statement
No potential conflict of interest was reported by the author(s).
Additional information
Funding
References
- Ng M, Fleming T, Robinson M, Thomson B, Graetz N, Margono C, Mullany EC, Biryukov S, Abbafati C, Abera SF, et al. 2014. Global, regional, and national prevalence of overweight and obesity in children and adults during 1980-2013: a systematic analysis for the Global Burden of disease study 2013. Lancet. 384(9945):766–781. doi:10.1016/S0140-6736(14)60460-8.
- Bentham J, Di Cesare M, Bilano V, Bixby H, Zhou B, Stevens GA, et al. 2017 Dec 16. Worldwide trends in body-mass index, underweight, overweight, and obesity from 1975 to 2016: a pooled analysis of 2416 population-based measurement studies in 128·9 million children, adolescents, and adults. Lancet. 390(10113):2627–2642.
- WHO European Childhood Obesity Surveillance Initiative (COSI) Report on the fourth round of data collection. 2021;
- Llewellyn A, Simmonds M, Owen CG, Woolacott N. 2016 Jan 1. Childhood obesity as a predictor of morbidity in adulthood: a systematic review and meta-analysis. Obes Rev. 17(1):56–67. doi10.1111/obr.12316.
- Kohut T, Robbins J, Panganiban J. 2019 Oct 1. Update on childhood/adolescent obesity and its sequela. Curr Opin Pediatr. 31(5):645–653. doi10.1097/MOP.0000000000000786.
- Beaglehole R, Bonita R, Horton R, Adams C, Alleyne G, Asaria P, et al. 2011. Priority actions for the non-communicable disease crisis. Lancet. 377(9775):1438–1447. doi:10.1016/S0140-6736(11)60393-0
- Fornari E, Brusati M, Maffeis C. 2021 Jun 1. Nutritional Strategies for Childhood Obesity Prevention. Life. 11(6). doi:10.3390/life11060532.
- Wang Y, Cai L, Wu Y, Wilson RF, Weston C, Fawole O, et al. 2015 Jul 1. What childhood obesity prevention programmes work? A systematic review and meta-analysis. Obes Rev. 16(7):547–565. doi:10.1111/obr.12277.
- Parsons TJ, Power C, Logan S, Summerbell CD. 1999. Childhood predictors of adult obesity: a systematic review. Int J Obes Relat Metab Disord. 8(8).
- Kromeyer-Hauschild K, Wabitsch M, Kunze D, Geller F, Geiß HC, Hesse V, et al. 2001. Perzentile fur den body-mass-index fur das kindes-und jugendalter unter heranziehung verschiedener deutscher stichproben. Monatsschr Kinderheilkd. 149(8):807–818. doi:10.1007/s001120170107
- Alves Junior CAS, Mocellin MC, Gonçalves ECA, Silva DAS, Ebsm T. 2017 Sep 1. Anthropometric indicators as body fat discriminators in children and adolescents: a systematic review and meta-analysis. Adv Nutr. 8(5):718–727. 10.3945/an.117.015446.
- Daniels SR, Khoury PR, Morrison JA. 1997. The utility of body mass index as a measure of body fatness in children and adolescents: differences by race and gender. Pediatrics. Jun 99(6):804–807. 10.1542/peds.99.6.804
- Kyle UG, Earthman CP, Pichard C, Coss-Bu JA. 2015 Jun 3. Body composition during growth in children: limitations and perspectives of bioelectrical impedance analysis. Eur J Clin Nutr. 69(12):1298–1305. doi10.1038/ejcn.2015.86.
- Bosaeus M, Karlsson T, Holmäng A, Ellegård L. 2014. Accuracy of quantitative magnetic resonance and eight-electrode bioelectrical impedance analysis in normal weight and obese women. Clin Nutr. 33(3):471–477. doi:10.1016/j.clnu.2013.06.017.
- Lee SY, Gallagher D. 2008. Assessment methods in human body composition. Curr Opin Clin Nutr Metab Care. Sep 11(5):566–572. 10.1097/MCO.0b013e32830b5f23
- Malik VS, Schulze MB, Hu FB. 2006. Intake of sugar-sweetened beverages and weight gain: a systematic review. Am J Clin Nutr. 84(2):274–288. doi:10.1093/ajcn/84.2.274.
- Nielsen SJ, Popkin BM. 2004. Changes in beverage intake between 1977 and 2001. Am J Prev Med. 27(3):205–210. doi:10.1016/j.amepre.2004.05.005.
- Widhalm K, Helk O, Pachinger O. 2018. The Viennese EDDY study as a role model for obesity: prevention by means of nutritional and lifestyle interventions. Obes Facts. 11(3):247–256. doi:10.1159/000481140.
- Bygdell M, Célind J, Lilja L, Martikainen J, Simonson L, Sjögren L, et al. Prevalence of overweight and obesity from 5 to 19 years of age in Gothenburg, Sweden. Acta Paediatr. 2021 Dec;110(12):3349–3355. 10.1111/apa.16089
- Santos LP, Santos IS, Matijasevich A, Barros AJD. 2019 Dec 13. Changes in overall and regional body fatness from childhood to early adolescence. Sci Rep. 9(1):1888. 10.1038/s41598-019-38486-x.
- Brown T, Moore TH, Hooper L, Gao Y, Zayegh A, Ijaz S, et al. Interventions for preventing obesity in children. Cochrane Database Syst Rev. 2019 Jul 23;7(7). 10.1002/14651858.CD001871.pub4
- Podnar H, Jurić P, Karuc J, Saez M, Barceló MA, Radman I, et al. Comparative effectiveness of school-based interventions targeting physical activity, physical fitness or sedentary behaviour on obesity prevention in 6- to 12-year-old children: a systematic review and meta-analysis. Obes Rev. 2021 Feb 1;22(2). 10.1111/obr.13160
- Pereira AR, Oliveira A. 2021 Oct 1. Dietary Interventions to prevent childhood obesity: a literature review. Nutrients. 13(10):3447. 10.3390/nu13103447.
- Egg S, Wakolbinger M, Reisser A, Schätzer M, Wild B, Rust P. 2020 Dec 1. Relationship between nutrition knowledge, education and other determinants of food intake and lifestyle habits among adolescents from urban and rural secondary schools in Tyrol, Western Austria. Public Health Nutr. 23(17):3136–3147. 10.1017/S1368980020000488.
- Naeeni MM, Jafari S, Fouladgar M, Heidari K, Farajzadegan Z, Fakhri M, et al. 2014 Dec 1. Nutritional knowledge, practice, and dietary habits among school children and adolescents. Int J Prev Med. 5(Suppl 2):S171–8. doi:10.4103/2008-7802.157687.
- Singh AS, Chin A, Paw MJM, Brug J, Van Mechelen W. 2009. Dutch obesity intervention in teenagers: effectiveness of a school-based program on body composition and behavior. Arch Pediatr Adolesc Med. 163(4):309–317. doi:10.1001/archpediatrics.2009.2.
- Truthmann J, Mensink GBM, Richter A. 2011. Relative validation of the KiGGS Food Frequency Questionnaire among adolescents in Germany. Nutr J. 10(1). doi:10.1186/1475-2891-10-133.
- Stackpole K, Khoury P, Siegel R, Gier A. 2020. Body composition versus BMI as measures of success in a clinical pediatric weight management program. Reports. 3(4):32. doi:10.3390/reports3040032.
- Birch L, Perry R, Hunt LP, Matson R, Chong A, Beynon R, et al. What change in body mass index is associated with improvement in percentage body fat in childhood obesity? A meta-regression. BMJ Open. 2019 Aug 1;9(8). 10.1136/bmjopen-2018-028231
- Lobstein T, Brinsden H. 2019. Atlas of childhood obesity.
- Segna D, Widhalm H, Pandey MP, Zehetmayer S, Dietrich S, Widhalm K. 2012. Impact of mother tongue and gender on overweight, obesity and extreme obesity in 24,989 Viennese children/adolescents (2-16 years). Wien Klin Wochenschr. Nov 124(21–22):782–788. 10.1007/s00508-012-0277-z
- Will B, Zeeb H, Baune BT Overweight and obesity at school entry among migrant and German children: a cross-sectional study. BMC Public Health. 2005 May 9;5. 1 10.1186/1471-2458-5-45
- Zhou Y, von Lengerke T, Walter U, Dreier M. 2018 May 1. Migration background and childhood overweight in the Hannover Region in 2010-2014: a population-based secondary data analysis of school entry examinations. Eur J Pediatr. 177(5):753–763. 10.1007/s00431-018-3118-x.
- Koletzko B, Fishbein M, Lee WS, Moreno L, Mouane N, Mouzaki M, et al. 2020. Prevention of childhood obesity: a position paper of the global federation of international societies of paediatric gastroenterology. Hepatology and Nutrition (FISPGHAN) J Pediatr Gastroenterol Nutr. 70(5):702–710. doi:10.1097/MPG.0000000000002708
- Bleich SN, Vercammen KA, Zatz LY, Frelier JM, Ebbeling CB, Peeters A. 2018. Interventions to prevent global childhood overweight and obesity: a systematic review. Vol. 6, The Lancet Diabetes and Endocrinology. Lancet Publishing Group. p. 332–346.
- Poorolajal J, Sahraei F, Mohamdadi Y, Doosti-Irani A, Moradi L. 2020. Behavioral factors influencing childhood obesity: a systematic review and meta-analysis. Vol. 14, Obesity Research and Clinical Practice Elsevier Ltd. p. 109–118.
- University of Vienna – Bundesministerium für Gesundheit. 2008. Austrian nutrition report. [Internet]. Vienna (Austria); . Available from: https://www.sozialministerium.at/
- Wethington HR, Finnie RKC, Buchanan LR, Okasako-Schmucker DL, Mercer SL, Merlo C, et al. 2020. Healthier food and beverage interventions in schools: four community guide systematic reviews. Am J Prev Med. 59:15–26. doi:10.1016/j.amepre.2020.01.011.