
 ?Mathematical formulae have been encoded as MathML and are displayed in this HTML version using MathJax in order to improve their display. Uncheck the box to turn MathJax off. This feature requires Javascript. Click on a formula to zoom.
ABSTRACT
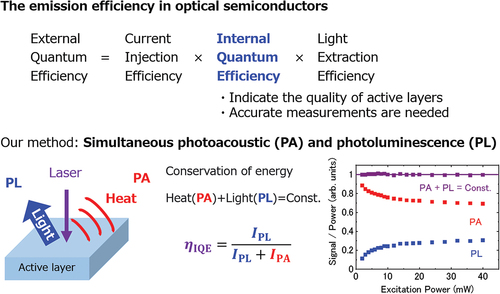
Separated evaluation of factors in the external quantum efficiency (EQE) is important in order to improve the characteristics of semiconductors optical devices. Especially, the internal quantum efficiency (IQE) is an important value which indicates crystal quality of the active layers, and an accurate method for estimating the IQE values is required. The IQE is usually estimated from temperature dependence of photoluminescence (PL) intensity by assuming that the IQE at cryogenic temperature is 100%. However, III-nitride semiconductor materials, used in many optical devices, usually have large defect density, and the assumption is not necessarily valid. In our previous report, we demonstrated the simultaneous photoacoustic (PA) and PL measurements to accurately estimate the IQE values in GaN films with various qualities and obtained reasonable results. In this work, we have successfully realized reproducible measurements with high accuracy for an InGaN-QW sample by suppressing the background noise significantly. Furthermore, we have also measured the values of EQE by using an integrating-sphere. Since the light extraction efficiency (LEE) can be obtained by the values of IQE and EQE, it has been shown that the overall picture of emission efficiency can be provided by our method.
Graphical abstract
IMPACT STATEMENT
We have proposed a method that is accurate in estimating the internal quantum efficiency (IQE) values for InGaN quantum well structures. And, combined with external quantum efficiency (EQE) values measured by the integrating-sphere method, estimated light extraction efficiency (LEE) values. From the above methods, we can separately evaluate the IQE, EQE, and LEE values.
1. Introduction
InGaN (AlGaN) quantum wells (QWs) have been attracting much attention as materials for optical devices. And, already InGaN-based blue and green light-emitting diodes (LEDs) are widely used. However, the long-wavelength (e.g. yellow to red) and the ultra-violet emitting optical devices which used InGaN-QWs [Citation1–6] and AlGaN-QWs [Citation7–18], respectively, have not been realized for commercial use since their external quantum efficiency (EQE) is very low (under 10%). In addition, III-nitride LEDs suffer from decreasing the EQE with increasing current density (i.e. efficiency droop). Generally, the EQE is expressed as the multiply of current injection efficiency (CIE), internal quantum efficiency (IQE), and light extraction efficiency (LEE), and in order to investigate the reasons for low EQE values, it would be necessary to evaluate CIE, IQE and LEE separately. Under the current injection situations, the EQE values are usually estimated from integrating-sphere method, CIE and LEE values are estimated from the theoretical calculation, and IQE values are obtained by back calculation from their values. However, the validity of the theoretical calculations of CIE and LEE is questionable, and then IQE values are also uncertain. Moreover, in developing and designing devices situation, it is very important to estimate the accurate IQE values in order to evaluate crystal quality of epitaxial layers which before attaching electrodes. Therefore, it is desirable to estimate IQE values under photo-excitation, in addition the CIE can be neglected since the carriers in the active layer are excited directly.
IQE values in semiconductor materials are usually estimated by temperature dependence of PL integrated intensity [Citation19–22]. In this method (PL thermal quenching method), the IQE at cryogenic temperature (below 10 K) is assumed as unity, and the IQE at room temperature (RT) is estimated as the ratio of the PL integrated intensity at RT to that at low temperature (LT). The assumption means that non-radiative recombination processes at extremely LT are completely suppressed. The non-radiative processes, however, can be still active even at LT in III-nitride semiconductor materials [Citation23–25]. For example, GaN films usually have high defect (dislocation) density (106–108 cm−2) [Citation26–28]. In addition, there is another problem in this method. Since a laser light source is usually used for the excitation, the excitation light wavelength and intensity are fixed in the measurements. However, the absorption coefficient for the excitation light changes with temperature due to temperature dependence of bandgap energy and it is not so easy to keep the photo-excited carrier density constant over the entire temperature range of measurement [Citation29–31]. Thus, it cannot be said that the IQE estimation method using temperature dependence of PL intensity provides accurate IQE values.
On the other hand, the IQE values are sometimes estimated from the excitation power dependence of PL integrated intensity. In this method, the following rate equation is used in the analysis of the power dependence [Citation32–35];
where is the carrier density, and the first, second, and third terms in the right side of the equation, correspond to defect-induced non-radiative recombination, electron–hole pair radiative recombination, and Auger recombination, respectively. Steady state solution of the rate equation can be used for the fitting of the excitation power dependence of PL intensity. However, this method assumes a specific rate equation model and the accuracy of the estimation depends on the validity of the model. We previously studied the validity of the rate equation of the ABC model by decay curve analysis for GaN samples, and it was found that the ABC model cannot fit the decay curves [Citation36].
In this situation, several new methods have been proposed to accurately estimate the IQE values [Citation37–43]. We consider that it is desirable for the accurate IQE estimation to observe both light and heat generation by radiative and non-radiative recombination, respectively, and we have performed simultaneous photoacoustic (PA) and PL measurements in III-nitride semiconductor materials [Citation44,Citation45]. The original concept of this method was theoretically proposed by David. J. Dunstan [Citation46], but we have developed a realistic lab-level experimental method and demonstrated its usefulness in nitride semiconductors.
In our previous studies, we performed the IQE measurements for GaN films with different qualities, and the results showed that the estimated IQE value changes depending on the sample quality [Citation44]. Furthermore, by combination with time-resolved PL measurements, we successfully separated radiative recombination lifetime and non-radiative recombination lifetime, and obtained reasonable results [Citation47]. Next, we tried the measurements for InGaN quantum well (QW) structures [Citation45] since InGaN-QWs are usually used as active layers in III-nitride optical devices and the estimation of IQE in the QW layers is essential to characterize the quality of active layers. However, accurate and reproducible IQE measurements were not that easy because PA signal intensity from very thin SQW layer is so small and comparable with background noise.
In this work, we have successfully reduced the background noise in the PA measurement to accurately estimate IQE values in InGaN-QW samples by the simultaneous PA and PL measurement method. In addition, we have also performed the measurement of external quantum efficiency (EQE) by using an integrating-sphere. By measuring both IQE and EQE values, light extraction efficiency (LEE) can be also estimated, and the overall status of emission efficiency can be understood. In this paper, we will describe the experimental methods including the analysis of the experimental data to estimate the IQE and EQE values and will show results of the demonstrative measurements.
2. The IQE measurement by simultaneous PA and PL measurements
2.1. Principle of the IQE measurement method
There are several methods categorized in the PA measurements. Among them, the microphone method was used in this study [Citation48,Citation49]. In this measurement, a sample is located in a metal cell covered with quartz glass. Intensity-modulated excitation laser light is irradiated on the sample through the glass, and the heat generation by non-radiative recombination in the sample causes thermal wave and it is transmitted as sound wave in the air inside the cell, and the sound is detected by a high-sensitive microphone. Since the sound signal intensity is proportional to the thermal energy generated by non-radiative recombination, the PA signal can be used in the IQE estimation. shows the experimental setup of the simultaneous PA and PL measurement to estimate the IQE values of InGaN-QW samples. The measurements were performed at RT. A 405-nm laser diode (LD) was used as an excitation light source and the light selectively excites the QW layer. The laser light was modulated by an optical chopper (modulation frequency: 25 Hz) and focused on the surface of the sample in a closed PA cell through a quartz glass window. A spot size was around 100 μm. A dielectric multilayer film mirror (the reflectivity > 99% at 405 nm) was placed under the sample in the cell so that transmitted excitation light through the film sample can be reflected to suppress the extra heat generation by the light. PL from the sample was collected by lenses into a USB spectrometer (Ocean Optics, USB4000). On the other hand, heat generated by non-radiative recombination was detected as sound signal, which is called a PA signal, by a high-sensitive microphone (RION Co., Ltd., UC-57 and NH-17) and the signal is amplified by sound-level meter (RION Co., Ltd., UN-14). The PA signal with the chopper frequency was amplified by a lock-in amplifier (NF Corporation, LI5640). Next, we will explain how to estimate the IQE value from the measurement results. Since the photo-excited carriers recombine either radiatively or non-radiatively, and generate light or heat, respectively, the following equation can be described;
Figure 1. An experimental setup of the simultaneous PA and PL measurement to estimate the IQE values of the InGaN-QW sample. (a) A schematic diagram of the simultaneous PA and PL measurements system. (b) A photo of the actual experimental system. The PA measurement system (the PA cell and the microphone) is located on the vibration isolation table. (c) A photo of the PA cell and the microphone system located on the vibration isolation mat. An InGaN-QW sample in the cell is irradiated by laser beam.

where ,
,
, and
are excitation light density, the numbers of photo-excited carriers, radiative recombination carriers, and non-radiative recombination carriers, respectively. The value of
is proportional to excitation light density
and the PL and PA signal intensities are proportional to
and
, respectively. Therefore, the following equations can be described;
where and
are PL and PA signal intensities, respectively, and
,
,
are proportional coefficients. Since the PL and PA signal intensities are relative values, they cannot be compared directly. However, the two signals can be compared by utilizing non-linear behavior with respect to the excitation light density dependence of PA and PL intensities (due to IQE values change with carrier density). Since the absorbed light energy is released by either radiative or non-radiative recombination, the sum of the light and heat energies generated in the sample should be equal to the energy of the absorbed excitation light energy due to the energy conservation law. (Strictly speaking, the heat energy generated by intra-band energy relaxation should be considered. The correction related to this effect will be described later.) Therefore, when the PL and PA signal intensities are in a state where they can be compared as energy, the sum of the two signals is proportional to the excitation light density. In other words, when either PL or PA signal intensity obtained in the measurement is multiplied by an appropriate coefficient and the sum of the two signals is proportional to the excitation light density, the two signals can be directly compared in energy. The above situation can be generally described as follows;
and the following equation is obtained by dividing Eq. (8) by the excitation light power and the proportional coefficient
,
Here, the equation can be simplified as follows,
This equation shows that the sum of light and heat energy is always proportional to excitation light power because of the energy conservation law. In this situation, the ratio of light energy to total energy (light + heat) generated in the sample (), which is IQE, can be described as follows,
This IQE estimation method cannot be applied when the PL and PA signal intensities are completely proportional to the excitation power. In most cases, however, PL and PA intensities show non-linear behavior with respect to excitation power, and this method can be a powerful way to estimate the IQE values.
2.2. Noise reduction in the PA measurement
As described above, PA signal intensity from an InGaN-QW layer is very small because the QW layer is very thin and only small part of excitation light can be absorbed in the QW. Thus, the S/N ratio was very low, and accurate IQE measurement was not easy in InGaN-QW samples. Then, we aimed to increase the S/N ratio to 1000 or more because the ratio in the measurement in GaN bulk sample is about 1000 and the IQE values can be successfully estimated with an accuracy of 1% [Citation44]. To increase the S/N ratio, we first investigated the cause of the background noise. In this measurement, environmental sounds and vibration are candidates for noise sources. First, we took measures against sound noise, but it did not lead to background noise reduction. Thereby, we focused on the other candidate, vibration of the optical table where the PA cell and microphone are located, and measured the frequency spectra of vibration acceleration in the horizontal and vertical directions by using the mobile accelerometer application (Dmitriy Kharutskiy, Vibration analysis). At the same time, the frequency spectrum of microphone background noise is detected by an oscilloscope under the condition without laser excitation. ) shows a comparison between the frequency spectra of vibration acceleration and the noise spectrum of the microphone. The two spectra are quite similar. Hence, it is considered that the vibration of the optical table is the cause of background noise of the PA measurement. Then, we tried to reduce the vibration using an additional passive vibration isolation table by rubber balloons (Sigma Koki, DT4048MA). ) shows a comparison of the background noise between the cases with and without the vibration isolation. It is clearly seen that the noise is greatly reduced. As a result, the S/N ratio in the PA measurement has been greatly improved by using the additional vibration isolation. shows the time fluctuation of PA signal intensity and back-ground noise in the measurement for an InGaN-QW sample. The back-ground noise of the two cases (with the vibration isolation table and without the table) is shown in the figure. It is observed that the background noise is reduced by one order of magnitude or more, and that the S/N ratio is improved to ~1000 in a typical experimental condition (modulation frequency: 25 Hz, laser excitation density: 0.06 kW/cm2).
Figure 2. A comparison of (a) the measured acceleration spectra of optical table vibration for the three directions and (b) a background noise spectrum in the PA measurements.

Figure 3. A comparison of the background noise in the PA measurement between the cases (a) without a vibration isolation table and (b) with a vibration isolation table.

Figure 4. Time fluctuation of the PA signal intensity of an InGaN-QW sample and background noise (with and without vibration isolation) measured by lock-in amplifier in the PA measurement (modulation frequency: 25 hz, laser excitation density: 0.06 kW/cm2).

2.3. Details of the IQE measurement
We have performed demonstrative experiment of the simultaneous PA and PL measurements for an InGaN single quantum well (SQW) layer grown on a sapphire substrate. The emission wavelength of the sample is around 520 nm as shown in the PL spectrum as shown in . shows excitation light density dependence of PA and PL intensities for the InGaN-SQW sample. Both the signal intensities show nonlinear behavior with respect to the excitation light density. The non-linearity is more clearly shown in , where the signal intensity divided by excitation light density is plotted as a function of excitation light density. In this figure, the data would be horizontally flat when the data are linear with excitation light density. However, deviation from the flat line can be seen in the lower excitation region for both the PA and PL signals. The PL intensity shows superlinear behavior. On the other hand, the PA intensity shows sublinear behavior. In , the simple sum of PA and PL intensities is plotted, and it is not on a horizontal straight line (which means that it is not proportional to excitation light density). By multiplying the PA and PL data by appropriate factors according to EquationEquation 8(8)
(8) , the PA+PL data can be on a flat line as shown in . In the rescaled figure, the two (PA and PL) signals can be compared and the value of IQE can be estimated from the ratio of the two signals according to EquationEquation 9
(9)
(9) .
Figure 5. A room-temperature PL spectrum of an InGaN-SQW sample grown on a sapphire substrate. A 405-nm laser diode was used as an excitation source, and the excitation power density was ~0.12 kW/cm2.

Figure 6. (a) a measured excitation light density dependence of PA and PL intensities for the InGaN-SQW sample. The sum of PA and PL intensities (mere sum of numbers of nominal signal intensities) are also plotted. (b) The data obtained by dividing these data in (a) by excitation light density. The broken lines in both the figure are guide lines which corresponds to linear relationship between signal intensity and excitation light density.

Figure 7. The same data as those shown in fig. 6, but rescaled by multiplying the PA and PL signals so that the PA+PL data can be on a flat line. The horizontal broken lines show guide lines, and the vertical line corresponds to excitation light density of 0.12 kW/cm2 under which condition the EQE measurement was performed for the same sample.

So far, we have described that the origin of PA signal is non-radiative recombination, but intra-band energy relaxation of photo-excited hot carriers before radiative or non-radiative recombination can also cause heat generation and it can be the origin of PA signal. This effect should be considered to estimate accurate IQE values. The correction can be performed simply by multiplying by a coefficient as follows [Citation45];
where is the raw data of IQE obtained in , and
is the calibrated IQE value. Eexc and EPL are the photon energy of excitation light and PL. In the demonstrative measurement, excitation light and PL photon energy are 3.06 eV (405 nm) and 2.38 eV (520 nm), respectively. Since
is obtained from as 5.2% at 0.12 kW/cm2 excitation, the calibrated IQE value (
) is estimated as 6.4% at 0.12 kW/cm2 excitation by using EquationEquations (10)
(10)
(10) . It is known that the IQE values of InGaN-SQW structures are low, compared with multiple quantum well structures and SQW without InGaN underlying layer [Citation50,Citation51]. The InGaN-QW sample used in this study is an InGaN-SQW structure without InGaN underlying layer sample. Therefore, it is considered that measured IQE value is not high. It is noted that, as a reference data, the IQE value of this SQW sample is about 3% estimated by the PL thermal quenching method (excitation conditions: 385 nm, 18 W/cm2, pulse).
shows the excitation light density dependence of the calibrated IQE value for the InGaN-SQW sample. The measurements have been carried out twice to check the reproducibility, and the results showed good reproducibility as shown in . In addition, it is observed that IQE gradually increases with increasing excitation light intensity, and this can be explained by the following two possible effects. One is the saturation of carrier capture into non-radiative centres [Citation42,Citation52,Citation53], and the other one is the screening of piezo-electric field in the QW [Citation54–56]. The extent of the contribution of each of the two effects is not known at this time, but the two effects can be evaluated separately by performing a time-resolved PL measurement. This will be reported elsewhere.
Figure 8. The excitation light density dependence of the calibrated IQE value for the InGaN-SQW sample. The measurements have been carried out twice to check the reproducibility, and the results showed good reproducibility.

3. EQE estimation by using an integrating-sphere
Next, we will explain the method to estimate EQE values by using an integrating-sphere. shows the experimental setup of this method. In this experiment, a sample was placed inside an integrating-sphere, and excitation light was irradiated on the sample surface through a small aperture of the integrating-sphere. And, PL and laser intensity were measured with sufficient dynamic range, respectively, by changing the exposure time of the USB spectrometer (2000 ms for PL intensity measurements, and 10 ms for laser intensity measurements). The values of EQE were estimated by the following equation in this method.
Figure 9. An experimental setup of the EQE estimation measurement using an integrating-sphere. (a) A schematic diagram of the EQE estimation measurement system. The excitation condition in the EQE measurement system is the same as that in the IQE estimation measurement system. (b) A photo of the actual experimental system. (c) A photo of an InGaN-QW sample in the integrating-sphere. Because the side lid is removed for photography, it is seen that the sample is emitting light. (d) A photo of the optical systems for light coupling to optical fibers. The laser light cut filter (405 nm) was used for the PL measurement.

where is PL integrated intensity,
is excitation laser light intensity, and
is the sum of transmitted and scattered/reflected light intensity of the excitation laser light. First, the PL spectrum of the sample is measured with the sample set in the integrating sphere. The measured PL spectrum of the InGaN-SQW sample, which is the same sample used in the IQE measurement, is shown in . The PL intensity (
) can be obtained by integrating the emission peak. A long-pass filter was inserted between the two lenses to cut the excitation light in this measurement. Next, the sum of transmitted and scattered/reflected laser light intensity (
) is measured by removing the long-pass filter and counting sharp peak intensity at around 405 nm. Finally, the total laser light intensity is measured by removing the sample in the integrating-sphere and measuring the laser light. also shows the measured spectra of laser light when an InGaN-SQW sample is placed in the integrating-sphere and when it is not placed. It can be seen that the laser light and PL emission peaks are clearly separated. shows the magnified view of laser emission peak in , and the difference between when the sample is placed and when it is not placed, is clearly seen. Then, the EQE value can be obtained by using EquationEquation (11)
(11)
(11) , and the EQE value in the InGaN-SQW sample is estimated as 2.9% at 0.12 kW/cm2 excitation.
Figure 10. (a) Measured PL spectrum of the InGaN-SQW sample (green line) and the spectra of excitation laser light for the cases with (red line) and without (blue line) the sample in the integrating-sphere. (b) The magnified view of laser emission spectra shown in (a).

4. Estimation of LEE
Thus, both the IQE and EQE values of the same InGaN-QW sample are estimated as 6.4% and 2.9% at the same excitation condition (405 nm, 0.12 kW/cm2) by the simultaneous PA and PL measurements and the integrating sphere method, respectively. Since the EQE is the product of IQE and LEE, the LEE value can be obtained simply by dividing the EQE value by the IQE value, and the LEE value is estimated as 44% in the InGaN-QW sample. This value is higher than the theoretical LEE value (~25%) for the films with complete flat top and bottom surfaces on transparent substrates. This could be attributed to the roughness of the film surface and the interface between the sapphire substrate and the nitride film. Note that, the LEE value is calculated as follows. First, we considered that a cylindrical sample with a flat surface. And, assume that the light beyond the critical angle (, obtained from the refractive index of the air (
) and the InGaN-QW layer (
at 520 nm), never comes out again. Then, the LEE value is obtained from the following equation,
where, is the correction term for the polarization intensity of the emission from the QW.
5. Conclusions
In summary, we have established the simultaneous PA and PL measurements to estimate accurate IQE values in InGaN-QW samples. Furthermore, we have also demonstratively measured the values of external quantum efficiency (EQE) by using an integrating-sphere, and the accurate IQE and EQE estimations also allow for accurate LEE estimation. It has been demonstrated that the overall picture of emission efficiency can be provided by our method, and it is considered that this will lead to the clarification of the problem of III-nitride LEDs such as efficiency droop.
Disclosure statement
No potential conflict of interest was reported by the author(s).
Additional information
Funding
References
- Hwang JI, Hashimoto R, Saito S, et al. Development of InGaN-based red LED grown on (0001) polar surface. Appl Phys Express. 2014;7:071003. doi: 10.7567/APEX.7.071003
- Li Y, Liu B, Zhang R, et al. Investigation of surface-plasmon coupled red light emitting InGaN/GaN multi-quantum well with ag nanostructures coated on GaN surface. J Appl Phys. 2015;117(15):153103. doi: 10.1063/1.4918555
- Iida D, Zhuang Z, Kirilenko P, et al. 633-nm InGaN-based red LEDs grown on thick underlying GaN layers with reduced in-plane residual stress. Appl Phys Lett. 2020;116(16):162101. doi: 10.1063/1.5142538
- Pasayat SS, Gupta C, Wong MS, et al. Demonstration of ultra-small (<10 μm) 632 nm red InGaN micro-LEDs with useful on-wafer external quantum efficiency (>0.2%) for mini-displays. Appl Phys Express. 2021;14:011004. doi: 10.35848/1882-0786/abd06f
- Zhuang Z, Iida D, Velazquez-Rizo M, et al. InGaN-based red light-emitting diodes: from traditional to micro-LEDs. IEEE Electron Device Lett. 2021;42:1029. doi: 10.1109/LED.2021.3080985
- Hou X, Fan SS, Xu H, et al. Optical properties of InGaN-based red multiple quantum wells. Appl Phys Lett. 2022;120(26):261102. doi: 10.1063/5.0096155
- Hirayama H, Yatabe T, Noguchi N, et al. 231-261 nm AlGaN deep-ultraviolet light-emitting diodes fabricated on AlN multilayer buffers grown by ammonia pulse-flow method on sapphire. Appl Phys Lett. 2007:91;071901. doi: 10.1063/1.2770662
- Hirayama H, Noguchi N, Yatabe T, et al. 227 nm AlGaN light-emitting diode with 0.15 mW output power realized using a thin quantum well and AlN buffer with reduced threading dislocation density. Appl Phys Express. 2008;1:051101. doi: 10.1143/APEX.1.051101
- Taniyasu Y, Kasu M. Surface 210 nm light emission from an AlN p–n junction light-emitting diode enhanced by A-plane growth orientation. Appl Phys Lett. 2010;96(22):221110. doi: 10.1063/1.3446834
- Hirayama H, Tsukada Y, Maeda T, et al. Marked enhancement in the efficiency of deep-Ultraviolet AlGaN light-emitting diodes by using a multiquantum-barrier electron blockingyayer. Appl Phys Express. 2010;3:031002.
- Mehnke E, Kuhn C, Guttmann M, et al. Efficient charge carrier injection into sub-250 nm AlGaN multiple quantum well light emitting diodes. Appl Phys Lett. 2014:105;051113. doi: 10.1063/1.4892883
- Takano T, Mino T, Sakai J, et al. Deep-ultraviolet light-emitting diodes with external quantum efficiency higher than 20% at 275 nm achieved by improving light-extraction efficiency. Appl Phys Express. 2017;10(3):031002. doi: 10.7567/APEX.10.031002
- Zhang Y, Jamal-Eddine Z, Akyol F, et al. Tunnel-injected sub 290 nm ultra-violet light emitting diodes with 2.8% external quantum efficiency. Appl Phys Lett. 2018;112(7):071107. doi: 10.1063/1.5017045
- Tan S, Zhang J, Egawa T, et al. Influence of quantum-well number and an AlN electron blocking Layer on the electroluminescence properties of AlGaN deep ultraviolet light-emitting diodes. Appl Sci. 2018;8(12):2402. doi: 10.3390/app8122402
- Mehnke F, Sulmoni L, Guttmann M, et al. Influence of light absorption on the performance characteristics of UV LEDs with emission between 239 and 217 nm. Appl Phys Express. 2019;12(1):012008. doi: 10.7567/1882-0786/aaf788
- Yoshikawa A, Hasegawa R, Morishita T, et al. Improve efficiency and long lifetime UVC LEDs with wavelengths between 230 and 237 nm. Appl Phys Express. 2020;13(2):022001. doi: 10.35848/1882-0786/ab65fb
- Murotani H, Miyoshi H, Takeda R, et al. Correlation between excitons recombination dynamics and internal quantum efficiency of AlGaN-based UV-A multiple quantum wells. J Appl Phys. 2020;128(10):105704. doi: 10.1063/5.0015554
- Funato M, Kawakami Y. Singularity structures for sub-250 nm emissions from AlGaN-based semiconductors. Jpn J Appl Phys. 2021;60(12):120501. doi: 10.35848/1347-4065/ac2f1e
- Kawakami Y, Narukawa Y, Sawada K, et al. The mechanism of radiative recombination in light-emitting devices composed on InGaN quantum wells. Electron Comm Jpn Pt II. 1998;81(7):45. doi: 10.1002/(SICI)1520-6432(199807)81:7<45:AID-ECJB6>3.0.CO;2-1
- Onuma T, Uchinuma Y, Suh EK, et al. Improved emission efficiency in InGaN/GaN quantum wells with compositionally-graded barriers studied by time-resolved photoluminescence spectroscopy. Jpn J Appl Phys. 2003;42(Part 2, No. 11B):L1369. doi: 10.1143/JJAP.42.L1369
- Okamoto K, Niki I, Scherer A, et al. Surface plasmon enhanced spontaneous emission rate of InGaN ∕ GaN quantum wells probed by time-resolved photoluminescence spectroscopy. Appl Phys Lett. 2005;87(7):071102. doi: 10.1063/1.2010602
- Liu L, Wang L, Liu N, et al. Investigation of the light emission properties and carrier dynamics in dual-wavelength InGaN/GaN multiple-quantum well light emitting diodes. J Appl Phys. 2012;112(8):083101. doi: 10.1063/1.4759373
- Kohno T, Sudo Y, Yamauchi M, et al. Internal quantum efficiency and nonradiative recombination rate in InGaN-based near-ultraviolet light-emitting diodes. Jpn J Appl Phys. 2012;51(7R):072102. doi: 10.1143/JJAP.51.072102
- Ngo TH, Gil B, Damilano B, et al. Photo-induced droop in blue to red light emitting InGaN/GaN single quantum wells structures. J Appl Phys. 2017;122(6):063103. doi: 10.1063/1.4997608
- Murotani H, Yamada Y, Honda Y, et al. Excitation density dependence of radiative and nonradiative recombination lifetimes in InGaN/GaN multiple quantum wells. Phys Status Solidi B. 2015;252(5):940. doi: 10.1002/pssb.201451491
- Boettcher T, Einfeldt S, Figge S, et al. The role of high-temperature island coalescence in the development of stresses in GaN films. Appl Phys Lett. 2001;78(14):1976. doi: 10.1063/1.1359780
- Shan H, Mei YJ, Wang N. Degradation in efficiency of InGaN/GaN multiquantum well solar cells with rising temperature. IEEE Trans Electron Devices. 2022;69(11):6195–10. doi: 10.1109/TED.2022.3208081
- Mion C, Muth JF, Preble EA, et al. Thermal conductivity, dislocation density and GaN device design. Superlattices Microstruct. 2006;40(4–6):338. doi: 10.1016/j.spmi.2006.07.017
- Cho YH, Gainer GH, Fischer AJ, et al. “S-shaped” temperature-dependent emission shift and carrier dynamics in InGaN/GaN multiple quantum wells. Appl Phys Lett. 1998;73(10):1370. doi: 10.1063/1.122164
- Cho HD, Yoon IH, Yuldashev SU, et al. Electroluminescence in a rectifying graphene/InGaN junction. RSC Adv. 2017;7:50853. doi: 10.1039/C7RA10672F
- Yamaguchi T, Ariga K, Mori K, et al. Excitation wavelength dependence of temperature-induced photoluminescence quenching in InGaN quantum wells. IEICE Technical Report. 2020;120:5. (conference abstract, in Japanese).
- Dai Q, Shan Q, Wang J, et al. Carrier recombination mechanisms and efficiency droop in GaInN/GaN light-emitting diodes. Appl Phys Lett. 2010;97(13):133507. doi: 10.1063/1.3493654
- Karpov SY. ABC-Model for interpretation of internal quantum efficiency and its droop in III-Nitride LEDs: a review. Opt Quantum Electron. 2015;47(6):1293. doi: 10.1007/s11082-014-0042-9
- Olivier F, Daami A, Licitra C, et al. Shockley-read-hall and auger non-radiative recombination in GaN based LEDs: a size effect study. Appl Phys Lett. 2017;111(2):022104. doi: 10.1063/1.4993741
- David A, Young NG, Hurni CA, et al. Quantum efficiency of III-Nitride emitters: evidence for defect-assisted nonradiative recombination and its effect on the green gap. Phys Rev Appl. 2019;11(3):031001. doi: 10.1103/PhysRevApplied.11.031001
- Manabe H, Goto H, Sunakawa H, et al. Direct verification of commonly-used rate-equation Model in III-Nitride material by detailed analysis of photoluminescence decay curves. San Francisco, California: SPIE Photonics West; 2014 Feb 1-6.
- Kawakami Y, Inoue K, Kaneta A, et al. Quantification of the internal quantum efficiency in GaN via analysis of the heat generated by non-radiative recombination processes. J Appl Phys. 2015;117(10):105702. doi: 10.1063/1.4914413
- Kojima K, Ohtomo T, Ikemura K. Determination of absolute value of quantum efficiency of radiation in high quality GaN single crystals using an integrating sphere. J Appl Phys. 2016;120(1):015704. doi: 10.1063/1.4955139
- Usami S, Honda Y, Amano H. Photocurrent and photoluminescence measurements for InGaN based LED. Yokohama, Japan: LEDIA’17 LDC’17; [2017 Apr 18-21].
- Halsall MP, Crowe IF, Mullins J, et al. Photomodulated reflectivity measurement of free-carrier dynamics in InGaN/GaN quantum wells. ACS Photonics. 2018;5(11):4437. doi: 10.1021/acsphotonics.8b00904
- Shim JI, Shin DS. Measuring the internal quantum efficiency of light-emitting diodes: towards accurate and reliable room-temperature characterization. Nanophotonics. 2018;7(10):1601. doi: 10.1515/nanoph-2018-0094
- Murotani H, Shibuya K, Yoneda A, et al. Analysis of efficiency curves in near-UV, blue, and green-emitting InGaN-based multiple quantum wells using rate equations of exciton recombination. Jpn J Appl Phys. 2019;58(SC):SCCB02. doi: 10.7567/1347-4065/ab040b
- Mi C, Wang L, Jin J, et al. Estimating internal quantum efficiency of light-emitting diodes from current–voltage curves. Appl Phys Express. 2019;12(3):032002. doi: 10.7567/1882-0786/aafb57
- Nakano T, Kawakami K, Yamaguchi AA. Determination of internal quantum efficiency in GaN by simultaneous measurements of photoluminescence and photo-acoustic signals. Proc Of SPIE. 2016;9748:97481W–974811.
- Yamaguchi AA, Kawakami K, Shimizu N, et al. A novel method to measure absolute internal quantum efficiency in III-Nitride semiconductors by simultaneous photo-acoustic and photoluminescence spectroscopy. IEICE Trans Electron. 2018;E101.C(7):527. doi: 10.1587/transele.E101.C.527
- Dunstan DJ. On the measurement of absolute radiative and non-radiative recombination efficiencies in semiconductor lasers. J Phys D Appl Phys. 1992;25(12):1825. doi: 10.1088/0022-3727/25/12/020
- Kawakami K, Nakano T, Yamaguchi AA. Analysis of radiative and non-radiative lifetimes in GaN using accurate internal-quantum-efficiency values estimated by simultaneous photoluminescence and photo-acoustic measurements. Proc of SPIE. 2016;9748:97480S–974801.
- Bell AG. Upon the production of sound by radiant energy. Am J Sci. 1880;20(118):305. doi: 10.2475/ajs.s3-20.118.305
- Rosencwaig A, Gersho A. Theory of the photoacoustic effect with solids. J Appl Phys. 1976;47(1):64. doi: 10.1063/1.322296
- Haller C, Carlin JF, Jacopin G, et al. GaN surface as the source of non-radiative defects in InGaN/GaN quantum wells. Appl Phys Lett. 2020;113(11):111106. doi: 10.1063/1.5048010
- Haller C, Carlin JF, Mosca M, et al. InAlN underlayer for near ultraviolet InGaN based light emitting diodes. Appl Phys Express. 2019;12(3):034002. doi: 10.7567/1882-0786/ab0147
- Badcock TJ, Ali M, Zhu T, et al. Radiative recombination mechanisms in polar and non-polar InGaN/GaN quantum well LED structures. Appl Phys Lett. 2016;109(15):151110. doi: 10.1063/1.4964842
- Rashidi A, Monavarian M, Aragon A, et al. Thermal and efficiency droop in InGaN/GaN light-emitting diodes: decoupling multiphysics effects using temperature-dependent RF measurements. Sci Rep. 2019;9(1):19921. doi: 10.1038/s41598-019-56390-2
- Sari E, Nizamoglu S, Lee IH, et al. Electric field dependent radiative decay kinetics of polar InGaN/GaN quantum heterostructures at low fields. Appl Phys Lett. 2009;94(21):211107. doi: 10.1063/1.3142386
- Langer T, Chernikov A, Kalincev D, et al. Room temperature excitonic recombination in GaInN/GaN quantum wells. Appl Phys Lett. 2013;103(20):202106. doi: 10.1063/1.4830366
- Han DP, Lee GW, Min S, et al. Identifying the cause of thermal droop in GaInN‑based LEDs by carrier‑ and thermo‑dynamics analysis. Sci Rep. 2020;10(1):17433. doi: 10.1038/s41598-020-74585-w