
ABSTRACT
DRAM1 is an infection inducible autophagy modulator, previously shown to promote autophagic and lysosomal defense responses against the intracellular pathogen Mycobacterium marinum. However, its possible role in other anti-bacterial autophagic mechanisms remains unknown. Recently, LC3-associated phagocytosis (LAP) has emerged as autophagy-related mechanism that targets bacteria directly in phagosomes. Our previous work established LAP as the main autophagic mechanism by which macrophages restrict growth of Salmonella Typhimurium in a systemically infected zebrafish host. We therefore employed this infection model to investigate the possible role of Dram1 in LAP. Morpholino knockdown or CRISPR/Cas9-mediated mutation of Dram1 led to reduced host survival and increased bacterial burden during S. Typhimurium infection. In contrast, overexpression of dram1 by mRNA injection curtailed Salmonella replication and reduced mortality of the infected host. During the early response to infection, GFP-Lc3-Salmonella associations were reduced in dram1 knockdown or mutant embryos, and increased by dram1 overexpression. Since LAP is known to require the activity of the phagosomal NADPH oxidase, we used a Salmonella biosensor strain to detect bacterial exposure to reactive oxygen species (ROS) and found that the ROS response was largely abolished with deficiency of dram1, while it was increased with dram1 overexpression. Corroborating these results in a mammalian model, the LC3 and ROS responses to Salmonella were similarly reduced or increased by knockdown or overexpression of Dram1, respectively, in murine RAW264.7 macrophages. Together, these results demonstrate the host protective role of Dram1/DRAM1 during S. Typhimurium infection and suggest a functional link between Dram1/DRAM1 and the induction of LAP.
Abbreviations: ATG8: Autophagy related protein 8; ATG16: Autophagy related protein 16; CFU: colony-forming unit; DRAM1: DNA damage regulated autophagy modulator gene 1; dpf: days post fertilization; GFP: green fluorescent protein; hpi: hours post infection; LAP: LC3 associated phagocytosis; LC3, microtubule-associated protein 1 light chain 3; NADPH: Nicotinamide dinucleotide phosphate; p53: Tumor suppressor protein 53: ROS; reactive oxygen species; S. Typhimurium: Salmonella enterica serovar Typhimurium; TIPTP: 2(tetrahydroindazolyl) phenoxy-N-(thiadiazolyl)propenamide 2; UVRAG: UV radiation resistance associated protein
Introduction
Macroautophagy/autophagy has long been known as a fundamental housekeeping process wherein dysfunctional cellular components are captured inside double membrane vesicles that fuse with lysosomes to degrade and recycle the contents [Citation1, Citation2]. More recently, autophagy has also been recognized as an integral part of the immune system, functioning not only as a direct anti-microbial mechanism but also contributing to regulation of the immune response [Citation3]. Autophagy can function as a non-specific bulk process or as a selective mechanism mediated by receptors that recognize molecular degradation signals like ubiquitin [Citation4]. The selective autophagy of invading microbes, referred to as xenophagy, is an innate immune effector mechanism targeting invading microbes either when present inside membrane-bound compartments or when they escape into the host cytosol [Citation5]. Xenophagy and other autophagy-related processes have been shown as an important mechanism for resistance to infections, but pathogens have evolved various mechanisms to subvert these defenses [Citation5-9].
A hallmark of all forms of autophagy is the conjugation of autophagy related protein 8 (ATG8) family proteins, including microtubule-associated protein 1 light chain 3 (MAP1LC3, hereafter LC3), with phospholipids on the autophagosomal double membrane structures [Citation10]. However, LC3 can also be recruited to vesicles with a single membrane, a process named Conjugation of ATG8 to endolysosomal Single Membranes (CASM) [Citation11, Citation12]. One example of CASM is LC3-associated phagocytosis (LAP), where LC3 is recruited to phagosomes, thereby forming LAPosomes [Citation13-15]. In LAP, the class III phosphatidylinositol 3-kinase (PI3KC3) complex (containing run domain Beclin-1-interacting and cysteine-rich domain-containing protein (Rubicon/RUBCN) and UV radiation resistance associated protein (UVRAG)) generates and delivers phosphatidyl-inositol 3-phosphate (PI(3)P) onto the phagosomal membrane and interacts with ATG16L1 to initiate LC3 conjugation [Citation16-18]. Rubicon is an essential positive regulator of LAP, but is dispensable for other forms of CASM and has a negative regulatory role in canonical autophagy [Citation17, Citation19]. A hallmark of LAP is the production of reactive oxygens species (ROS) by the NADPH oxidase 2 complex (NOX2), which precedes LC3 recruitment. ROS play an essential role in LAPosome maturation. Specifically, ROS has been shown to inactivate ATG4B, thereby inhibiting the proteolytic release of LC3 and stabilizing the LAPosome [Citation20]. Furthermore, production of ROS by NOX2 consumes H+ and thus causes a higher pH in the phagosome, which is necessary for V-ATPase assembly: the critical regulating step that drives ATG16L recruitment and LC3 conjugation, not only in LAP but in all other forms of CASM [Citation16, Citation19]. Similar to xenophagy, LAP has been implicated in the host response to a wide variety of pathogens [Citation16].
There are various ways in which autophagy-dependent mechanisms can be induced in response to internal and external stress factors, such as nutrient restriction, DNA damage, and microbial invaders. One factor implicated in the activation of autophagy is DNA damage regulated autophagy modulator gene 1 (DRAM1), which encodes a member of an evolutionary conserved family of six transmembrane proteins [Citation21]. DRAM1 was first reported as direct target gene of the tumor suppressor protein p53 and shown to play a role in p53-mediated autophagy and apoptosis [Citation22]. DRAM1 has been implicated in several types of cancers [Citation23-25]. Overexpression of DRAM1 has been shown to increase basal levels of autophagosome numbers, indicating that DRAM1 can act early in the autophagy process, contributing to autophagosome formation [Citation21]. However, the DRAM1 protein predominantly localizes to lysosomes and there is also an evidence for its functions at later steps in the process, showing that DRAM1 enhances autophagic flux and promotes ATPase activity and lysosomal acidification [Citation26, Citation27]. DRAM1 is thought to mediate crosstalk between autophagy and apoptosis by interacting with the proapoptotic protein BAX [Citation28]. Furthermore, in an autophagy-independent manner, DRAM1 interacts with transporter proteins to promote lysosomal amino acid efflux, which activates the nutrient-sensing complex mTORC1 [Citation29]. Other molecular interactions of DRAM1 that could explain its mode of action at early as well as late steps of the autophagy pathway remain to be elucidated.
In addition to DNA damage, DRAM1 is induced by infection [Citation30, Citation31]. In HIV-infected T-cells, DRAM1 has been shown to function downstream of p53, triggering lysosomal membrane permeabilization and cell death [Citation30]. In contrast, we have shown that the induction of DRAM1 in macrophages infected with Mycobacterium tuberculosis is independent of p53 and mediated instead by transcription factor NFκB, which functions downstream of pathogen recognition by Toll-like receptor (TLR) signaling [Citation31]. Similarly, induction of the zebrafish homolog of DRAM1 (dram1) by Mycobacterium marinum infection relies on the TLR adaptor molecule MyD88 [Citation31]. M. marinum-infected zebrafish embryos develop a tuberculosis-like disease and we have shown that Dram1 plays a host protective role in this model [Citation31-33]. Failing to contain the intracellular infection, macrophages in dram1-/- zebrafish succumbed to pyroptotic cell death [Citation32]. Likewise, Dram1 knockdown in murine RAW264.7 macrophages led to increased cell death of infected macrophages and increased M. marinum growth. Both in zebrafish and in murine RAW264.7 macrophages, we found that deficiency of dram1/Dram1 not only reduces the co-localization of Lc3/LC3 with M. marinum but also markedly reduces the acidification of M. marinum-containing vesicles [Citation33].
Based on its host-protective role in M. marinum infection, we hypothesize that Dram1/DRAM1 also confers protection against other intracellular pathogens targeted by autophagic processes, not limited to xenophagy but also including LAP. Therefore, in the present study we sought to investigate the role of Dram1/DRAM1 in host defense against Salmonella enterica serovar Typhimurium (S. Typhimurium). A zebrafish model for S. Typhimurium infection has previously been established and dram1 expression is inducible following intravenous injection of the pathogen in this model [Citation34, Citation35]. In our recent work, we have shown that LAP is the main autophagic process targeting S. Typhimurium following phagocytosis of the pathogen by macrophages in the zebrafish host [Citation36]. Inhibition of LAP, by knockdown of factors specific for this process (Rubicon and NADPH oxidase), impaired host resistance [Citation36, Citation37]. Here, we demonstrate that Dram1/DRAM1 is required for host resistance to S. Typhimurium infection and promotes the LAP-associated ROS response to this pathogen both in the zebrafish host and in mammalian macrophages.
Results
Knockdown and overexpression of dram1 indicates its function in zebrafish host defense against Salmonella infection
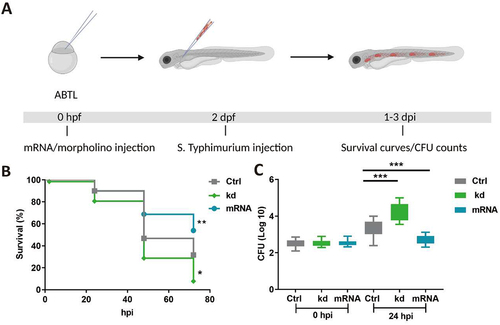
In order to investigate the role of Dram1 during Salmonella infections we modulated levels of dram1 either by knockdown using a splice blocking morpholino or by overexpression through mRNA injection at the 1-2-cell stage of zebrafish embryos. We challenged the host at 2 days post fertilization (dpf) with S. Typhimurium by intravenous injection and recorded progression of the resulting infection by survival curves and colony-forming unit (CFU) determination (). We found that dram1 knockdown resulted in hypersusceptibility to Salmonella infection, where at 48 hours post infection (hpi) nearly 74 % of hosts succumbed to S. Typhimurium infection in significant contrast to 54 % of mortality in control hosts (). Moreover, only 4 % of dram1-deprived hosts were alive at 72 hpi compared to 29 % of the control group (). Additionally, under knockdown conditions of dram1, infected hosts contained significantly higher S. Typhimurium bacterial counts at 24 hpi (). Conversely, the overexpression of dram1 by mRNA injection resulted in higher survival rates () and lower numbers of S. Typhimurium bacteria at 24 hpi (). These results indicate that Dram1 restricts Salmonella infection in the host.
Figure 1. Dram1 is required for effective host defense during Salmonella infections in zebrafish. (A) Workflow of experiments followed in B&C along with the timeline of developing embryos. (B) Survival curves of embryos with S. Typhimurium infection expressing different levels of dram1. Control embryos were compared to dram1 knockdown (kd) and overexpressing (mRNA) groups, and survival curves show the data from three independent experiments (n=150 embryos/group). (C) CFU counts for infected embryo groups in B. The log transformed CFU data from three independent experiments are shown with the geometric mean per time point (n=15 embryos/group). Error bars represent SD. Statistical significance of survival curves data is assessed by Cox proportional hazards model with log rank test, and pairwise comparison with Dunnett correction. Statistical significance of CFU counts data is analyzed by one-way ANOVA and pairwise comparison with Dunnett correction. (*p<0.05; **p<0.01; ***p<0.001).
Dram1 is required for the Lc3 response of the zebrafish host that targets Salmonella phagocytosed by macrophages
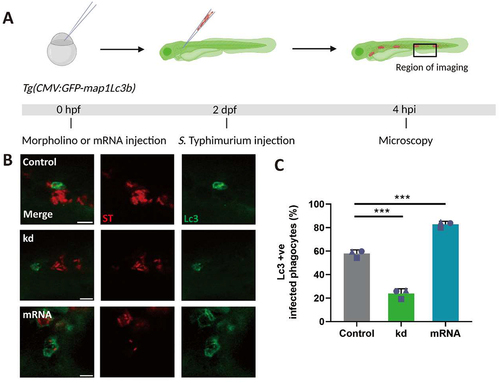
We have previously shown that the autophagy response of macrophages towards Salmonella in our model occurs mainly as LAP [Citation36]. To study whether Dram1 contributes to the Lc3 targeting of Salmonella, we injected dram1 morpholino into embryos of the Tg(CMV:GFP-maplc3b1) line (hereafter referred to as GFP-Lc3) and infected these with mCherry-expressing S. Typhimurium (). We observed that GFP-Lc3 associations with Salmonella cells were significantly Dram1 dependent, since morpholino knockdown resulted in more than two-fold reduction of GFP-Lc3-positive infected phagocytes (). Thus, the increased susceptibility of dram1 knockdown embryos () is associated with diminished levels of Lc3-Salmonella associations. Next, we investigated if the positive effect of mRNA-mediated dram1 overexpression on restricting infection () is accompanied by an increased Lc3 response towards the pathogen. Indeed, infection of control and dram1 overexpressing GFP-Lc3 embryos showed a significant increase of GFP-Lc3 associations with S. Typhimurium bacterial cells in the overexpression group (). These results lead us to propose that Dram1 promotes the LAP response during Salmonella infections, resulting in a more effective host defense.
Figure 2. Dram1 promotes GFP-Lc3 associations with Salmonella in macrophages of the zebrafish. (A) Workflow and timeline of experiments in B-C. (B) Representative confocal micrographs of Tg(CMV:GFP-maplc3b1) embryos from dram1 knockdown, overexpression and control groups infected with mCherry-expressing S. Typhimurium (ST) at 4 hpi. Scale bar = 5μm (C) Quantification of GFP-Lc3-Salmonella associations at 4 hpi. Error bars represent SD. The bar graph shows the data from three independent experiments, where the mean of each replicate is indicated with a different symbol (n= 15 embryos/group). Statistical significance is analyzed by one-way ANOVA and pairwise comparison with Dunnett correction. (***p<0.001).
Mutation of dram1 in zebrafish recapitulates the infection phenotype of dram1 morpholino-induced knockdown
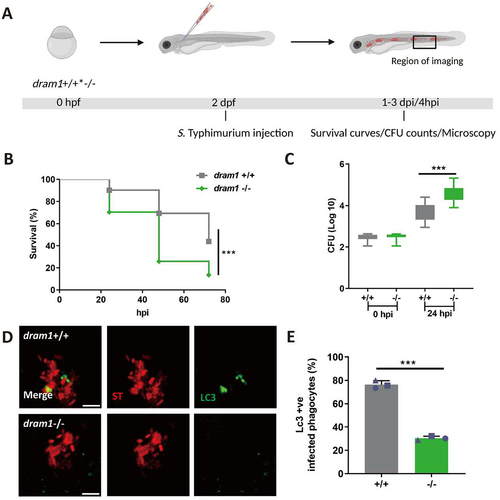
In order to verify the results obtained using morpholino-mediated knockdown, we studied S. Typhimurium infection in a previously established dram1 mutant line [Citation32]. We infected dram1 -/- and dram1 +/+ embryos with S. Typhimurium () and observed that dram1-/- hosts showed increased mortality during S. Typhimurium infection as compared to dram1+/+ controls (). Bacterial growth determination confirmed the Salmonella-restricting role of Dram1 as significantly higher bacterial counts were retrieved from dram1-/- embryos at 24 hpi as compared to dram1+/+ embryos (). The dram1 mutants were subsequently tested for Lc3 targeting of Salmonella. We observed significantly less GFP-Lc3 associations with Salmonella cells in dram1-/- embryos compared to dram1+/+ embryos (), further confirming our initial observations using morpholino knockdown. The consistent results obtained in Dram1-deficient hosts achieved by knockdown or stable mutation support the function of Dram1 in LAP-mediated host defense during Salmonella infections.
Figure 3. GFP-Lc3 recruitment to Salmonella is impaired in dram1 mutants in zebrafish. (A) Workflow and timeline of experiments in B-E. (B) Survival curves of dram1+/+ and dram1-/- embryos infected with S. Typhimurium (n=150 embryos/group from three independent experiment). (C) CFU counts recovered from dram1 +/+ and dram1 - /- infected individuals (n=15 embryos/group from 3 three independent experiments). (D) Representative confocal micrographs of GFP-Lc3-Salmonella associations in dram1+/+ (D) and dram1-/- (E) embryos in Tg(CMV:GFP-maplc3b1) background. Scale bar = 5 μm (E) Quantification of GFP-Lc3-Salmonella associations in dram1+/+ and dram1 -/- embryos (n= 15 embryos/group). The bar graph shows the data from three independent experiments, where the mean of each replicate is indicated with a different symbol. Error bars represent SD. Statistical significance of survival curves data is assessed by Cox proportional hazards model with log rank test. Statistical significance of CFU counts and GFP-Lc3-Salmonella associations data is analyzed by unpaired t-test. ***p<0.001).
Dram1 is required for the phagocyte ROS response associated with LAP in infected zebrafish
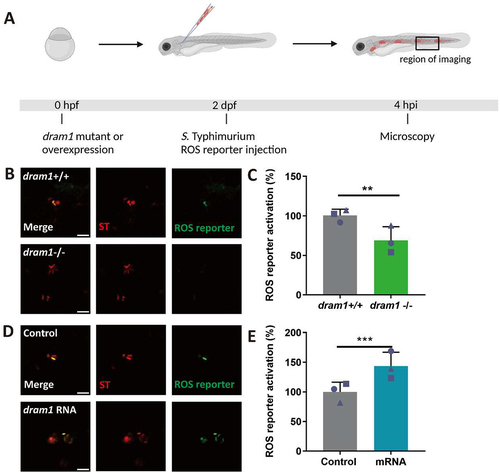
LAP has been shown to depend strictly on NADPH oxidase and Rubicon-mediated generation of ROS [Citation14]. To confirm that zebrafish macrophages mount a LAP response towards S. Typhimurium we adopted a pharmacological approach where we used a chemical inhibitor, 2-(tetrahydroindazolyl) phenoxy-N-(thiadiazolyl)propanamide (TIPTP), which interferes with the interaction between NADPH oxidase and Rubicon [Citation38]. First, we verified that TIPTP did not affect S. Typhimurium growth (Fig S1). Next, to analyze the effect of TIPTP during infection we utilized an S. Typhimurium ROS biosensor strain that contains a constitutively expressed mCherry reporter and a GFP reporter that is activated when bacterial cells are exposed to ROS [Citation39] (). We have previously shown that the activation of this ROS biosensor is strictly dependent on the expression of Rubicon and the NADPH oxidase component Cyba, demonstrating that this biosensor is a reliable indicator of the occurrence of LAP [Citation36]. We found that activation of the ROS biosensor was strongly reduced in the presence of TIPTP, providing further evidence that the bacterial ROS response requires the activity of the LAP factors, NADPH oxidase and Rubicon (). Next, to study the link between Dram1 and the LAP response to S. Typhimurium, we determined the effect of Dram1 deficiency on the ROS biosensor strain (). We observed that activation of the ROS biosensor was reduced in dram1-/- hosts compared to dram1+/+ individuals (). Furthermore, overexpression of dram1, by means of mRNA injection (Fig S2), increased activation of the ROS biosensor (). Together, our results demonstrate that Dram1 is required for both GFP-Lc3 recruitment and ROS generation in infected phagocytes of the zebrafish host, consistent with the proposed role of Dram1 in the LAP response to Salmonella.
Figure 4. ROS generation is inhibited by TIPTP in zebrafish. (A) Workflow and timeline of experiments in B-C. (B) Representative micrographs for control and TIPTP-treated embryos infected with a Salmonella biosensor strain for ROS. Images were taken at 4 hpi. Scale bar = 10 μm (C) Quantification of the ROS reporter activation (GFP intensity compared to constitutive mCherry intensity). The bar graph shows the data from three independent experiments, where the mean of each replicate is indicated with a different shape. (n=15 embryos per group). Statistical significance is analyzed by unpaired t-test. (**p<0.01). Error bars represent the SD.
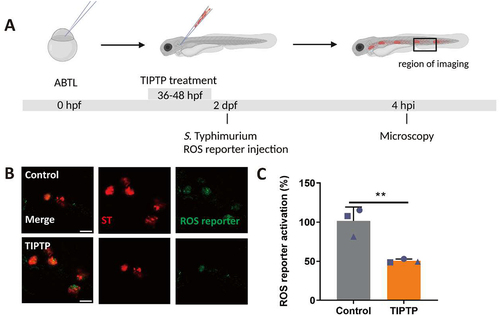
Figure 5. ROS generation is mediated by Dram1 during Salmonella infection in the zebrafish model. (A) Workflow and timeline of experiments in B-E. (B). Representative micrographs for dram1+/+ and dram1-/- embryos infected with a Salmonella biosensor strain for ROS. Images were taken at 4 hpi. Scale bar = 5 μm (C) Quantification of the ROS reporter activation (GFP intensity compared to constitutive mCherry intensity) in dram1+/+ and dram1-/- embryos. (D) Representative micrographs for control and dram1 mRNA overexpression embryos, infected with a Salmonella biosensor strain for ROS. Scale bar = 10 μm (E) Quantification of the ROS reporter activation (GFP intensity compared to constitutive mCherry intensity) in control and dram1 mRNA overexpression embryos. Bar graphs show the data from three independent experiments, where the mean of each replicate is indicated with a different shape (n=15 embryos per group). Error bars represent the SD. Statistical significance is analyzed by is analyzed by unpaired t-test. (**p<0.01; ***p<0.001).
DRAM1 enhances the LAP response of murine macrophages to S. Typhimurium
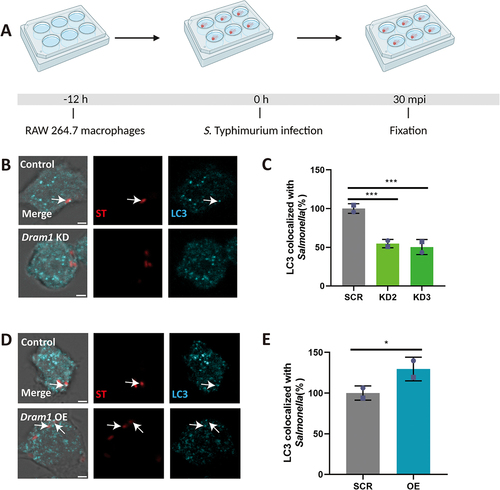
To determine if the LAP response to S. Typhimurium is shared between zebrafish and a mammalian model, we utilized the mouse RAW264.7 macrophage cell line. First, we incubated RAW264.7 macrophages with the LAP inhibitor, TIPTP, and subsequently infected the cells with S. Typhimurium expressing the ROS biosensor (). Activation of the ROS biosensor was reduced in presence of TIPTP (). In agreement, TIPTP also reduced LC3 immunostaining in S. Typhimurium-infected macrophages (). Next, we tested the effect of DRAM1 loss-and-gain-of-function (). Knockdown of DRAM1 using established shRNA lines (Fig S3) [Citation40] resulted in lower levels of ROS biosensor activation (), while overexpression of DRAM1 (Fig S4) led to higher ROS biosensor activity (). To confirm the effect of DRAM1 on ROS production by LAP, we then utilized isoluminol, a cell-impermeable chemiluminescent chemical, which makes it possible to detect exclusively the ROS that is produced in the lumen of vesicles derived from endocytosis and phagocytosis [Citation41]. We found that similar to the results obtained with the ROS biosensor strain, knockdown of DRAM1 produced less ROS, and overexpression of DRAM1 increased ROS production after infection (). As a control, the different cell lines produced similar levels of ROS after stimulation by PMA () or under non-infected conditions (Fig S5). In agreement, LC3 association with Salmonella () was reduced in the DRAM1 knockdown cells () and increased with overexpression of DRAM1 (). In conclusion, RAW246.7 macrophages target S. Typhimurium similarly by LAP as macrophages in the zebrafish host, and this response is stimulated by DRAM1/Dram1 in both systems.
Figure 6. ROS generation and LC3 associations with Salmonella are inhibited by TIPTP in RAW264.7 macrophages. (A) Workflow and timeline of experiments (B). Representative micrographs for control and TIPTP-treated cells infected with a Salmonella biosensor strain for ROS. Scale bar = 2 μm (C) Quantification of the ROS reporter activation (GFP intensity compared to constitutive mCherry intensity). (D) Representative confocal micrographs of LC3 immunostaining associated with mCherry-expressing S. Typhimurium. Scale bar = 2 μm (E) Quantification of LC3-Salmonella associations. Bar graphs show the data from two independent LC3 immunostaining experiments, where the mean of each replicate is indicated with a different symbol (n=24 regions of interest per group). Statistical significance is analyzed by one-way ANOVA and pairwise comparison with Dunnett correction. (**p<0.01; ***p<0.001). Error bars represent the SD.
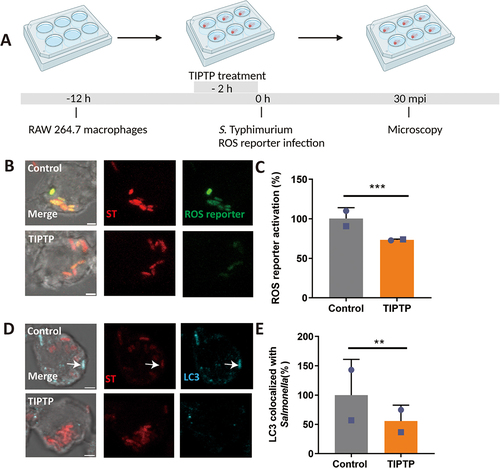
Figure 7. DRAM1 promotes ROS generation during Salmonella infection in RAW264.7 macrophages. (A) Workflow and timeline of experiments (B) Representative micrographs for Dram1 control and knockdown (KD) cells, infected with a Salmonella biosensor strain for ROS. Scale bar = 2 μm (C) Quantification of the ROS reporter activation (GFP intensity compared to constitutive mCherry intensity) in Dram1 control and knockdown (KD) cells. (D) Representative micrographs for Dram1 control and overexpression (OE) cells infected with a Salmonella biosensor strain for ROS. Scale bar = 2 μm (E) Quantification of the ROS reporter activation (GFP intensity compared to constitutive mCherry intensity) in Dram1 control and overexpression (OE) cells. Bar graphs show the data from two independent experiments, where the mean of each replicate is indicated with a different symbol (n=24 regions of interest per group). (F-G) Isoluminol measurement of ROS production in Dram1 knockdown, overexpression, and control cells after infection (F) or stimulation with PMA (G). Graphs show the data from one replicate out of two independent experiments. Statistical significance is analyzed by one-way ANOVA and pairwise comparison with Dunnett correction. *p<0.05, **p<0.01; ***p<0.001). Error bars represent the SD.
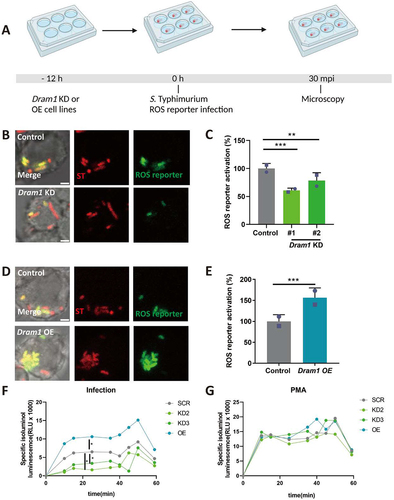
Figure 8. DRAM1 increases LC3 associations with Salmonella in RAW264.7 macrophages. (A) Workflow and timeline of experiments (B). Representative micrographs of LC3 immunostaining associated with mCherry-expressing S. Typhimurium in Dram1 knockdown cells infected with a Salmonella. Scale bar = 2 μm (C) Quantification of LC3-Salmonella associations. (D) Representative confocal micrographs of LC3 immunostaining associated with mCherry-expressing S. Typhimurium in control and in Dram1 overexpression cells . Scale bar = 2 μm (E) Quantification of LC3-Salmonella associations. Bar graphs show the data from two independent LC3 immunostaining experiments, where the mean of each replicate is indicated with a different symbol (n=24 regions of interest per group). Statistical significance is analyzed by one-way ANOVA and pairwise comparison with Dunnett correction. (*p<0.05; **p<0.01; ***p<0.001). Error bars represent the SD.
Discussion
In this study, we have used zebrafish and murine RAW264.7 macrophage infection models to demonstrate that the autophagy modulator Dram1/DRAM1 promotes host resistance to Salmonella infection. This work extends our previous finding that Dram1 mediates autophagic host defense during mycobacterial infection in the zebrafish tuberculosis model and in murine macrophages. Importantly, our study implicates Dram1/DRAM1 in an infection context where LAP is the predominant autophagic host defense response.
S. Typhimurium is vulnerable to both xenophagy and LAP, and employs its virulence factor SopF to suppress both these host pathways [Citation19, Citation42]. In the zebrafish infection model, macrophages target S. Typhimurium almost exclusively by LAP [Citation36]. Depletion of essential LAP factors, including Rubicon and the NADPH oxidase component Cyba, abolishes GFP-Lc3 association with S. Typhimurium and prevents activation of a bacterial ROS biosensor gene [Citation36]. In the present study, we used a chemical approach to strengthen the previous genetic evidence for LAP and utilized TIPTP to interrupt the NADPH oxidase-Rubicon axis [Citation38]. Consistent with the involvement of LAP, we detected less activation of the bacterial ROS biosensor in both zebrafish and RAW 264.7 macrophages upon treatment with TIPTP. The ability of RAW264.7 macrophages to respond to bacterial infections by LAP is in line with previous infection studies with Escherichia coli and Burkholderia pseudomallei [Citation13, Citation43]. Furthermore, the LAP response to S. Typhimurium has been confirmed in human cells [Citation19]. DRAM1 has been shown to promote autophagy and autophagic flux, but has not previously been implicated in LAP [Citation22, Citation26]. Here, we show that the LAP-associated ROS response is inhibited by knockdown or mutation of dram1/DRAM1 in zebrafish and murine macrophages, suggesting that Dram1/DRAM1 is required for the targeting of S. Typhimurium by LAP. This Dram1/DRAM1-mediated process is host-protective, since we found that dram1-deficient zebrafish embryos are more susceptible to S. Typhimurium infection and that dram1 overexpression promotes host resistance.
The molecular mechanism by which Dram1/DRAM1 promotes autophagic processes is currently unknown. Our data show that Dram1/DRAM1 is required not only for Lc3/LC3 recruitment but also for the ROS response in phagosomes. This suggests that Dram1/DRAM1 functions upstream of Rubicon, which has been shown to stabilize the NADPH oxidase. An attractive hypothesis is that Dram1/DRAM1 interacts directly with components of the Beclin1-VPS34-UVRAG-Rubicon complex to promote the association of Rubicon with phagosomes. This hypothesis is consistent with a recent study on a member of the human DRAM family, DRAM2, which has been shown to stimulate autophagy by disrupting the association of Rubicon with the Beclin1/UVRAG complex [Citation44]. The displacement of Rubicon relieves its inhibitory function from this complex and thereby promotes the activity of the class III phosphatidylinositol 3-kinase, VPS34, which is required for autophagosome formation and maturation. If Dram1/DRAM1 functions by a similar mechanism in the response to Salmonella infection, disruption of the Rubicon-Beclin1/Uvrag interaction would liberate Rubicon to associate with the Salmonella-containing phagosomes. This hypothesis would explain how Dram1/DRAM1 is able to stimulate autophagy and LAP at the same time. Another attractive hypothesis is that Dram1/DRAM1 stimulates the maturation of autophagosomes and LAPosomes by associating with lysosomal proteins, such as LAMP1 and LAMP2, similar to DRAM2 [Citation44]. Lysosomal markers, including LAMP1, Rab7a and V-ATPase, have been found to associate with phagosomes prior to LC3 recruitment and acidification [Citation19]. Furthermore, the V-ATPase has been identified as a universal driver of LAP and other forms of CASM by recruiting ATG16L, a function that is separate from its subsequent role in driving acidification [Citation19]. Therefore, the current view on LAP/CASM activation supports a model whereby DRAM1 may associate with lysosomal factors both before and after LC3 recruitment, allowing it to promote LAP initiation as well as LAPosome maturation. This is consistent with previous studies implicating DRAM1 in vesicle fusion and maturation during canonical autophagy [Citation26, Citation27, Citation40, Citation45].
In addition to promoting LAP, it is likely that the activity of Dram1/DRAM1 can enhance other autophagic mechanisms against intracellular Salmonella, including the selective autophagy process that is mediated by ubiquitin receptors. Selective autophagy has been shown to function as an important defense mechanism against Salmonella in epithelial cells, which this pathogen enters by active invasion [Citation46]. Selective autophagy specifically targets cytosolic bacteria or detects membrane damage on the bacterial replication niche. In both zebrafish and RAW264.7 macrophages, we have shown that this response is elicited by the escape of M. marinum from phagosomes [Citation31, Citation40]. The above proposed interaction of Dram1/DRAM1 with Rubicon is consistent with positive effects on selective autophagy as well as LAP. In addition, the microbicidal capacity of Lc3/LC3-marked bacterial compartments might be enhanced by Dram1/DRAM1 activity, regardless of whether these compartments are of autophagosomal or phagosomal origin. This could be facilitated by delivery of ubiquitinated antimicrobial peptides through fusion with autophagosomes, which are present in increased numbers when Dram1 is overexpressed [Citation31, Citation47].
Different members of the DRAM family might have partially overlapping functions in host defense. In addition to a single copy of dram1, the zebrafish has two copies of the gene for Dram2, dram2a and dram2b. Based on our RNA sequencing data of leukocyte populations sorted from zebrafish larvae, dram1 is the most abundantly expressed gene in macrophages, while the expression level of dram2b is at least 10-fold lower and dram2a is not detectably expressed [Citation48]. Furthermore, we have only found expression of dram1 to be inducible by infection [Citation35, Citation49]. Our study did not provide any indication that other members of the zebrafish Dram family might be involved in LAP, since mutation of dram1 abolished ROS biosensor activation in the Salmonella-containing phagosomes almost completely. However, the possible role of Dram2a/b in zebrafish host defense requires further investigation in the light of the recent report that Mycobacterium tuberculosis evades autophagy by inducing the expression of microRNAs (miR144* and miR-125b-5p) that target human DRAM2 [Citation50]. This study has revealed that DRAM2 enhances antimicrobial activity in human monocyte derived macrophages, similar to the functions that we have shown for mouse DRAM1 in M. marinum-infected mouse macrophages and for zebrafish Dram1 during in vivo infections with M. marinum and S. Typhimurium [Citation32, Citation40]. Therefore, accumulating evidence positions the members of the DRAM family as key players in autophagic defense against intracellular pathogens and it will be of great interest to further explore how these autophagy/LAP modulators might work in concert and how they could be therapeutically targeted.
Materials and methods
Zebrafish lines and maintenance
Zebrafish were handled in compliance with local animal welfare regulations and international guidelines specified by the EU Animal Protective Directive 2010/63/EU and maintained according to standard protocols (zfin.org). All studies were performed on embryos/larvae before the free feeding stage. Fish lines used for this study are AB/TL (a cross between wild type strains AB and Tuebingen Longfin; zfin.org), transgenic lines Tg(CMV:GFP-map1lc3b) and dram1-/- and dram1+/+ in Tg(CMV:GFP-map1lc3b) and Tg(mpeg1::mcherry-F)umsF°°1 backgrounds [Citation32]. Embryos from adult fish were handled and treated pre-infection and post infection as described [Citation36].
RAW264.7 macrophages culture
The mouse macrophage-like cell line RAW264.7 was maintained in high glucose Dulbecco’s modified Eagle’s medium (DMEM, Gibco, D6546) supplemented with 10% fetal calf serum (Gibco, F2442) and 1% GlutaMAX (Gibco, 35050061), at 37 °C under a humidified atmosphere of 95% air and 5% CO2.
Bacterial strains and infection experiments
S. Typhimurium SL1344 strains were used for this study, constitutively expressing mCherry or the mCherry marker in combination with a GFP biosensor for ROS (pkatGp-gfpOVA) [Citation39]. Culturing of bacteria, preparation of infection inocula and infection delivery were performed as described before [Citation36]. Briefly, bacteria were resuspended in PBS supplemented with 2% polyvinylpyrrolidone-40 to obtain the low dose (200-400 CFU, for survival curves and CFU counts experiments) or high dose (2000-4000 CFU, for imaging experiments). Bacterial inoculum was injected systemically into the caudal vein of 2 dpf anaesthetized embryos. Survival of infected embryos was recorded at 24 hour intervals. For infection of RAW264.7 macrophages, cells were infected with a multiplicity of infection of 10, and immediately centrifuged at 500 g for 10 min, as described in [Citation51], and subsequently incubated at 37°C for 30 min.
TIPTP experiments
The TIPTP inhibitor was synthesized and kindly provided by Dr. Sun-Joon Min and Dr. Chul-Su Yang [Citation38]. For use in zebrafish experiments, embryos were treated with 0.1 µM TIPTP diluted in egg water from 36 hpf to 48 hpf, then transferred to fresh egg water for S. Typhimurium injection. 4h after injection, fish were taken to confocal for imaging. For experiments with RAW264.7 macrophages, cells were treated with 10 µM TIPTP for 2 hours before infection. After 30 minute infection, cells were washed twice with PBS to remove extracellular bacteria and fixed with Pierce™ 4% formaldehyde for 15 minutes for imaging. To check the effect on S. Typhimurium growth in vitro, the bacteria were cultured overnight and diluted with LB medium to OD600 of 0.2, treated with 0, 0.01, 0.1, 1, 10, and 100 μ M of TIPTP, and OD600 was measured at different time points.
Determination of bacterial (CFU) counts in zebrafish
The CFU counts from infected zebrafish embryos were determined as described in [Citation36]. Briefly, homogenized infected embryos were serially diluted and plated out on solid media containing 90 µg/ml streptomycin, 50 µg/ml kanamycin and 100 µg/ml ampicillin to enumerate bacterial colonies.
Dram1 knockdown and overexpression experiments in zebrafish
Dram1 expression was altered by injecting 1 nl of a 0.1 mM solution of a previously described antisense morpholino MO1-dram1 (AAGGCTGGAAAACAAACGTACAGTA) or by injecting at a concentration of 100 pico grams of dram1 mRNA in 1 nl [Citation31].
DRAM1 knockdown and overexpression in macrophages
The shRNA knockdown of Dram1 in RAW264.7 macrophages has been previously described [Citation40]. In this study we used two independent knockdown lines, corresponding to lines KD2 and KD3 in our previous study [Citation40]. To generate Dram1 construct for overexpression, primers were designed with adaptors F: GCGGATCCGCCACCATGCTGTGCTTCCTCAGGGGAATGGCTTTCG; R: GCTCTAGATCAAAAGTCGTCATTGATTTCTGTGG for PCR using Dram1 ORF clone template (OriGene, MR220640). Amplified fragment was verified by gel electrophoresis and purified with GenElute Gel Extraction Kit (Sigma-Aldrich, SLBT 5695). Vector (pLenti CMV TO eGFP Puro, w159-1) was cut at the BamHI and Xbal restriction site and ligated with the Dram1 fragment by using T4 DNA ligase (NEB, M0202) . The ligated Dram1 plasmid was transformed to DH5α competent cells. Colonies were picked and transformation was verified by PCR and sanger sequencing. To generate lentiviral particles with a Dram1 overexpression construct, low passage HEK293T cells were seeded in a 25 cm2 culture flask one day prior to transfection. For assembly of lentiviral particles, virulent plasmid pMD2.G (Addgene, 12259), packing plasmid psPAX (Addgene, 12260) and transfer plasmid containing Dram1 were used at final concentrations of 0,72 pmol, 1,3 pmol and 1,64 pmol, respectively. The plasmids were mixed in 250 μL of DMEM without fetal calf serum (FCS; Gibco). Liposomal transfectant lipoD293 (Signagen, SL100668) was diluted in another 250 μL of DMEM without FCS. The plasmid mixture and diluted transfectant were then combined, mixed and incubated for 20 min. The liposomal complex was added dropwise to the medium of the HEK293T cells. Cells were incubated for 16 h to allow for efficient transfection. Next, the medium was replaced with 7 ml DMEM containing 25 µM HEPES and the culture was incubated for 2 days. Viral particles were then harvested through collection of the culture supernatant. Lentiviral supernatant was aliquoted and kept at -80°C prior to use. The day before transduction, 1x10⁶ low passage RAW 264.7 cells were seeded in 6 well plates in DMEM-high glucose with 10% FCS and incubated overnight at 37°C with 5% CO2. 24 h later, cells were transduced with Dram1-containing lentivirus supplemented with 8 µg/ml polybrene (Sigma-Aldrich, TR1003), and incubated at 37°C with 5% CO2. Medium was refreshed 24 h after transduction. After 48 h of transduction, 3 µg/ml puromycin (Gibco, A1113803) was added. Every 2-3 days, the medium was replaced until cells were 80-90% confluent. After around 7-10 days, all the non-transduction cells have died, and the puromycin-resistant were used for experiments. Dram1 overexpression in these cells was verified by qPCR analysis.
Quantitative PCR
qPCR was done according to the methods described by Banducci-Karp et al [Citation40]. Briefly, total RNA was extracted by TRIzol (Invitrogen, 15596018). 0.5 μg of total RNA was then transcribed as cDNA with iScript cDNA synthesis kit (Bio-Rad, 1708890). The mRNA expression level was determined by quantitative real-time PCR using iQSYBR Green Supermix (Bio-Rad, 1725271). For Raw264.7 macrophages, Dram1 primers used are as follows: forward: 5’-CCAGCTTCTTGGTCCGACG-3’, reverse: ‘5-GGGAGAAAGGGGTTGACGTG-3’. Gapdh was used as the housekeeping gene: forward: 5’- ATGGTGAAGGTCGGTGTGAA-3’, reverse: ‘5-CTGGAACATGTAGACCATGT -3’. For zebrafish, dram1 primers used are as follows: forward: 5’-GTGCCCCCTACTCTGAACAA-3’; reverse: 5’-GCGGTATCCGATCACACTCT-3’. tbp was used as the housekeeping gene: forward: 5’-CCTGCCCATTTTCAGTC-3’, reverse: 5’-TGTTGTTGCCTCTGTTGCTC-3’.
Western blotting
Cells were harvested, lysed by ultrasonication, and incubated with Laemmli SDS sample buffer (Thermo Fisher, J60015) at 37 °C for 10 min. Western blotting was performed using 10% polyacrylamide gels, followed by protein transfer to nitrocellulose membrane (Amersham Protran, GE10600001, Sigma-Aldrich). After the transfer, the membrane was placed in stripping buffer (2% SDS, 100 mM b-mercaptoethanol, and 62.5 mM Tris–HCl) at 55 °C for 15 min to expose the epitope. Membranes were then blocked with 3% BSA in 1× Tris-buffered saline (TBS) solution, with 0.1% Tween-20 (TBST), before incubating with primary and secondary antibodies: polyclonal anti-rabbit DRAM1 (1:1000) (Aviva systems biology, ARP47432- P050), β-actin (1:1000)(Cell Signaling, 4967S), as well as anti-rabbit IgG, and HRP-linked antibody (1:1000) (Cell Signaling, 7074S). Digital images were acquired using the Bio-Rad Universal Hood II imaging system (720BR/01565 UAS). Band intensities were quantified with densitometric analysis using Image Lab software and were normalized to β-actin as a loading control.
Immunofluorescence of RAW264.7 macrophages
Cells were fixed in 4% PFA for 15 min and after fixation, cells were permeabilized with 0.2% Saponin (Sigma-Aldrich, 47036) in PBS for 15 min, and then blocked with 3% bovine serum albumin (BSA) (Sigma-Aldrich, A4503) in PBS for 1 h at room temperature. Next, cells were incubated with the primary antibody LC3 (1:500) (Novus Biologicals, NB100-2331) for 1 hour at room temperature. Secondary antibody goat-anti-rabbit Alexa Fluor Plus 647 (1:1000) (Invitrogen, A-21245) was then added for detection of the primary antibodies. Prolong Gold Antifade Reagent (Invitrogen, P36966) was used for mounting onto glass slides. Between each step, cells were washed four times with PBS for 5 min each.
Quantification of ROS production by isoluminol
Cells were seeded the day before isoluminol measurement. Prior to the infection, the baseline signal was measured. The cells were then infected with Salmonella or stimulated with 1 ng/mL PMA (InvivoGen, 16561-29-8), and incubated with 50 mM isoluminol (TGI, A5300) and 3.2 U/mL horseradish peroxidase (Thermo Scientific, 31490) at 37 °C. Isoluminol luminescence was measured by Tecan Infinite M 1000 microplate reader.
Image acquisition and image analysis
Infected zebrafish embryos or RAW264.7 macrophages were fixed for image acquisitions to quantify GFP-Lc3-Salmonella associations and ROS biosensor activation. A 63x/40x water immersion objective (NA 1.3) with a Leica TCS SPE and SP8 confocal microscope system was used. When imaging zebrafish embryos, the selected region of interest was an area in the caudal hematopoietic tissue region in the ventral part of the tail, close to the site of injection. During imaging of RAW264.7 macrophages cultured on glass slides, regions of interest were randomly selected by navigating over the slides in a zig-zag pattern. GFP-Lc3-Salmonella associations were quantified by visual stack-by-stack inspection of the confocal Z-stack images. For ROS biosensor quantification, the intensity of the mCherry signal from S. Typhimurium was quantified as the area of infection using Image J. The mCherry signal was then used as a ‘mask’ to quantify the fluorescence intensity of the GFP signal, which represents ROS production. ROS activation was then determined by calculating the ratio between the intensity of the GFP signal and the intensity of the mCherry signal, in agreement with previous work [Citation52]. Max projections in the overlay channels were used for representative images.
Statistical analysis
All data sets were analyzed with Prism 8 software. Survival curves were analyzed with Log rank (Mantel-Cox) test. For CFU counts, data analysis was performed on Log-transformed data. Data of GFP-Lc3-positive infected phagocytes and ROS biosensor-positive phagocytes were analyzed with unpaired parametric t-test between two groups and for multiple groups the one-way ANOVA test was performed and corrected with Dunnett comparisons as indicated in figure legend.
Supplemental Material
Download ()Acknowledgements
We thank Dirk Bumann (University of Basel) for sharing of the Salmonella strains, Daniel Klionsky (University of Michigan) for the zebrafish transgenic line, Sander van Kasteren for RAW264.7 macrophages, and Sun-Joon Min and Chul-Su Yang (Hanyang University) for TIPTP. We are also grateful to all members of the fish facility team for zebrafish care, and Patrick van Hage for advice on statistical analysis.
Supplementary Material
Supplemental data for this article can be accessed online at https://doi.org/10.1080/27694127.2023.2242715
Additional information
Funding
References
- Levine, B. and Klionsky, D. J., Development by self-digestion: molecular mechanisms and biological functions of autophagy. Dev Cell. 2004;6:463–24.
- Mizushima, N., Autophagy: process and function. Genes Dev. 2007;21:2861–73.
- Deretic, V.,Saitoh, T. and Akira, S., Autophagy in infection, inflammation and immunity. Nat Rev Immunol. 2013; 13:722–37.
- Boyle, K. B. and Randow, F., The role of ‘eat-me’signals and autophagy cargo receptors in innate immunity. Curr Opin Microbiol. 2013;16:339–48.
- Huang, J. and Brumell, J. H., Bacteria–autophagy interplay: a battle for survival. Nat Rev Microbiol. 2014;12:101–14.
- Mostowy, S., Autophagy and bacterial clearance: a not so clear picture. Cell Microbiol. 2013;15:395–402.
- Deretic, V., Singh, S., Master, S. et al., Mycobacterium tuberculosis inhibition of phagolysosome biogenesis and autophagy as a host defence mechanism. Cell Microbiol. 2006;8:719–27.
- Hubber, A., Kubori, T., Coban, C., et al., Bacterial secretion system skews the fate of Legionella-containing vacuoles towards LC3-associated phagocytosis. Sci Rep. 2017;7:1–17.
- Prajsnar, T. K., Serba, J.J., Dekker, B.M. et al., The autophagic response to Staphylococcus aureus provides an intracellular niche in neutrophils. Atg. 2021;17:888–902.
- Mizushima, N., Yamamoto A, Matsui M. et al., In vivo analysis of autophagy in response to nutrient starvation using transgenic mice expressing a fluorescent autophagosome marker. Mol Biol Cell. 2004;15:1101–11.
- Durgan, J. and Florey, O., A new flavor of cellular Atg8-family protein lipidation–alternative conjugation to phosphatidylserine during CASM. Atg. 2021;17:2642–4.
- Durgan, J., Lystad, A.H., Sloan, K. et al., Non-canonical autophagy drives alternative ATG8 conjugation to phosphatidylserine. Mol Cell. 2021;81:2031–40. e8.
- Sanjuan, M. A., Dillon, C.P., Tait, S.W. et al., Toll-like receptor signalling in macrophages links the autophagy pathway to phagocytosis. Nature. 2007; 450:1253–7.
- Martinez, J., LAP it up, fuzz ball: a short history of LC3-associated phagocytosis. Curr Opin Immunol. 2018;55:54–61.
- Upadhyay, S. and Philips, J. A., LC3-associated phagocytosis: host defense and microbial response. Curr Opin Immunol. 2019;60:81–90.
- Grijmans, B. J., van der Kooij, S.B., Varela, M. et al., LC3‐associated phagocytosis and the arms race against bacterial pathogens. Front Cell Infect Microbiol. 2022:1343.
- Martinez, J., Malireddi, R.S., Lu, Q. et al., Molecular characterization of LC3-associated phagocytosis reveals distinct roles for Rubicon, NOX2 and autophagy proteins. Nat Cell Biol. 2015;17:893–906.
- Lei, Y. and Klionsky, D. J. The coordination of V-ATPase and ATG16L1 is part of a common mechanism of non-canonical autophagy. Taylor & Francis, 2022:2267–9.
- Hooper, K. M., et al., V-ATPase is a universal regulator of LC3-associated phagocytosis and non-canonical autophagy. Journal of Cell Biology, 2022. 221.
- Ligeon, L.-A., Jacquin, E., Li, T. et al., Oxidation inhibits autophagy protein deconjugation from phagosomes to sustain MHC class II restricted antigen presentation. Nat Commun. 2021;12:1–13.
- Mah, L. Y., O'Prey, J., Baudot, A.D. et al., DRAM-1 encodes multiple isoforms that regulate autophagy. Atg. 2012;8:18–28.
- Crighton, D., Wilkinson, S., O'Prey, J. et al., DRAM, a p53-induced modulator of autophagy, is critical for apoptosis. Cell, 2006;126:121–34.
- Galavotti, S., Bartesaghi, S., Faccenda, D. et al., The autophagy-associated factors DRAM1 and p62 regulate cell migration and invasion in glioblastoma stem cells. Oncogene, 2013;32:699–712.
- Chen, C., Liang, Q.Y., Chen, H.K. et al., DRAM1 regulates the migration and invasion of hepatoblastoma cells via autophagy‑EMT pathway. Oncol Lett. 2018;16:2427–33.
- Meng, C., Liu, Y., Shen, Y. et al., MicroRNA-26b suppresses autophagy in breast cancer cells by targeting DRAM1 mRNA, and is downregulated by irradiation Corrigendum in/10.3892/ol.2021.12460. Oncol Lett. 2018; 15:1435-40.
- Zhang, X.-D., Qi, L., Wu, J.C. et al., DRAM1 regulates autophagy flux through lysosomes. PLoS one, 2013;8:e63245.
- Geng, J., Zhang, R., Yuan, X. et al., DRAM1 plays a tumor suppressor role in NSCLC cells by promoting lysosomal degradation of EGFR. Cell Death Dis. 2020;11:1–15.
- Guan, J., Zhang, X.D., Sun, W. et al., DRAM1 regulates apoptosis through increasing protein levels and lysosomal localization of BAX. Cell Death Dis. 2015;6:e1624–e.
- Beaumatin, F., O'prey, J., Barthet, V.J. et al., mTORC1 activation requires DRAM-1 by facilitating lysosomal amino acid efflux. Mol Cell. 2019;76:163–76. e8.
- Laforge, M., Limou, S., Harper, F. et al., DRAM triggers lysosomal membrane permeabilization and cell death in CD4+ T cells infected with HIV. PLoS Pathog. 2013;9:e1003328.
- van der Vaart, M., Korbee, C.J., Lamers, G.E. et al., The DNA damage-regulated autophagy modulator DRAM1 links mycobacterial recognition via TLR-MYD88 to autophagic defense. Cell Host Microbe. 2014;15:753–67.
- Zhang, R., Varela, M., Forn-Cuní, G. et al., Deficiency in the autophagy modulator Dram1 exacerbates pyroptotic cell death of Mycobacteria-infected macrophages. Cell Death Dis. 2020;11:1–16.
- Meijer, A. H. and van der Vaart, M., DRAM1 promotes the targeting of mycobacteria to selective autophagy. Atg. 2014;10:2389–91.
- Van Der Sar, A. M., Musters, R.J., Van Eeden, F.J. et al., Zebrafish embryos as a model host for the real time analysis of Salmonella typhimurium infections. Cell Microbiol. 2003;5:601–11.
- Stockhammer, O. W., Rauwerda, H., Wittink, F.R. et al., Transcriptome analysis of Traf6 function in the innate immune response of zebrafish embryos. Mol Immunol. 2010;48:179–90.
- Masud, S., Prajsnar, T.K., Torraca, V. et al., Macrophages target Salmonella by Lc3-associated phagocytosis in a systemic infection model. Atg. 2019;15:796–812.
- Masud, S., Van der Burg, L., Storm, L. et al., Rubicon-dependent Lc3 recruitment to salmonella-containing phagosomes is a host defense mechanism triggered independently from major bacterial virulence factors. Front Cell Infect Microbiol. 2019;9:279.
- Kim, Y.-R., Kim, J.S., Gu, S.J. et al., Identification of highly potent and selective inhibitor, TIPTP, of the p22phox-Rubicon axis as a therapeutic agent for rheumatoid arthritis. Sci Rep. 2020;10:1–15.
- Burton, N. A., Schürmann, N., Casse, O. et al., Disparate impact of oxidative host defenses determines the fate of Salmonella during systemic infection in mice. Cell Host Microbe. 2014;15:72–83.
- Banducci-Karp, A., Xie, J., Engels, S.A. et al., DRAM1 Promotes Lysosomal Delivery of Mycobacterium marinum in Macrophages. cells, 2023;12:828.
- Herb, M. and Schramm, M., Functions of ROS in macrophages and antimicrobial immunity. Antioxid. 2021;10:313.
- Xu, Y., Zhou, P., Cheng, S. et al., A bacterial effector reveals the V-ATPase-ATG16L1 axis that initiates xenophagy. Cell, 2019;178:552–66. e20.
- Gong, L., Cullinane, M., Treerat, P. et al., The Burkholderia pseudomallei type III secretion system and BopA are required for evasion of LC3-associated phagocytosis. PloS one, 2011;6:e17852.
- Kim, J., Kundu, M., Viollet, B. et al., AMPK and mTOR regulate autophagy through direct phosphorylation of Ulk1. Nat Cell Biol. 2011;13:132–41.
- van der Vaart, M., Banducci-Karp, A., Forn-Cuní, G. et al., DRAM1 requires PI (3, 5) P2 generation by PIKfyve to deliver vesicles and their cargo to endolysosomes. bioRxiv, 2020.
- Huang, J., Canadien, V., Lam, G.Y. et al., Activation of antibacterial autophagy by NADPH oxidases. Proc Natl Acad Sci. 2009;106:6226–31.
- Ponpuak, M., Davis, A.S., Roberts, E.A. et al., Delivery of cytosolic components by autophagic adaptor protein p62 endows autophagosomes with unique antimicrobial properties. Immunity, 2010;32:329–41.
- Rougeot, J., Torraca, V., Zakrzewska, A. et al., RNAseq profiling of leukocyte populations in zebrafish larvae reveals a cxcl11 chemokine gene as a marker of macrophage polarization during mycobacterial infection. Front immunol. 2019;10:832.
- Benard, E. L., Roobol, S.J., Spaink, H.P. et al., Phagocytosis of mycobacteria by zebrafish macrophages is dependent on the scavenger receptor Marco, a key control factor of pro-inflammatory signalling. Dev Comp Immunol. 2014;47:223–33.
- Kim, J. K., Lee, H.M., Park, K.S. et al., MIR144* inhibits antimicrobial responses against Mycobacterium tuberculosis in human monocytes and macrophages by targeting the autophagy protein DRAM2. Atg. 2017;13:423–41.
- Stamm, L. M., Morisaki, J.H., Gao, L.Y. et al., Mycobacterium marinum escapes from phagosomes and is propelled by actin-based motility. J Exp Med. 2003;198:1361–8.
- Xie, Y., Xie, J., Meijer, A.H. et al., Glucocorticoid-induced exacerbation of mycobacterial infection is associated with a reduced phagocytic capacity of macrophages. Front immunol. 2021;12:618569.