
ABSTRACT
During organogenesis cellular homeostasis plays a crucial role in patterning and growth. The role of promoter proximal pausing of RNA polymerase II, which regulates transcription of several developmental genes by GAGA factor or Motif 1 Binding Protein (M1BP), has not been fully understood in cellular homeostasis. Earlier, we reported that M1BP, a functional homolog of ZKSCAN3, regulates wingless (wg) and caspase-dependent cell death (apoptosis) in the Drosophila eye. Further, blocking apoptosis does not fully rescue the M1BPRNAi phenotype of reduced eye. Therefore, we looked for other possible mechanism(s). In a forward genetic screen, members of the Jun-amino-terminal-(NH2)-Kinase (JNK) pathway were identified. Downregulation of M1BP ectopically induces JNK, a pro-death pathway, known to activate both apoptosis and caspase-independent (autophagy) cell death. Activation of JNK pathway components can enhance M1BPRNAi phenotype and vice-versa. Downregulation of M1BP ectopically induced JNK signaling, which leads to apoptosis and autophagy. Apoptosis and autophagy are regulated independently by their genetic circuitry. Here, we found that blocking either apoptosis or autophagy alone rescues the reduced eye phenotype of M1BP downregulation; whereas, blocking both apoptosis and autophagy together significantly rescues the M1BP reduced eye phenotype to near wild-type in nearly 85% progeny. This data suggests that the cellular homeostasis response demonstrated by two independent cell death mechanisms, apoptosis and autophagy, can be regulated by a common transcriptional pausing mechanism orchestrated by M1BP. Since these fundamental processes are conserved in higher organisms, this novel functional link between M1BP and regulation of both apoptosis and autophagy can be extrapolated to humans.
Abbreviations: hid: head involution defective; rpr: reaper; DIAP: Drosophila inhibitor of apoptosis proteins; RD genes: Retinal Determination genes; MF: Morphogenetic Furrow; PCD: Programmed cell death; ER: Endoplasmic reticulum; Wg: Wingless; JNK - c: Jun amino-terminal (NH2) Kinase; MAPKs – Mitogen: activated protein kinases; TNF: Tumor necrosis factor; Egr: Eiger; Wgn: Wengen; Tak 1: TGFβ activating kinase 1; JNKKK: JNK kinase kinase; Hep: Hemipterous; JNKK: JNK kinase; Bsk: Basket; Puc - Puckered; Pol II - RNA polymerase II; DNA: Deoxyribonucleic acid; TSS: Transcription start site; ESCs: Embryonic stem cells; Hop: Hopscotch; Dpp: Decapentaplegic; GAF: GAGA factor; M1BP: Motif 1 Binding Protein; ZAD: Zinc-associated domain; ZKSCAN3 - Zinc finger with a SCAN and a KRAB domain 3 (ZKSCAN3); UAS: Upstream activation sequence; ELAV: Embryonic lethal abnormal vision; RT qPCR: Real time quantitative polymerase chain reaction; LOF: Loss of function; GOF: Gain of function; GFP: Green fluorescent protein; WT: Wild-type; PBS: Phosphate buffered saline; PFA: Paraformaldehyde; PBST: Phosphate Buffered Saline with Triton X-100; β-GAL: Beta-galactosidase; DSHB: Developmental Studies Hybridoma Bank; CST: Cell Signaling Technologies; Dlg: Discs large; IgG: Immunoglobulin G; FITC: Fluorescein isothiocyanate; RNA: Ribonucleic acid; cDNA: Complementary DNA; Ct: cycle threshold; GAPDH: glyceraldehyde-3-phosphate dehydrogenase; SAPK: Stress-activated protein kinases; HRP: Horse Radish Peroxidase; ROI: Region Of Interest; SEM: Standard Error of the Mean; CI: Confidence Intervals
Introduction
During organogenesis cellular processes like cell division, cell differentiation, and cell death are tightly regulated by the spatio-temporal expression of various genes that include transcription factors and signaling molecules Citation1. Transcriptional regulation of gene expression is critical for patterning and cellular homeostasis Citation2–4. Disruption of homeostatic processes by intrinsic or extrinsic signals ultimately disrupts the transcriptional process: either by directly affecting the transcription of target genes or by indirectly modifying the stability, abundance and activity of transcription factors Citation5. A key response to homeostatic stress is activation of mechanisms that either lead to restoration of homeostasis by transcriptional mechanisms Citation6, or elimination of sub-optimal or less fit stressed cells by cell death mechanisms Citation7–9. There are several types of cell death utilized by organisms to restore homeostatic balance Citation10. Generally, cell death can occur by accident or by design. Accidental cell death like necrosis is often triggered by excessive and unexpected stress and is not directly controlled by specific genetic machinery. Alternatively, regulated cell death including apoptosis, autophagy, pyroptosis, entosis, parthanatos, etc. are controlled by specific genetic machinery and triggered by specific signals Citation10,Citation11. Among these, apoptosis and autophagy may occur more frequently during development. Although these two processes occur independently, research shows that blocking apoptosis can induce increased autophagy in a compensatory fashion to trigger cell death Citation12,Citation13. Although associations between aberrant cellular homeostasis to several diseases (for example, neurodegenerative diseases, cancers) have been made, mediators of the cellular response to homeostatic stress are not well understood.
Recently, transcriptional pausing mechanism(s) during transcription elongation have been implicated as another rate-limiting step alongside downstream events in transcription initiation Citation14,Citation15. Therefore, these mechanism(s) serve as key regulators of gene expression during development as well as in response to homeostatic stress Citation16,Citation17. During organogenesis, transcription factors facilitate RNA polymerase II (Pol II) recruitment to DNA resulting in dynamic spatio-temporal gene expression patterns Citation18,Citation19. These transcription factors bind to enhancers, proximal promoters, or core promoters within genes to initiate Pol II-mediated transcription Citation20. During transcription, Pol II usually gets recruited before the transcription start site (TSS) to promote transcription Citation14. Promoter proximal pausing is conserved from flies to mammals Citation21,Citation22, and is known to regulate several developmentally controlled genes during Drosophila embryogenesis Citation23. Sequence-specific transcription factors like GAGA factor (GAF) and Motif 1-Binding Protein (M1BP) regulate Pol II mediated transcriptional pausing 24. M1BP is highly conserved across species and encodes a 55kDa protein containing a zinc-associated domain (ZAD) towards the N-terminus and five C2H2 zinc-finger domains towards the C-terminus. Drosophila M1BP is functionally homologous to vertebrate zinc-finger with SCAN and KRAB domain 3 (ZKSCAN3) transcription factors Citation25,Citation26. M1BP functions by binding to Motif1 sequences on target genes to regulate or pause their transcription and has been reported to block several genes during development Citation24. Such transcriptional pausing mechanisms may be responsible for creating unique genetic signatures and regulating cellular processes Citation15,Citation24.
We showed that M1BP mediated transcriptional pausing can regulate evolutionarily conserved WNT/Wingless (Wg) signaling during Drosophila eye development Citation27. In the Drosophila eye, M1BP regulates expression of Wg, a ligand for the WNT/Wg signaling pathway. Ectopic Wg signaling is known to suppress eye fate by activation of caspase-dependent cell death Citation28,Citation29. Caspases mediate a majority of programmed cell death, or apoptosis, via formation of the apoptosome Citation30. The initiator caspase, Dronc is activated by upstream pro-apoptotic genes like reaper (rpr), head involution defective (hid), and grim aka RHG Citation31–33. RHG also negatively regulates Inhibitor of apoptosis proteins (IAPs) Citation34,Citation35. Caspase-dependent cell death is triggered by activation of Dronc that further activates the executioner caspase Drice, and leads to apoptosis characterized by cell shrinkage, nuclear fragmentation, chromatin condensation and DNA fragmentation Citation36.
Loss of M1BP is linked to reduced chromatin accessibility, impaired cellular proliferation, and death Citation24,Citation37,Citation38. Autophagy is a distinct form of cell death responsible for the elimination of damaged or excess cytoplasmic content by a catabolic lysosome mediated degradation system Citation39. Autophagy is marked by phagophore formation, autophagosome formation, and autophagolysosomal degradation that are genetically controlled by evolutionarily conserved genes first identified in yeast Citation40,Citation41. There are twenty highly conserved autophagy related genes (Atg) characterized in Drosophila Citation42. Among them, the Atg8 gene family (Atg8a and Atg8b) is most widely studied, and its members serve as an excellent biomarker for autophagy Citation43. Atg8a is the fly ortholog of human LC-3, an important component of autophagy machinery, is involved in phagophore formation, autophagosome formation and autophagolysosome formation, and serves as a reporter for autophagy Citation40. During eye development various specialized cells-types are generated to form an organ. These specialized cell types are required for vision. During eye development, autophagy plays an important role in formation of organelle free zone (OFZ) cells to form the transparent lens. Autophagy also protects the retinal cells from external stressors such as aggregated proteins, damaged cell organelles etc. Autophagy is also required for recycling light sensitive pigments in the retina. Thus autophagy is critically involved in development and in function of retinal neurons Citation44. Recent studies have linked autophagy to maintaining cellular homeostasis and development. Therefore, investigating how M1BP regulates gene expression and its targets in the developing eye may generate new insights on mediators of the cellular response to homeostatic stress during organogenesis.
In this context, we conducted a genetic modifier screen to identify interactors of M1BP. We tested transgenes expressing members of evolutionarily conserved signaling pathways in a M1BP loss-of-function background (). Depletion of M1BP results in a reduced eye phenotype. In this screen, we identified the JNK pathway as a key mediator of M1BP function in maintaining cellular homeostasis. JNK, a member of the conserved MAP kinase super-family, is involved in cell proliferation and cell survival and is activated through a phosphorylation cascade via MAP kinases Citation45–48. In Drosophila, JNK signaling is activated by binding of the Tumor necrosis factor (TNF) Eiger (Egr) to its receptors Wengen (Wgn) and Grindelwald (Grnd), and through a conserved signaling cascade of kinases, which include Tak 1 (TGFβ activating kinase 1, a JNK kinase kinase JNKKK), hemipterous (hep) (JNK kinase), basket (bsk) (Jun kinase) and the effector jun. Activation of the JNK pathway results in triggering its transcriptional target puckered (puc) expression. Puc, a dual phosphatase, participates in a negative feedback loop to downregulate JNK activity Citation47,Citation48. Current literature suggests that the JNK pathway acts as a hub for activating multiple modes of cell death including necroptosis, ferroptosis, pyroptosis, and autophagy Citation49.
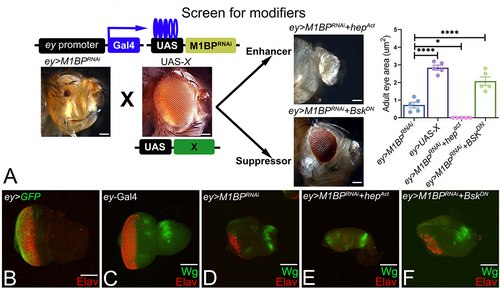
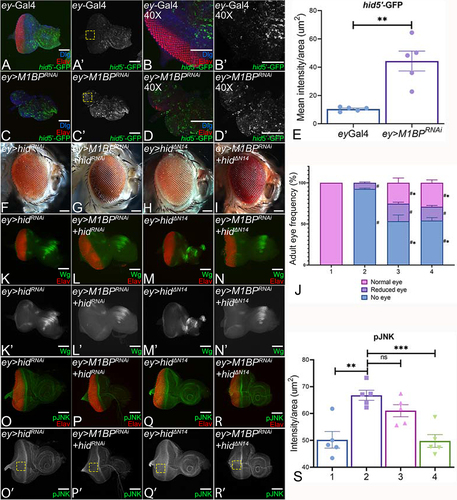
Figure 1. Forward genetic screen to identify modifiers of M1BP mediated eye suppression. (A) Schematics of forward genetic screen for identifying genetic modifiers of M1BP mediated eye suppression phenotype where various UAS-X/transgene lines were individually misexpressed using the ey-Gal4 driver along with downregulation of M1BP. Modifiers were classified into enhancers and suppressors based on whether they enhance or suppress the ey>M1BPRNAi reduced eye phenotype. Quantification of adult eye surface area (µm2) using Fiji/ImageJ software (NIH) to assay differences in eye phenotype. (B) ey>GFP where the GFP transgene reporter marks the ey-Gal4 driver expression domain in the developing third instar eye antennal disc. Note that the eye antennal imaginal disc is stained with pan-neuronal marker Elav (red) that marks the nuclei of retinal neurons. (C, D, E, F) Eye antennal imaginal discs stained for Wg (green) and pan-neuronal marker Elav (red). (D) Downregulation of M1BP in the entire eye (ey>M1BPRNAi) results in suppression of eye fate and increased Wg expression compared to (C) ey-Gal4 control. Eye discs showing (E) enhancement (ey>M1BPRNAi+hepAct) and (F) suppression (ey>M1BPRNAi+bskDN) of the ey>M1BPRNAi phenotype. The orientation of all imaginal discs is identical with posterior to the left and dorsal up. The magnification of all eye-antennal imaginal discs is 20X and adult eyes are 10X unless specified.
Here we demonstrate that M1BP suppresses the JNK signaling pathway in Drosophila eye. Downregulation of M1BP results in a reduced eye to a “no-eye” phenotype. This phenotype is excerbated upon activation of JNK signaling in this background that dramatically increases the frequency of the “no-eye” phenotype in progeny. Furthermore, modulation of JNK when M1BP levels are downregulated using M1BPRNAi results in modulation of wg, induction of cell death, and autophagy. In addition, both JNK- and Wg- signaling are in a feedback loop to trigger cell death and autophagy when M1BP levels are reduced. Thus, M1BP suppresses both Wg and JNK signaling pathways. Our results demonstrate that during development, M1BP mediated transcriptional pausing mechanism regulates cellular response to homeostatic stress by regulating multiple cell death mechanisms like apoptosis and autophagy.
Results
Search for genetic modifiers of M1BP’s reduced eye phenotype
The Drosophila adult eye is composed of 600-800 highly organized ommatidia or unit eyes arranged in a hexagonal lattice Citation50. These develop from the larval eye-antennal imaginal disc Citation51. In this study, the ey-Gal4 driver was used for targeted misexpression of our genes of interest in the developing eye as shown by UAS-GFP (ey>GFP, green) reporter expression (). Targeted misexpression of the UAS-M1BPRNAi transgene using ey-Gal4 driver (ey>M1BPRNAi) shows a strong eye suppression phenotype of reduced-eye (). This reduced eye phenotype is evident from pan-neuronal marker Elav staining that marks the nuclei of the retinal neuron. We employed a forward genetic screen to look for genetic modifiers of ey>M1BPRNAi reduced eye phenotype to identify targets of M1BP mediated transcriptional regulation (). Prior to initiating the screen, we addressed the issue, if ey-Gal4 driver has a diluting effect when we increased the number of UAS-constructs. We compared ey-Gal4>UAS-M1BPRNAi, with ey-Gal4>UAS-M1BPRNAi+ UAS-GFP and ey-Gal4>UAS-M1BPRNAi +UAS-GFP (2 copies). We found that ey>M1BPRNAi along with one or two more copies of UAS-GFP constructs exhibit same frequency of reduced eye phenotype (Supplementary Fig. 1).
Using a candidate gene approach, we individually misexpressed various inducible transgenes (UAS-X) of evolutionarily conserved signaling pathways in the ey>M1BPRNAi background. We screened for candidates whose misexpression resulted in either worsening (enhancers) or rescue (suppressors) of the ey>M1BPRNAi reduced eye phenotype (). We identified hemipterous (hep) and basket (bsk), members of the evolutionarily conserved JNK signaling pathways, as modifiers of ey>M1BPRNAi eye phenotype. Quantification of the adult eye surface area reveals significant reduction to a “no-eye” phenotype along with reduced head phenotype in ey>M1BPRNAi+hepAct (n=627/916, ~69%) whereas in ey>M1BPRNAi+bskDN (n= 746/1092, ~68%) there is a significant rescue to near wild-type eye (). In the developing larval eye disc, Wg is expressed in an antero-lateral fashion (). Furthermore, downregulation of M1BP (ey>M1BPRNAi) also results in a reduced eye field in the developing eye imaginal disc along with ectopic induction of Wg (). However, this eye field is significantly reduced or completely eliminated along with robust Wg induction in ey>M1BPRNAi+hepact background (). Conversely, the eye field was significantly restored along with downregulation of Wg expression in ey>M1BPRNAi+bskDN background (). These results suggest that hep and bsk are genetic modifiers of M1BP mediated reduced eye phenotype.
Downregulation of M1BP results in JNK activation in the developing eye
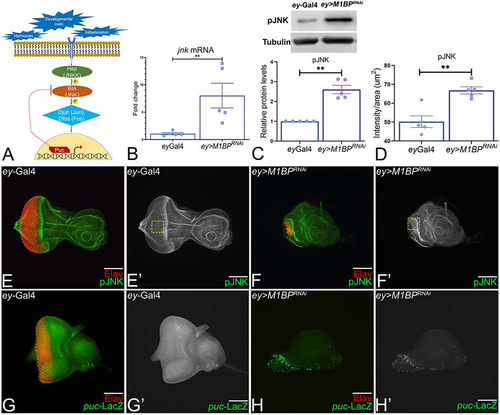
We tested if the JNK signaling pathway is affected by M1BP levels in developing eye. Activation of JNK signaling triggers a signaling cascade by phosphorylating Tak1, hep (JNK kinase kinase), bsk (Jun kinase) and Jun (). Activation of Jun upon phosphorylation triggers puc expression, which participates in a negative feedback loop with Bsk to regulate the JNK pathway Citation47,Citation48. Since M1BP is a transcription pausing factor, we first employed a real-time qPCR approach to quantify transcript levels of bsk (JNK) gene and found a near 7-fold increase in bsk mRNA levels in ey>M1BPRNAi discs compared to ey-Gal4 controls (). We validated our results by comparing p-JNK levels in ey>M1BPRNAi and ey-Gal4 control eye imaginal discs using a p-JNK antibody. Since JNK is expressed ubiquitously and ey>M1BPRNAi exhibits a highly reduced eye field (, F’) compared to the ey-Gal4 control (, E’), we calculated p-JNK protein’s band signal intensity. We found a significant increase in p-JNK signal intensity in ey>M1BPRNAi background () compared to controls. We also tested JNK pathway activation using the western blot analysis. We found a 2.5-fold increase in p-JNK signal in the ey>M1BPRNAi compared to ey-Gal4 controls () using the Empiria Studio® Software. Tubulin, a housekeeping gene, served as an internal control. To further validate our results, we tested the levels of puc-lacZ reporter, which serves as the functional read-out for JNK pathway activation Citation48. In wild-type eye disc, puc is expressed in differentiated photoreceptor neurons of eye disc (, G’) whereas in ey>M1BPRNAi background, ectopic induction of puc-lacZ reporter was seen in the eye disc (, H’), suggesting that JNK signaling is activated in the ey>M1BPRNAi background.
Figure 2. Downregulation of M1BP activates JNK signaling in the developing eye. (A) Schematic representation of c-Jun NH (2)-terminal kinase (JNK) signaling pathway. (B) Relative expression of jnk at the transcriptional level using quantitative real time PCR (qRT-PCR) in ey>M1BPRNAi and ey-Gal4 control eye-antennal imaginal discs. (C) Levels of phospho-JNK (pJNK) in a semi-quantitative Western Blot shows higher levels of JNK signaling in ey>M1BPRNAi compared to ey-Gal4 control. The tubulin bands serve as control for normalization. The quantification of p-JNK band intensity reveals a significantly higher levels in ey>M1BPRNAi background as compared to the control ey-Gal4. (D) Quantification of pJNK intensity was performed using standard 100 x 100 pixel ROI marked by yellow dotted line and using Fiji/ImageJ software (NIH). (E-H) Eye antennal imaginal disc of third instar larvae stained for pan-neuronal marker Elav (red) and (E, F) pJNK (green) and (G, H) puc-lacZ (green). Eye antennal imaginal disc showing split channel for (E’, F’) pJNK staining, (G’, H’) lacZ staining for (E, E’, G, G’) ey-Gal4 and (F, F’, H, H’) ey>M1BPRNAi. Graphs were plotted with mean +/- SEM. Statistical significance in each graph is shown by p-value: ****p<0.0001, ***p<0.001; **p<0.01; *p<0.05. The orientation of all imaginal discs is identical with posterior to the left and dorsal up. The magnification of all eye-antennal imaginal disc is 20X unless specified.
Modulation of JNK signaling levels affects M1BP mediated eye suppression
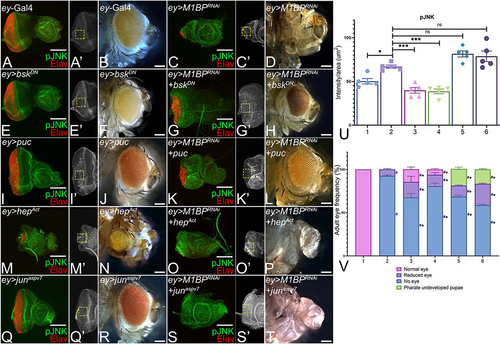
To test if the reduced eye (n=45/669, ~7%) or a “no-eye” phenotype (n=624/669, ~93%) in ey>M1BPRNAi discs are due to activation of JNK signaling, the levels of JNK signaling pathway members () were modulated using genetic approaches. JNK signaling status was determined by p-JNK staining in the third-instar eye imaginal discs. Downregulation of M1BP (ey>M1BPRNAi) results in a near complete loss of photoreceptors in the eye disc (, C’) and almost “no-eye” phenotype(s) in adults (n=624/669, ~93%) (). This phenotype is also accompanied with a significant increase in p-JNK levels (, C’, U, Supplementary Fig. 6) compared to the ey-Gal4 control (, A’, U, Supplementary Fig. 6). Blocking JNK signaling in the developing eye by targeted misexpression of a dominant negative bsk, bskDN, (ey>bskDN, , E’, F) and puc (ey>puc, , I’, J) alone served as controls and were similar to the ey-Gal4 control (wild-type) as seen in the eye imaginal discs and adult eyes (, A’, B). Downregulation of M1BP along with JNK signaling by using bskDN (ey>M1BPRNAi+bskDN (n=746/1092, ~68%, , G’, U, Supplementary Fig. 5) and puc (ey>M1BPRNAi+puc (n=307/384, ~80%, K, K’, V, Supplementary Fig. 5), rescued M1BP mediated reduced eye or “no-eye” phenotype as evident from Elav staining in the eye imaginal discs () and adult eyes (, Supplementary Fig. 5). However, activation of JNK signaling and downregulation of M1BP using an activated hep, hepAct, in ey>M1BPRNAi+ hepAct (n=627/916, ~69%, O, O’, P) and activated jun in ey>M1BPRNAi+junaspvCitation7 (n=207/353, ~59%, , S’, T, Supplementary Fig. 5) increased the severity of “no-eye” phenotype in the eye imaginal discs () and adult eyes (, Supplementary Fig. 5). Furthermore, there were also pharate undeveloped pupae that were observed when JNK signaling was activated ().This observation was supported by a significant increase in p-JNK levels in the eye imaginal discs (, Supplementary Fig. 6) when compared to levels observed in ey>M1BPRNAi (). The controls used for activation of JNK signaling pathway were junaspvCitation7 (ey>junaspvCitation7, (), M’, N) and hepAct (ey>hepAct, , Q’, R), which resulted in an eye suppression phenotype as compared to the wild-type ey-Gal4 control (, A’, B). These results suggest that M1BP is involved in regulating JNK signaling pathway levels to promote cell survival during eye development. Since M1BP also regulates Wg levels, it is important to understand the role of Wg and JNK signaling in of M1BP’s reduced eye phenotype.
Figure 3. Modulation of JNK signaling affects eye suppression phenotype of M1BP downregulation. (A, C, E, G, I, K, M, O, Q, S) Eye antennal imaginal disc of third instar larvae stained for pJNK (green) and pan-neuronal marker Elav (red). (A, A’) ey-Gal4 control discs showing pJNK expression. (A’, C’, E’, G’, I’, K’, M’, O’, Q’, S’) Eye antennal imaginal disc showing split channel for pJNK staining. Quantification was performed using standard 100X100 pixel ROI. ROI is shown as yellow dashed boxes. Adult eye images of control (B) ey-Gal4, downregulation of M1BP (D) ey>M1BPRNAi, downregulating JNK pathway: (F) ey>bskDN, (H) ey>M1BPRNAi+bskDN, (J) ey>puc, (L) ey>M1BPRNAi+puc, upregulating JNK pathway: (N) ey>hepAct, (P) ey>M1BPRNAi+hepAct, (R) ey>junaspvCitation7, (T) ey>M1BPRNAi+junaspvCitation7. Eye-antennal imaginal discs of control (A, A’) ey-Gal4, downregulation of M1BP (C, C’) ey>M1BPRNAi, downregulating JNK pathway: (E, E’) ey>bskDN, (G. G’) ey>M1BPRNAi+bskDN, (I, I’) ey>puc, (K, K’) ey>M1BPRNAi+puc, upregulating JNK pathway: (M, M’) ey>hepAct, (O, O’) ey>M1BPRNAi+hepAct, (Q, Q’) ey>junaspvCitation7, (S, S’) ey>M1BPRNAi+junaspvCitation7. Note that (H, L) downregulation of JNK signaling showed significant rescues in adult eye phenotypes; whereas (P, T) activation of JNK signaling enhanced the eye suppression phenotype of (D) ey>M1BPRNAi. (U) Quantification of pJNK intensity using Fiji/ImageJ software (NIH). The genotypes depicted in the graph are 1: ey-Gal4, 2: ey>M1BPRNAi, 3: ey>M1BPRNAi+bskDN, 4: ey>M1BPRNAi+puc, 5: ey>M1BPRNAi+hepAct and 6: ey>M1BPRNAi+junaspvCitation7. (V) Graphical representation of adult eye phenotype frequency. The genotypes depicted in the graph are 1: ey-Gal4, 2: ey>M1BPRNAi, 3: ey>M1BPRNAi+bskDN, 4: ey>M1BPRNAi+puc, 5: ey>M1BPRNAi+hepAct and 6: ey>M1BPRNAi+junaspvCitation7. For adult eye frequency, statistical significance with eyGal4 and ey>M1BPRNAi are depicted using # and * respectively. Graphs were plotted with mean +/- SEM. For quantification, statistical significance in each graph is shown by p-value: ****p<0.0001, ***p<0.001; **p<0.01; *p<0.05. The orientation of all imaginal discs is identical with posterior to the left and dorsal up. The magnification of all eye-antennal imaginal discs is 20X and adult eyes are 10X unless specified.
Modulation of JNK pathway affects wingless in M1BP loss-of-function background
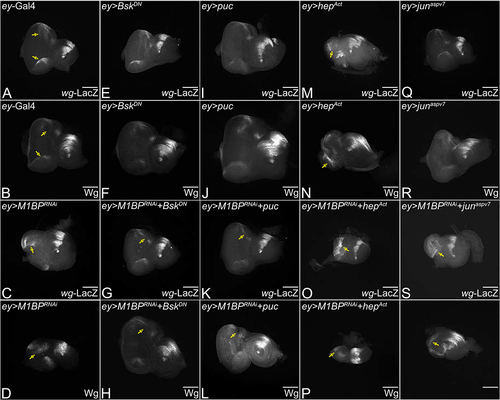
During eye development, Wg serves as a negative regulator of eye fate and blocks progression of morphogenetic furrow (MF) Citation52–56. To understand what happens to wg, a putative target of M1BP Citation27, when levels of the JNK pathway are modulated, we analyzed wg levels in the eye disc at the transcriptional level using a lacZ reporter and translational level using an antibody against Wg protein. Both wg-lacZ reporter and Wg protein are expressed in an antero-lateral fashion in the developing third instar eye disc of ey-Gal4 control (). Downregulation of M1BP (ey>M1BPRNAi) results in the ectopic induction of wg-lacZ as well as Wg protein () Citation27. Downregulation of the JNK pathway using bskDN (ey>bskDN, ) and puc (ey>puc, ) alone in the developing eye disc exhibits the wg-lacZ reporter- and Wg protein- expression similar to the ey-Gal4 control (). When JNK signaling and M1BP levels are downregulated together in the ey>M1BPRNAi+bskDN () and ey>M1BPRNAi+puc () background, it exhibits a rescue of the “no-eye” phenotype and shows a dramatic reduction in wg-lacZ and Wg proteins levels compared to the ey>M1BPRNAi discs (). Activation of JNK signaling in the entire eye by using junaspvCitation7 (ey>junaspvCitation7, (), S), and hepAct alone (ey>hepAct, ) results in eye suppression along with induction of wg as compared to ey-Gal4 control (). Note, that Wg level are not significantly affected in junaspvCitation7 alone compared to ey-Gal4 controls due to weakness of the transgene. Activation of JNK signaling along with downregulation of M1BP (ey>M1BPRNAi+junaspvCitation7 () and ey>M1BPRNAi+hepAct () shows an increase in wg at the transcriptional as well as translational level when compared to ey>M1BPRNAi alone (). These results clearly suggest that modulation of the JNK pathway in the developing eye modulates wg levels. This observation supports the presence of a feedback loop during eye development Citation57. Previous studies have shown that ectopic Wg or JNK are capable of inducing cell death during eye development Citation27–29. Therefore, it is important to test if reduced eye phenotype in M1BP downregulation is due to activation of Wg and JNK signaling mediated cell death.
Figure 4. Modulation of JNK pathway in M1BP LOF background affects wingless levels. Eye-antennal imaginal discs from third instar larvae of (A) ey-Gal4, downregulation of M1BP (C) ey>M1BPRNAi, downregulating JNK pathway: (E) ey>bskDN, (G) ey>M1BPRNAi+bskDN, (I) ey>puc, (K) ey>M1BPRNAi+puc, upregulating JNK pathway: (M) ey>hepAct, (O) ey>M1BPRNAi+hepAct, (Q) ey>junaspvCitation7, (T) ey>M1BPRNAi+junaspvCitation7 were assessed for changes in wg-lacZ expression shown in grayscale. (B, D, F, H, J, L, N, P, R, S, U) Eye-antennal imaginal discs from third instar larvae of (B) ey-Gal4, downregulation of M1BP (D) ey>M1BPRNAi, downregulating JNK pathway: (F) ey>bskDN, (H) ey>M1BPRNAi+bskDN, (J) ey>puc, (L) ey>M1BPRNAi+puc, upregulating JNK pathway: (N) ey>hepAct, (P) ey>M1BPRNAi+hepAct, (R) ey>junaspvCitation7, (S) ey>M1BPRNAi+junaspvCitation7 were assessed for changes in Wg expression shown in grayscale. (A, B) ey-Gal4 control discs showing expression in the anterolateral margins of the eye disc. (C, D) Loss of M1BP in the entire developing eye (ey>M1BPRNAi) results in ectopic induction of wg expression. Downregulation of JNK pathway in the background of loss of M1BP in the entire eye (G, H) ey>M1BPRNAi+bskDN and (K, L) ey>M1BPRNAi+puc. Activation of JNK pathway in the background of loss of M1BP (O, P) ey>M1BPRNAi+hepAct and (T, U) ey>M1BPRNAi+junaspvCitation7. Yellow solid arrows indicate the induction or suppression of Wg. The orientation of all imaginal discs is identical with posterior to the left and dorsal up. The magnification of all eye-antennal imaginal discs is 20X unless specified.
Downregulation of M1BP induces hid expression and apoptotic cell death
We tested if M1BP downregulation (ey>M1BPRNAi) can trigger apoptotic cell death by using hid5’F-WT-GFP, a transcriptional reporter for the hid gene Citation58. hid is expressed in cells undergoing apoptosis and is generally seen in a few cells in control third instar eye-antennal imaginal disc Citation58. To quantify the signal, we measured the GFP fluorescence intensity in uniform areas of 100X100 pixel boxes in the ey-Gal4 expression domain using a region of interest (ROI) approach Citation59. A basal level of GFP (green) signal was observed in the eye region of ey-Gal4 control discs (, A’, B, B’, E); whereas downregulation of M1BP in the developing eye resulted in dramatic induction of hid-GFP (green) in the eye disc (, C’, D, D’, E). To test if the reduced eye phenotype in ey>M1BPRNAi background is due to induction of caspase-dependent cell death, we downregulated hid levels using hidRNAi and hidΔNCitation14, a N-terminal deletion construct, in the ey>M1BPRNAi background. When compared to downregulation of M1BP alone (ey>M1BPRNAi, ), downregulation of both hid and M1BP (ey>M1BPRNAi+hidRNAi, n=81/317, ~25%, and ey>M1BPRNAi+hidΔNCitation14, n=100/343, ~29%, () showed rescue of the reduced eye or “no-eye” phenotype of ey>M1BPRNAi alone as seen in the eye disc and the adult eye. Furthermore, we also tested levels of Wg and JNK signaling in this background to study their role. Downregulation of M1BP levels along with blocking of cell death by using hidRNAi (ey>M1BPRNA+hidRNAi, , L’) and hidΔNCitation14 (ey>M1BPRNAi+hidΔNCitation14, (), N’) exhibits mild restoration of Wg expression compared to the ectopic induction of Wg in ey>M1BPRNAi alone (). Also, the controls ey> hid RNAi (, K’) and ey> hid ΔNCitation14 (, N’) show near wild-type expression of Wg. Additionally, we wanted to see pJNK levels, a read out of JNK signaling, which is known to activate caspase -dependent and -independent cell death. We observed that downregulation of M1BP levels along with hid by using hidRNAi (ey>M1BPRNA+hidRNAi, , P’, S) and hidΔNCitation14 (ey>M1BPRNAi+hidΔNCitation14, (, R’, S) resulted in a significant reduction in pJNK levels compared to M1BP (ey>M1BPRNAi) alone (). Although pJNK levels were slightly higher in ey>M1BPRNAi than ey-Gal4 control (, Supplementary Fig. 6). Other controls like ey> hid RNAi (, P’) and ey>hid ΔNCitation14 (, Q’) show near wild-type expression of pJNK. Thus, blocking cell death alone is not sufficient for rescuing M1BP mediated eye suppression phenotypes (, Supplementary Fig. 5). Therefore, we wanted to assay other mechanisms of death.
Figure 5. Downregulation of M1BP triggers cell death. Eye-antennal imaginal discs stained for pan-neuronal marker Elav (red), Dlg (blue), a membrane specific marker, to mark outline of the tissue and (A-D) hid5’F-WT-GFP (green). Eye antennal imaginal disc showing split channel for (A’-D’) hid5’F-WT-GFP for (A, A’, B, B’) ey-Gal4 and (C, C’, D, D’) ey>M1BPRNAi in (A, A’, C, C’) 20X and (B, B’, D, D’) 40X. (E) Quantification of hid5’F-WT-GFP intensity using Fiji/ImageJ software (NIH) using standard 100X100 pixel ROI. ROI is shown as yellow dashed boxes. Caspase-dependent cell death was blocked in the entire eye (F, K, K’, O, O’) ey>hidRNAi, (H, M, M’, Q, Q’) ey>hidΔNCitation14. Blocking hid mediated apoptotic cell death in ey>M1BPRNAi background (G, L, L’, P, P’) ey>M1BPRNAi+hidRNAi, (I, N, N’, R, R’) ey>M1BPRNAi+hidΔNCitation14 shows rescue when compared to ey>M1BPRNAi. (J) Graphical representation of adult eye phenotype frequency. The genotypes depicted in the graph are 1: ey-Gal4, 2: ey>M1BPRNAi, 3: ey>M1BPRNAi+hidRNAi and 4: ey>M1BPRNAi+hidΔNCitation14. Statistical significance with eyGal4 and ey>M1BPRNAi are depicted using # and * respectively. Eye antennal imaginal discs of indicated genotypes stained for (K-N) Wg (green), (O-R) pJNK (green) and pan-neuronal marker Elav (red). Eye-antennal imaginal discs showing split channel for (K’-N’) Wg and (O’-R’) pJNK staining. (S) pJNK intensity quantification using Fiji/ImageJ software (NIH). The genotypes depicted in the graph are 1: ey-Gal4, 2: ey>M1BPRNAi, 3: ey>M1BPRNAi+hidRNAi and 4: ey>M1BPRNAi+hidΔNCitation14. Quantification was performed using standard 100X100pixels ROI. ROI is shown as yellow dashed boxes. Graphs were plotted with mean +/- SEM. Statistical significance in each graph is shown by p-value: ****p<0.0001, ***p<0.001; **p<0.01; *p<0.05. The orientation of all imaginal discs is identical with posterior to the left and dorsal up. The magnification of all eye-antennal imaginal discs is 20X and adult eyes are 10X unless specified.
Downregulation of M1BP triggers autophagy
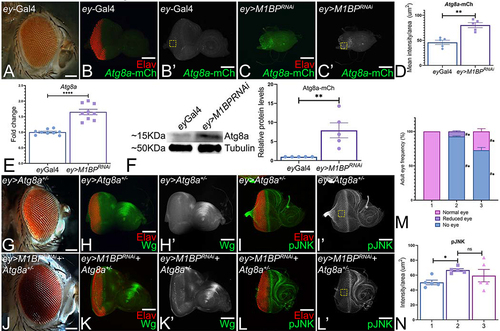
To test if autophagy is responsible for the reduced eye phenotype of ey>M1BPRNAi, we first assessed the levels of Atg8a-mCherry, a reporter for autophagic cell death, in the third instar eye discs. Atg8a is an important component of autophagy machinery and is involved during all stages of the process like in phagophore formation, autophagosome formation and autophagolysosome formation. Therefore, Atg8a is a widely used as a marker to assay autophagy Citation43,Citation60,Citation61. We assayed Atg8a as an indicator of the entire process of autophagy and also downregulated Atg8a to block autophagy. Downregulation of M1BP (, C’) in the entire eye results in a nearly a two-fold increase in Atg8a-mCherry levels as compared to ey-Gal4 control discs (, B’, D). These observations suggest that M1BP may also be involved in suppressing autophagy during eye development. Therefore, we further validated these results using real-time quantitative PCR and semi-quantitative western blot. Downregulation of M1BP (ey>M1BPRNAi) resulted in a significant upregulation of Atg8a transcripts when compared to the ey-Gal4 control discs (). Furthermore, western blot revealed a significantly higher Atg8a protein levels in ey>M1BPRNAi when compared to ey-Gal4 (). We tested if blocking autophagy is sufficient to rescue M1BP mediated eye suppression. In Atg8a1 mutant’s heterozygous background, eye development is near wild-type as observed in the adult eye () and eye imaginal disc (). However, in the ey>M1BPRNAi background (ey>M1BPRNAi+Atg8a1–/+, n=126/470, ~27%, ) a significant rescue of the “no-eye” or reduced eye phenotype of ey>M1BPRNAi alone to near wild-type eye is seen in nearly 27% of the flies (). Heterozygous Atg8a1–/+ mutants show normal Wg expression in the antero-lateral margins (, F’). Reducing M1BP levels in Atg8a1 mutant’s heterozygous background (ey>M1BPRNAi+ Atg8a1−/+, , K’) reveals restoration of Wg expression to normal levels in the eye discs when compared to ey>M1BPRNAi alone. pJNK levels were studied in these eye discs and signal intensity was quantified. Interestingly, downregulation of M1BP in Atg8a1 mutant’s heterozygous background (ey>M1BPRNAi+ Atg8a1−/+, , L’, N, Supplementary Fig. 6) shows pJNK levels similar to that of ey>M1BPRNAi. These results suggest that JNK signaling is upstream of Atg8a and regulates autophagy.
Figure 6. Downregulation of M1BP triggers autophagy. (A) ey-Gal4 adult eye. (B, B’, C, C’) Eye-antennal imaginal discs stained with pan neuronal marker Elav (red) and assessed for changes in expression of Atg8a-mCherry (green) reporter. (B’, C’) Eye antennal imaginal disc showing split channel for Atg8a-mCherry expression. (B, B’) ey-Gal4 control discs. (C, C’) Downregulation of M1BP in the entire developing eye (ey>M1BPRNAi). (D) Quantification of Atg8a-mCherry intensity conducted using Fiji/ImageJ software (NIH) using standard 100X100 pixel ROI. ROI is shown as yellow dashed boxes. (E) Relative expression of Atg8a at the transcriptional level using quantitative real time PCR (qRT-PCR) in ey>M1BPRNAi and ey-Gal4 control eye-antennal imaginal discs. (F) Levels of Atg8a in a semi-quantitative Western Blot shows higher levels of autophagy activation in ey>M1BPRNAi compared to ey-Gal4 control. The tubulin bands serve as internal loading control for normalization. The quantification of Atg8a band intensity reveals a significantly higher level in ey>M1BPRNAi when compared to ey-Gal4. (G, H, H’, I, I’) Blocking autophagy in the entire eye using Atg8a mutant (ey>Atg8a+/-) results in a near wild-type eye. Blocking autophagy using Atg8a mutant in ey>M1BPRNAi background (H, I, I’, J, J’) ey>M1BPRNAi+Atg8a+/- can rescue the eye suppression phenotype. Eye antennal imaginal discs of indicated genotypes stained for (H, K) Wg (green), (I, L) pJNK (green) and pan-neuronal marker Elav (red). Eye-antennal imaginal discs showing split channel for (H’, K’) Wg and (I’, L’) pJNK staining. (M) Graphical representation of adult eye phenotype frequency. The genotypes depicted in the graph are 1: ey-Gal4, 2: ey>M1BPRNAi, 3: ey>M1BPRNAi+Atg8a+/-. Statistical significance with eyGal4 and ey>M1BPRNAi are depicted using # and * respectively. (N) pJNK intensity quantification using Fiji/ImageJ software (NIH). The genotypes depicted in the graph are 1: ey-Gal4, 2: ey>M1BPRNAi, 3: ey>M1BPRNAi+Atg8a+/-. Quantification was performed using standard 100X100pixels ROI. ROI is shown as yellow dashed boxes. Graphs were plotted with mean +/- SEM. Statistical significance in each graph is shown by p-value: ****p<0.0001, ***p<0.001; **p<0.01; *p<0.05. The orientation of all imaginal discs is identical with posterior to the left and dorsal up. The magnification of all eye-antennal imaginal discs is 20X and adult eyes are 10X unless specified.
Downregulation of M1BP exhibits JNK signaling mediated activation of autophagy
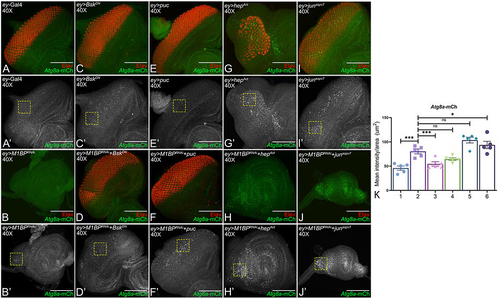
JNK signaling is emerging as a node for multiple modes of cell death Citation49. We tested if activation of autophagy is mediated through JNK signaling. To do this, we assayed the levels of an autophagy marker while modulating the JNK pathway in a background where M1BP was downregulated. Downregulation of M1BP in entire eye disc (ey>M1BPRNAi, , B’, K) ectopically enhances Atg8a-mCherry expression in the eye disc when compared to ey-Gal4 control (, A’, K). In the developing eye disc, downregulation of both M1BP and JNK signaling together by using bskDN (ey>M1BPRNAi+bskDN, , D’, K) and puc (ey>M1BPRNAi+puc, F, F’, K), result in a significant rescue in the number of Elav positive cells; however, the Atg8a levels are reduced compared to ey>M1BPRNAi (, A’, K). The modulation of controls like bskDN (ey>bskDN, , C’) and puc (ey>puc, , E’) alone in the entire developing eye show minimal or highly reduced Atg8a-mCherry expression compared to ey-Gal4 control (, A’). Activation of JNK signaling in the entire eye disc by using junaspvCitation7 (ey>junaspvCitation7, (), I’) or hepAct (ey>hepAct, , G’, K) showed increased Atg8a-mCherry expression compared to ey-Gal4 control (, A’, K). When we activated JNK signaling along with downregulating M1BP in ey>M1BPRNAi+hepAct (, H’, K) and (ey>M1BPRNAi+junaspvCitation7 (, J’, K), we see a significant increase in Atg8a-mCherry expression in the eye discs compared to ey>M1BPRNAi alone (, B’, K). Thus, during eye development M1BP is required to suppress JNK signaling and in turn suppresses autophagy. Interestingly, blocking caspase-dependent (apoptosis) alone or caspase-independent (autophagy) alone rescued the “no-eye” phenotype to near wild-type eyes in nearly 25% of the flies but not all flies. Therefore, we tested if blocking both cell death and autophagy along with M1BP downregulation can exhibit a stronger rescue.
Figure 7. Activation of JNK signaling in the background of M1BP downregulation promotes autophagy. (A-J) Eye-antennal imaginal discs of (A, A’) ey-Gal4 control, (B, B’) ey>M1BPRNAi, (C, C’) ey>bskDN, (D, D’) ey>M1BPRNAi+bskDN, (E, E’) ey>puc, (F, F’) ey>M1BPRNAi+puc, (G, G’) ey>hepAct, (H, H’) ey>M1BPRNAi+hepAct, (I, I’) ey>junaspvCitation7, (J, J’) ey>M1BPRNAi+junaspvCitation7 were assessed for changes in Atg8a-mCherry (green) and pan neuronal marker Elav (red) expression. (A’-J’) Eye antennal imaginal disc showing split channel for Atg8a-mCherry expression. (C-F) JNK pathway was downregulated using bskDN (C, C’) ey>bskDN and puc (E, E’) ey>puc. (G-J) JNK pathway was activated using hepAct (G, G’) ey>hepAct and junaspvCitation7 (I, I’) ey>junaspvCitation7. (K) Quantification of Atg8a-mCherry intensity using Fiji/ImageJ software (NIH). Quantification was performed using standard 100X100 pixels ROI. ROI is shown as yellow dashed boxes. Graph was plotted with mean +/- SEM. The genotypes depicted in the graph are 1: ey-Gal4, 2: ey>M1BPRNAi, 3: ey>M1BPRNAi+bskDN, 4: ey>M1BPRNAi+puc, 5: ey>M1BPRNAi+hepAct and 6: ey>M1BPRNAi+junaspvCitation7. Statistical significance in each graph is shown by p-value: ****p<0.0001, ***p<0.001; **p<0.01; *p<0.05. The orientation of all imaginal discs is identical with posterior to the left and dorsal up. The magnification of all eye-antennal imaginal discs is 40X.
M1BP blocks both caspase-dependent and caspase-independent cell death
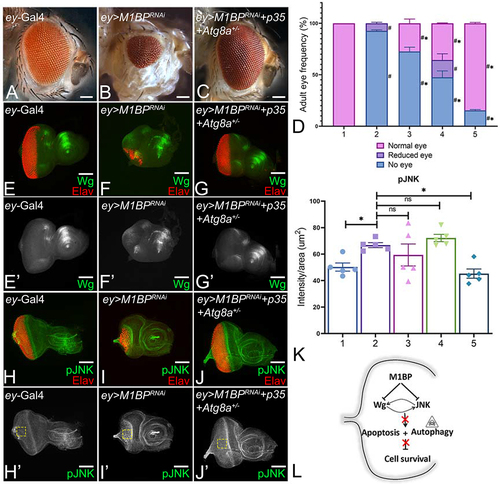
To test this hypothesis, we genetically misexpressed P35 and reduced Atg8a levels to half using a heterozygous combination along with downregulation of M1BP function using M1BPRNAi (Atg81−/+; ey> M1BPRNAi + P35) in the same fly. As expected, we observed a very strong rescue to near wild-type adult eye () compared to the “no-eye” phenotype of ey>M1BPRNAi () alone flies. Furthermore, this rescue was observed in ~ 85% (n=308/363) of the flies (). We wanted to see how JNK signaling may play a role in this rescue. We stained for pJNK and quantified its intensity. Our results clearly showed an increase in pJNK expression when M1BP is downregulated (, I’, K). Additionally, our results showed that blocking apoptosis and autophagy alone in ey>M1BPRNAi background did not rescue JNK pathway activation (). Interestingly, upon blocking both apoptosis and autophagy, we did not see a decrease in JNK signaling levels to that of wild-type (, J’, K). We also checked the expression of Wg, a negative regulator of eye development that is normally expressed in the antero-lateral margins shown in ey-Gal4 control (, E’). We see a significant restoration of Wg expression levels when both caspase -dependent (apoptosis) and -independent (autophagy) are blocked in ey>M1BPRNAi background (, G’). This data suggests that transcriptional pausing mechanism mediated through M1BP regulates both apoptosis and autophagy during development ().
Figure 8. M1BP is required to block both caspase-dependent and caspase-independent cell death during development. Adult eye of (A) ey-Gal4 showing normal arrangement of photoreceptors and (B) ey>M1BPRNAi showing reduced eye phenotype. (C) Blocking caspase -dependent and -independent (autophagy) cell death in the background of M1BP downregulation ey>M1BPRNAi+p35+Atg8a+/- eye shows significant rescue. (D) Graphical representation of adult eye phenotype frequency. Graphs were plotted with mean +/- SEM. The genotypes depicted in the graph are 1: ey-Gal4, 2: ey>M1BPRNAi, 3: ey>M1BPRNAi+Atg8a+/-, 4: ey>M1BPRNAi+p35, 5: ey>M1BPRNAi+p35+Atg8a+/-. Statistical significance with eyGal4 and ey>M1BPRNAi are depicted using # and * respectively. Eye-antennal imaginal discs of the indicated genotypes were stained for (E-G) Wg (green), (H-J) pJNK (green) and pan-neuronal marker Elav (red). Eye-antennal imaginal discs showing split channel for (E’-G’) Wg and (H’-J’) pJNK staining. (K) pJNK intensity quantification using Fiji/ImageJ software (NIH). Quantification was performed using standard 100X100pixels ROI. ROI is shown as yellow dashed boxes. The genotypes depicted in the graph are 1: ey-Gal4, 2: ey>M1BPRNAi, 3: ey>M1BPRNAi+Atg8a+/-, 4: ey>M1BPRNAi+p35, 5: ey>M1BPRNAi+p35+Atg8a+/-. (L) Model for M1BP mediated regulation of cellular homeostasis. M1BP suppresses JNK-mediated apoptosis and autophagy to promote cell survival in the developing eye. Statistical significance in each graph is shown by p-value: ****p<0.0001, ***p<0.001; **p<0.01; *p<0.05. The orientation of all imaginal discs is identical with posterior to the left and dorsal up. The magnification of all eye-antennal imaginal discs is 20X and adult eyes are 10X unless specified.
Discussion
During organogenesis, cell death occurs at basal levels to maintain cellular homeostasis. Multicellular organisms typically produce excess cells that are eliminated to maintain terminally differentiated cells and organ size during morphogenesis. This strictly regulated cell death is referred to as “Programmed Cell Death” (PCD) Citation10, and requires appropriate signals due to activation of molecular programs. Generally, dying cell(s) are replaced by new cell-type(s) whereas in other cases they are replaced by brand new cell(s) of the same type.
In the developing Drosophila eye, cellular homeostasis plays an important role in organogenesis. Most cell death utilizes caspase-dependent cell death, also called as apoptosis. Autophagy, a lysosome mediated self-degradation process observed in eukaryotic cells, is contextual and eliminates unfit cells to ensure macromolecule turnover and maintains cellular homeostasis. It can function as a pro-death or pro-survival process depending on context dependent manner. Autophagy delivers cytoplasmic materials to the lysosome for degradation Citation11. The genetic machinery involved in autophagy is highly conserved. In Drosophila, a recent study has demonstrated that several autophagy genes are active in the developing eyeCitation62. Loss of just one autophagy gene does not induce a severe phenotype while loss of multiple genes shows a spectrum of reduced eye phenotypes Citation62. Interestingly, autophagy (cellular “self-eating”) often accompanies apoptosis Citation13. Therefore, both apoptosis and autophagy are required to remove excess cells to regulate the cell number of terminally differentiated cells and form the highly organized adult compound eye Citation62–65.These cellular processes are also crucial for organ sculpting and morphogenesis during development Citation7,Citation8. There are also genetic evidences for autophagy-dependent cell death in mammalian cells that are unable to undergo apoptosisCitation12. This suggests that autophagy, which often accompanies apoptosis, can compensate for apoptosis when apoptosis is blocked or inhibited. During embryonic development, removal of interdigital web cells is delayed in apoptosis-deficient Bax/Bak KO mice, which gets further delayed in Atg5/ Bax/ Bak triple KO mouse Citation12. Thus, a compensatory backup mechanism involving apoptosis and autophagy ensures that unwanted cells get deleted by non-apoptotic (autophagy) means.
Aberrant activation of several signaling pathways and extrinsic stress signals are known to regulate these processes by triggering developmental cell death Citation28,Citation29,Citation41,Citation66,Citation67. Since these two processes often accompany each other but are regulated by their distinct genetic machinery, it is important to understand how these two processes are regulated during development.
We found that Pol II pausing, which dynamically regulates gene expression of 10-40% of all genes in Drosophila Citation23,Citation68, plays an important role in regulating apoptosis and autophagy. Thus, the promoter-proximal stalling of developmentally important genes plays a crucial function in development 69. M1BP is expressed ubiquitously in all cells. It binds to Motif1 sequences on target genes and subsequently recruits other factors that regulate transcription negatively. This negative regulation is facilitated by association with negative elongation factor (NELF) and potentially by the presence of 1+ nucleosomes downstream of target genes Citation24. In gene ontology, M1BP regulated genes for basic biological processes such as cell cycle, metabolism, cell viability and the cytoskeleton are overrepresented Citation15,Citation24. Previously, we have demonstrated that M1BP downregulates wg by a transcriptional pausing mechanism that blocks apoptosis in the developing Drosophila eye Citation27. However, the underlying molecular genetic mechanism by which M1BP regulates cellular homeostasis during development is not clear. We therefore studied how this transcriptional pausing factor can contribute at a molecular level to regulate cellular homeostasis. The premise is based on our observation that blocking caspase-dependent cell death (apoptosis) did not fully rescue M1BP’s downregulation phenotype of “no-eye” or reduced eye. To further dissect the M1BP mediated eye suppression function, we performed a forward genetic screen to look for genetic modifiers of M1BP downregulation phenotype of “no-eye” or reduced eye. We identified hemipterous (hep) and basket (bsk), the two members of JNK signaling pathway in the screen (). To validate the activation of JNK pathway in M1BP loss-of-function background, we investigated three functional readouts of the JNK pathway - (i) the transcriptional status of jnk using qRT PCR, (ii) puc-lacZ reporter expression, and (iii) pJNK protein levels using an immunohistochemical approach (). Our qPCR data showed a 7-fold increase in jnk mRNA levels. Additionally, puc-lacZ reporter expression and pJNK protein levels were significantly upregulated when M1BP is downregulated in the developing eye (). Puc, a dual phosphatase, is the effector of JNK signaling and reflects activation status of the pathway Citation48,Citation67,Citation70. Downregulation of M1BP clearly activates JNK signaling as seen via evidences mentioned above. These results clearly suggest that a transcriptional pausing mechanism can regulate JNK signaling pathway. Furthermore, we performed MEME analysisCitation20,Citation71,Citation72, a bioinformatics approach to screen for potential M1BP binding sites (YGGTCACACTR) in JNK pathway members. There are five binding sites on puc indicating that M1BP can bind at these sites to suppress puc expression by transcriptional pausing (Supplementary Fig. 2).
We found that M1BP can repress JNK signaling in the developing eye (). Additionally, modulation of JNK signaling levels can affect M1BP loss-of-function phenotype. Thus, the transcriptional pausing function of M1BP suppresses JNK signaling to promote eye development (). Recently, wg has been reported as a putative target of M1BP with Motif1 sequences before the transcription start site (TSS) of wg Citation27. We used wg-lacZ reporter expression and Wg protein expression patterns that respectively corresponds to the transcriptional status and translational levels. We found that wg responds to the modulation of JNK signaling in the developing Drosophila eye (). Furthermore, alteration of JNK signaling in M1BP loss-of-function background affects wg expression, which is suggestive of the existence of feedback loop during eye development Citation57.
The evolutionarily conserved JNK signaling cascade, which can be triggered by various signals Citation70, is a key regulator of many cellular processes including proliferation, differentiation, and cell death Citation49. Several studies have shown that JNK is a hub for activating multiple modes of cell death including apoptosis as well as autophagy during development. Modulation of JNK signaling has been linked to organ size control of the wing, leg and antenna in Drosophila Citation73. Furthermore, our data reveals that JNK signaling is ectopically induced when M1BP is downregulated () and modulation of JNK result in modulation of the eye phenotype (). Thus, we assayed two important cell death pathways such as apoptosis and autophagy that are activated by the JNK pathway. While, the role of JNK is widely studied and known in activation of apoptosis and autophagy, here, we wanted to focus on its potential role in transcriptional pausing mechanism in regulating these two processes during development. The rationale was that M1BP can regulate JNK signaling. We found that M1BP’s downregulation phenotype of reduced eye or “no-eye” is due to induction of cell death as evident from the ectopic induction of apoptotic marker hid-GFP (). Surprisingly, not only caspase-dependent apoptosis alone but also caspase-independent autophagy is involved as evident from ectopic induction of autophagic marker Atg8a-mCherry (). We also validated the activation of autophagy in ey>M1BPRNAi background by detecting autophagosome-lysosome flux using tandem mCherry-GFP-Atg8a reporter. mCherry- and GFP marks the presence of autophagosomes, and GFP is used to monitor flux as it will get quenched in the acidic environment of the lysosome. Whereas mCherry, unaffected by the acid remains active until the protein is degraded. Downregulation of M1BP resulted in reduced GFP in acidic environment indicating autophagolysosome activation (Supplementary Fig. 3). We found that blocking either apoptosis () or autophagy () alone in ey>M1BPRNAi background rescued the “no-eye” phenotype in nearly 30% and 20% flies respectively. However, no complete rescue was observed in either scenario and frequency remained low. This led us to hypothesize that during development M1BP mediated transcriptional pausing of JNK regulates both caspase-dependent cell death and autophagy. To validate this hypothesis, we checked the levels of JNK pathway readout using pJNK levels. We observed pJNK levels similar to that of ey>M1BPRNAi when we downregulated either the levels of autophagy (ey>M1BPRNAi+Atg8a+/-) or apoptosis (ey>M1BPRNAi+hidRNAi or ey>M1BPRNAi+hidΔNCitation14). Since JNK signaling levels were not affected by modulation of either apoptosis or autophagy in ey>M1BPRNAi background suggests that JNK is upstream of both apoptosis as well as autophagy. Based on these results, we propose a model showing that M1BP regulates cell survival by suppressing JNK pathway levels which in turn triggers apoptosis and autophagy (). Therefore, the two distinct and independent cell homeostasis mechanisms are being commonly regulated by JNK signaling and can explain the compensatory relation between apoptosis and autophagy during development.
We also wanted to understand if these two cell death processes could be controlled simultaneously. Therefore, we blocked both caspase-dependent apoptosis and caspase-independent autophagy in a background where M1BP levels have been downregulated and found a significant rescue to near wild-type adult eye phenotypes in ~ 85% of flies (). Therefore, it is possible that a transcriptional pausing mechanism mediated through M1BP is required to suppress both apoptosis and autophagy by regulating the expression of both wg and JNK signaling in the developing Drosophila eye. There are several studies that demonstrate how apoptosis and autophagy are independently regulatedCitation10,Citation11,Citation49. In this study, we show for the first time how a common transcription pausing mechanism is regulating signaling components that can in turn regulate cellular homeostasis to suppress both autophagy and apoptosis. Also, we have provided multiple evidences for the activation of autophagy when M1BP is downregulated (). We have also shown the link of M1BP downregulation with JNK modulation ().
In order to understand if M1BP mediated regulation of cellular homeostasis through regulation of apoptosis and autophagy is seen in other tissues, we assayed the markers for cell death, autophagy, and JNK signaling in M1BP loss-of-function background in fly eye- and wing imaginal disc (Supplementary Fig. 4). Downregulation of M1BP in bi-Gal4 expression domain, which marks the pouch region of wing (bi>M1BPRNAi), results in ectopic pJNK, Dcp1, and Atg8a-mCherry expression in the pouch region of the wing imaginal disc. This finding suggests that the transcription pausing function of M1BP may have similar target(s) in the eye and wing imaginal discs.
In conclusion, here we describe the regulation of cellular homeostasis by a transcription pausing factor M1BP during development. Furthermore, the evidence for wg and JNK as targets of M1BP mediated regulation of cellular homeostasis is clear from our results, however, there are still flies that show the M1BP loss-of-function phenotype of reduced eye when both these processes are suppressed. It is based on the fact that both the extent of rescue as well as frequency of rescue phenotypes among the flies where both autophagy and apoptosis are blocked in ey>M1BPRNAi background, was significantly higher than when autophagy or apoptosis was blocked independently. However, the rescue was not complete. Therefore, it is possible that M1BP might be playing a role in modulating other mechanism(s) of cellular homeostasis. It is known that there are many other types of cellular homeostasis mechanisms. Since the current study has restricted only to the two common mechanisms, this warrants further research to explore the regulation achieved by transcriptional pausing mechanisms during development.
Several studies suggest that the regulatory mechanism in Pol II pausing during fly development are also conserved in higher organisms. Regulation of transcriptional elongation by positive or negative factors have been shown to have a role in maintaining cellular homeostasis Citation74. Since Drosophila genes are highly conserved in humans, results from this study can be extrapolated to the maintenance of cellular homeostasis in higher organisms. Additionally, JNK signaling and wg are known to play an important role in apoptosis and autophagy during development. While there are several signaling nodes that can trigger these cell death pathways, here we show that M1BP regulates both these processes in a JNK-dependent manner during development. Therefore, it is crucial to add to the existing research about how M1BP, a ubiquitously expressed transcriptional pausing factor, can regulate other signaling pathways to achieve optimum cellular homeostasis by suppressing autophagy. During normal eye development, autophagy is required to drive tissue heterogeneity and determine their structure. For example, in mammals, autophagy is required to produce the organelle free zone (OFZ) cells to form the transparent lens. Dysregulated autophagy has been associated with several ocular diseases like cataracts, corneal dystrophy, Glaucoma, diabetic retinopathy, age-related macular degeneration etc. Citation44,Citation75. Therefore, regulation of different types of cell death seems to be a conserved mechanism used by organisms.
Materials and methods
Fly stocks
Fly stocks used in this study are described in Flybase (http://flybase.bio.indiana.edu). We used Canton-S as wild-type, ey-Gal4 Citation76, and UAS-M1BPRNAi (BL41937) Citation24,Citation27. Other stocks used include UAS-junaspvCitation7 Citation77, an activated form of Drosophila jun, UAS-hepAct Citation78, an activated form of hep, UAS-bskDN, a dominant negative form of bsk Citation79, UAS-puc Citation48 a negative regulator of bsk, wg-lacZ Citation76, pucECitation69 Citation48, UAS-wgRNAi (BL31249, BL33902) Citation80, UAS-P35 Citation81, hid 5’F-WT GFP Citation58, UAS-hidRNAi (hidGD1673) (VDRC v8269) Citation82, UAS-hidΔNCitation14 Citation83, a N-terminal deletion construct lacks the sequences encoding the N-terminal DIAP1 binding domain that is required for proper hid function Citation83–85. Other stocks used were UAS-mCherry-Atg8a, and Atg8a1 mutant Citation86. Fly stocks were maintained at 25°C on regular cornmeal, yeast, molasses food medium.
Genetic crosses
The Gal4/UAS system was used to misexpress the gene of interest in a spatiotemporal manner Citation87. All crosses were maintained at 18°C and 25°C, unless specified, to check different induction levels Citation88. We have used the ey-Gal4 driver in this study to target misexpression of transgene(s) in the entire developing eye domain of larval eye-antennal imaginal disc.
Immunohistochemistry
Eye-antennal discs of wandering third instar larvae were dissected in 1X phosphate buffered saline (PBS), fixed in 4% paraformaldehyde in PBS (fixative) for 20 minutes and washed in PBST (three times). The tissues were stained using a combination of antibodies following the standard protocol Citation89,Citation90. Primary antibodies used were mouse anti-β-GAL (1:100; Developmental Studies Hybridoma Bank, DSHB); rabbit anti-pJNK (1:250; Cell Signaling Technologies, CST), rat anti-Elav (1:100), mouse anti-Wg (1:100; DSHB), mouse anti-Dlg (1:100, DSHB). Discs were washed in PBST thrice for 10 minutes each. Secondary antibodies used were donkey anti-rat IgG conjugated to Cy5 (1:250), donkey anti-rabbit IgG conjugated to Cy3 (1:300) or goat anti-mouse IgG conjugated to FITC (1:200) (Jackson Laboratories). Discs were mounted in Vectashield and photo-documented on a Fluoview 3000 Laser Scanning Confocal Microscope Citation57,Citation91. We took the images at 20X and 40X magnification unless stated otherwise. We analyzed and prepared the final figures using Adobe Photoshop CS6 software.
Quantification of intensity using Fiji/ ImageJ software
Fiji/ ImageJ software was used for quantification of intensity from images Citation59,Citation92. The split channel function was used to select the appropriate channel for analysis. ROI tool was used to select regions of a uniform area 100X100pixels boxes in the eye disc and measurements were obtained. Graphs were plotted using the mean intensity per unit area (µm2). The values were analyzed and plotted as mean +/- Standard Error of the Mean (SEM) using GraphPad Prism. For each genotype, 5 images were used to perform quantification.
Adult eye imaging
For capturing adult eye images, flies were first frozen at -20°C for ~4 hours. The flies were then mounted onto needles after removing the wings and legs and imaged at 10X magnification. The needle with the fly was embedded in a clay putty on a glass slide to stably position it to get the lateral view of the fly eye/head. Images were taken on a MrC5 color camera mounted on an Axioimager.Z1 Zeiss Apotome using a Z-sectioning function of Axiovision software 4.6.3 Citation27,Citation66,Citation93–95. The final images were prepared using Adobe Photoshop CS6 software.
Frequency of eye phenotype
Three independent sets of two hundred flies were screened (200 X 3= 600) and the frequency of eye phenotype(s) were calculated for each genetic cross. The eye phenotypes were categorized as no-eye, reduced-eye, or normal eye. Analyses were performed and graphs were plotted in GraphPad Prism.
Quantitative analyses of area of the eye
Image J software was used to quantify the area (µm2). The region of interest (ROI) was drawn along the perimeter of the adult eye and the surface area of the eye was measured and the graph was plotted in GraphPad Prism.
Real time quantitative PCR
60-80 eye-antennal imaginal discs were used for RNA isolation Citation96,Citation97. Tissue was collected and homogenized in TRIzol reagent (Invitrogen, Cat# 15596026). Total RNA in the aqueous phase was transferred to RNA Clean & Concentrator-5 (Zymo research, Cat# R1013) columns and eluted in about 15-20 µL DNase/RNase-free water. Quality and quantity of RNA was determined by Nanodrop 2000 spectrophotometer (Thermo Scientific). The cDNA was synthesized from 250 ng of total mRNA through Reverse Transcription reaction using first-strand cDNA synthesis kit (GE healthcare, Cat# 27926101). Real Time-qPCR was performed using BioRad iQ SYBR Green Supermix (Bio-Rad, Cat# 1708860) according to the standard protocol Citation96,Citation97. Fold change was calculated using comparative CT method (2−ΔΔCT method). The primers used were:
GAPDHFw5’-GGCGGATAAAGTAAATGTGTGC-3’
GAPDHRev5’-AGCTCCTCGTAGACGAACAT-3’
JnkFw5’-CCAACCGTCCGAAACTATGT-3’
JnkRev5’-CCGGCGGCTATTCTGATTATTA-3’
Atg8aFw5’- GGTCAGTTCTACTTCCTCATTCGC-3’ Citation62
Atg8aRev5’- ATAGTCCTCGTGATGTTCCTG-3’ Citation62
Western blotting
Entire adult fly heads were used for sample preparation from ey-Gal4 and ey>M1BPRNAi flies. Protein was extracted in 2X lamellae buffer in the presence of phosphatase band protease inhibitor using a standardized protocol Citation57,Citation98. The protein samples were resolved in a 10% gel and transferred onto a nitrocellulose membrane. The membrane was washed with 1X TBST, blocked in 5% w/v BSA in 1X TBST and incubated overnight at 4°C with primary antibody rabbit Phospho-SAPK/JNK (1:1000) (Cell Signaling Thr183/Tyr185) (81E11) antibody, rabbit anti-Atg8a (1:10000) (Millipore Sigma, Cat. # ABC974) and mouse anti-α-Tubulin antibody (1:12000) (SIGMA, Cat. # T5168) diluted in 5% w/v BSA in 1X TBST. After three washes with 1X PBST, the blot was incubated for 1hour in secondary antibody: horseradish peroxidase conjugated goat anti-rabbit IgG-HRP (1:5000) and goat anti-mouse IgG-HRP (1:5000) (Santa Cruz Biotechnology, Cat. # Sc-2005). Signal was detected using Horse Radish Peroxidase (HRP) conjugated goat anti–rabbit IgG using chemiluminescence substrate (LICOR). Images were captured using the LICOR Odyssey XF Imaging System. Empiria Studio software was used to quantify and normalize the signal. Relative pJNK levels were then statistically quantified and normalized by using LI-COR Image Studio lite 5.2 software and graph was plotted in GraphPad Prism.
Statistics
Statistical analysis was performed using GraphPad Prism. For all eye frequency data, multiple genotypes with subgroups were compared with each other using 2-way ANOVA. Statistical comparisons with eyGal4 and ey>M1BPRNAi were depicted using # and * respectively. For mean integrated intensity quantification data, we have used one-way ANOVA to compare >2 groups. Comparison between two groups was performed using Mann-Whitney test. Graphs were plotted as mean +/- SEM with the individual values. The error bars represent Standard error from mean (SEM). Statistical significance is set at 95% CI and is shown by p-value: **** P<0.0001; *** P<0.001; ** P<0.01; * P<0.05.
Authors Contributions
AS designed the study. AVC and HD performed experiments. AS contributed resources. AVC, HD, AR, MKS and AS analyzed the data. AVC, AR, MKS and AS wrote the manuscript with input from all authors. All authors read and approved the final manuscript.
Conflict of Interests
The authors declare no competing interests.
Supplemental Material
Download ()Acknowledgments
We thank the Bloomington Drosophila Stock Center (BDSC) for the Drosophila strains and DSHB for antibodies used in this study. We thank Aditi Singh, members of the Singh lab and Kango-Singh lab for their insightful feedback on this manuscript. Confocal microscopy was supported by the University of Dayton Biology Department core facility.
Supplementary material
Supplemental data for this article can be accessed online at https://doi.org/10.1080/27694127.2023.2252307.
Additional information
Funding
References
- Wang MF, Hunter MV, Wang G, McFaul C, Yip CM, Fernandez-Gonzalez R. Automated cell tracking identifies mechanically oriented cell divisions during Drosophila axis elongation. Development 2017; 144:1350–32.
- Gulati GS, Sikandar SS, Wesche DJ, Manjunath A, Bharadwaj A, Berger MJ, et al. Single-cell transcriptional diversity is a hallmark of developmental potential. Science 2020; 367:405–11.
- Bernstein BE, Mikkelsen TS, Xie X, Kamal M, Huebert DJ, Cuff J, et al. A bivalent chromatin structure marks key developmental genes in embryonic stem cells. Cell 2006; 125:315–26.
- White KP, Rifkin SA, Hurban P, Hogness DS. Microarray analysis of Drosophila development during metamorphosis. Science 1999; 286:2179–84.
- Sbodio JI, Snyder SH, Paul BD. Transcriptional control of amino acid homeostasis is disrupted in Huntington’s disease. Proc Natl Acad Sci U S A 2016; 113:8843–8.
- Vihervaara A, Sergelius C, Vasara J, Blom MA, Elsing AN, Roos-Mattjus P, et al. Transcriptional response to stress in the dynamic chromatin environment of cycling and mitotic cells. Proc Natl Acad Sci U S A 2013; 110:E3388–97.
- Vaux DL, Korsmeyer SJ. Cell death in development. Cell 1999; 96:245–54.
- Ryoo HD, Baehrecke EH. Distinct death mechanisms in Drosophila development. Curr Opin Cell Biol 2010; 22:889–95.
- Buss RR, Sun W, Oppenheim RW. Adaptive roles of programmed cell death during nervous system development. Annu Rev Neurosci 2006; 29:1–35.
- Galluzzi L, Vitale I, Aaronson SA, Abrams JM, Adam D, Agostinis P, et al. Molecular mechanisms of cell death: recommendations of the Nomenclature Committee on Cell Death 2018. Cell Death Differ 2018; 25:486–541.
- Galluzzi L, Baehrecke EH, Ballabio A, Boya P, Bravo-San Pedro JM, Cecconi F, et al. Molecular definitions of autophagy and related processes. EMBO J 2017; 36:1811–36.
- Arakawa S, Tsujioka M, Yoshida T, Tajima-Sakurai H, Nishida Y, Matsuoka Y, et al. Role of Atg5-dependent cell death in the embryonic development of Bax/Bak double-knockout mice. Cell Death Differ 2017; 24:1598–608.
- Denton D, Kumar S. Autophagy-dependent cell death. Cell Death Differ 2019; 26:605–16.
- Margaritis T, Holstege FC. Poised RNA polymerase II gives pause for thought. Cell 2008; 133:581–4.
- Li J, Gilmour DS. Promoter proximal pausing and the control of gene expression. Curr Opin Genet Dev 2011; 21:231–5.
- Gilchrist DA, Fromm G, dos Santos G, Pham LN, McDaniel IE, Burkholder A, et al. Regulating the regulators: the pervasive effects of Pol II pausing on stimulus-responsive gene networks. Genes Dev 2012; 26:933–44.
- Gaertner B, Zeitlinger J. RNA polymerase II pausing during development. Development 2014; 141:1179–83.
- Grossman SR, Engreitz J, Ray JP, Nguyen TH, Hacohen N, Lander ES. Positional specificity of different transcription factor classes within enhancers. Proc Natl Acad Sci U S A 2018; 115:E7222–E30.
- Fujita T, Schlegel W. Promoter-proximal pausing of RNA polymerase II: an opportunity to regulate gene transcription. J Recept Signal Transduct Res 2010; 30:31–42.
- Ohler U, Wassarman DA. Promoting developmental transcription. Development 2010; 137:15–26.
- Larson MH, Mooney RA, Peters JM, Windgassen T, Nayak D, Gross CA, et al. A pause sequence enriched at translation start sites drives transcription dynamics in vivo. Science 2014; 344:1042–7.
- Adelman K, Lis JT. Promoter-proximal pausing of RNA polymerase II: emerging roles in metazoans. Nat Rev Genet 2012; 13:720–31.
- Zeitlinger J, Stark A, Kellis M, Hong J-W, Nechaev S, Adelman K, et al. RNA polymerase stalling at developmental control genes in the Drosophila melanogaster embryo. Nature genetics 2008; 39:1512–6.
- Li J, Gilmour DS. Distinct mechanisms of transcriptional pausing orchestrated by GAGA factor and M1BP, a novel transcription factor. Embo j 2013; 32:1829–41.
- Barthez M, Poplineau M, El-Refaey M, Caruso N, Graba Y, Saurin A. Human ZKSCAN3 and Drosophila M1BP are functionally homologous transcription factors in autophagy regulation. 2019.
- Chung H-R, Schäfer U, Jäckle H, Böhm S. Genomic expansion and clustering of ZAD-containing C2H2 zinc-finger genes in Drosophila. EMBO reports 2003; 3:1158–62.
- Raj A, Chimata AV, Singh A. Motif 1 Binding Protein suppresses wingless to promote eye fate in Drosophila. Sci Rep 2020; 10:17221.
- Singh A, Shi X, Choi K-W. Lobe and Serrate are required for cell survival during early eye development in Drosophila. Development 2006; 133:4771.
- Singh A. Neurodegeneration- A Means to an End. J Cell Science & Therapy 2012; 3:10000e107.
- Hengartner MO. The biochemistry of apoptosis. Nature 2000; 407:770–6.
- Chen P, Nordstrom W, Gish B, Abrams JM. grim, a novel cell death gene in Drosophila. Genes Dev 1996; 10:1773–82.
- Grether ME, Abrams JM, Agapite J, White K, Steller H. The head involution defective gene of Drosophila melanogaster functions in programmed cell death. Genes Dev 1995; 9:1694–708.
- White K, Grether ME, Abrams JM, Young L, Farrell K, Steller H. Genetic control of programmed cell death in Drosophila. Science 1994; 264:677–83.
- Holley CL, Olson MR, Colon-Ramos DA, Kornbluth S. Reaper eliminates IAP proteins through stimulated IAP degradation and generalized translational inhibition. Nat Cell Biol 2002; 4:439–44.
- Yoo SJ, Huh JR, Muro I, Yu H, Wang L, Wang SL, et al. Hid, Rpr and Grim negatively regulate DIAP1 levels through distinct mechanisms. Nat Cell Biol 2002; 4:416–24.
- Xu D, Woodfield SE, Lee TV, Fan Y, Antonio C, Bergmann A. Genetic control of programmed cell death (apoptosis) in Drosophila. Fly (Austin) 2009; 3:78–90.
- Barthez M, Poplineau M, Elrefaey M, Caruso N, Graba Y, Saurin AJ. Human ZKSCAN3 and Drosophila M1BP are functionally homologous transcription factors in autophagy regulation. Sci Rep 2020; 10:9653.
- Bag I, Chen S, Rosin LF, Chen Y, Liu CY, Yu GY, et al. M1BP cooperates with CP190 to activate transcription at TAD borders and promote chromatin insulator activity. Nat Commun 2021; 12:4170.
- Das G, Shravage BV, Baehrecke EH. Regulation and function of autophagy during cell survival and cell death. Cold Spring Harb Perspect Biol 2012; 4.
- Shpilka T, Weidberg H, Pietrokovski S, Elazar Z. Atg8: an autophagy-related ubiquitin-like protein family. Genome Biol 2011; 12:226.
- He C, Klionsky DJ. Regulation mechanisms and signaling pathways of autophagy. Annu Rev Genet 2009; 43:67–93.
- Larkin A, Marygold SJ, Antonazzo G, Attrill H, Dos Santos G, Garapati PV, et al. FlyBase: updates to the Drosophila melanogaster knowledge base. Nucleic Acids Res 2021; 49:D899–D907.
- Mauvezin C, Ayala C, Braden CR, Kim J, Neufeld TP. Assays to monitor autophagy in Drosophila. Methods 2014; 68:134–9.
- Villarejo-Zori B, Jimenez-Loygorri JI, Zapata-Munoz J, Bell K, Boya P. New insights into the role of autophagy in retinal and eye diseases. Mol Aspects Med 2021; 82:101038.
- Adachi-Yamada T, O’Connor MB. Mechanisms for removal of developmentally abnormal cells: cell competition and morphogenetic apoptosis. J Biochem 2004; 136:13–7.
- Igaki T. Correcting developmental errors by apoptosis: lessons from Drosophila JNK signaling. Apoptosis 2009; 14:1021–8.
- Igaki T, Miura M. The Drosophila TNF ortholog Eiger: emerging physiological roles and evolution of the TNF system. Semin Immunol 2014; 26:267–74.
- Martín-Blanco E, Gampel A, Ring J, Virdee K, Kirov N, Tolkovsky AM, et al. puckered encodes a phosphatase that mediates a feedback loop regulating JNK activity during dorsal closure in Drosophila. Genes Dev 1998; 12:557–70.
- Dhanasekaran DN, Reddy EP. JNK-signaling: A multiplexing hub in programmed cell death. Genes Cancer 2017; 8:682–94.
- Ready DF, Hanson TE, Benzer S. Development of the Drosophila retina, a neurocrystalline lattice. Dev Biol 1976; 53:217–40.
- Poulson DF. Histogenesis, oogenesis, and differentiation in the embryo of Drosophila melanogaster meigen. In: Demerec M, ed. Biology of Drosophila. New York: Wiley, 1950:168–274.
- Kumar J. Catching the next wave: patterning of the Drosophila eye by the morphogenetic furrow. In: Singh AaK-S, Madhuri, ed. In Molecular genetics of axial patterning, growth and disease in the Drosophila eye. NewYork: Springer, 2013:75–97.
- Kumar JP. Catching the Next Wave: Patterning of the Drosophila Eye by the Morphogenetic Furrow. In: Singh AaK-S, Madhuri, ed. In Molecular genetics of axial patterning, growth and disease in the Drosophila eye. NewYork: Springer, 2020:97–120.
- Ma C, Moses K. Wingless and patched are negative regulators of the morphogenetic furrow and can affect tissue polarity in the developing Drosophila compound eye. Development 1995; 121:2279–89.
- Treisman JE, Rubin GM. wingless inhibits morphogenetic furrow movement in the Drosophila eye disc. Development 1995; 121:3519–27.
- Wittkorn E, Sarkar A, Garcia K, Kango-Singh M, Singh A. The Hippo pathway effector Yki downregulates Wg signaling to promote retinal differentiation in the Drosophila eye. Development 2015; 142:2002–13.
- Tare M, Sarkar A, Bedi S, Kango-Singh M, Singh A. Cullin-4 regulates Wingless and JNK signaling-mediated cell death in the Drosophila eye. Cell Death Dis 2016; 7:e2566.
- Tanaka-Matakatsu M, Xu J, Cheng L, Du W. Regulation of apoptosis of rbf mutant cells during Drosophila development. Dev Biol 2009; 326:347–56.
- Deshpande P, Gogia N, Chimata AV, Singh A. Unbiased automated quantitation of ROS signals in live retinal neurons of Drosophila using Fiji/ImageJ. Biotechniques 2021; 71:416–24.
- Nagy P, Varga A, Kovacs AL, Takats S, Juhasz G. How and why to study autophagy in Drosophila: it’s more than just a garbage chute. Methods 2015; 75:151–61.
- Nezis IP, Vaccaro MI, Devenish RJ, Juhasz G. Autophagy in development, cell differentiation, and homeodynamics: from molecular mechanisms to diseases and pathophysiology. Biomed Res Int 2014; 2014:349623.
- Billes V, Kovacs T, Manzeger A, Lorincz P, Szincsak S, Regos A, et al. Developmentally regulated autophagy is required for eye formation in Drosophila. Autophagy 2018; 14:1499–519.
- Cordero J, Jassim O, Bao S, Cagan R. A role for wingless in an early pupal cell death event that contributes to patterning the Drosophila eye. Mech Dev 2004; 121:1523–30.
- Bonini NM, Fortini ME. Surviving Drosophila eye development: integrating cell death with differentiation during formation of a neural structure. Bioessays 1999; 21:991–1003.
- Perrotta C, Cattaneo MG, Molteni R, De Palma C. Autophagy in the Regulation of Tissue Differentiation and Homeostasis. Front Cell Dev Biol 2020; 8:602901.
- Irwin M, Tare M, Singh A, Puli OR, Gogia N, Riccetti M, et al. A Positive Feedback Loop of Hippo- and c-Jun-Amino-Terminal Kinase Signaling Pathways Regulates Amyloid-Beta-Mediated Neurodegeneration. Front Cell Dev Biol 2020; 8:117.
- Tare M, Modi RM, Nainaparampil J, Puli OR, Bedi S, Fernandez-Funez P, et al. Activation of JNK Signaling Mediates Amyloid-ß-Dependent Cell Death. PLOS ONE 2011; 6:e24361.
- Muse GW, Gilchrist DA, Nechaev S, Shah R, Parker JS, Grissom SF, et al. RNA polymerase is poised for activation across the genome. Nat Genet 2007; 39:1507–11.
- Levine M. Paused RNA polymerase II as a developmental checkpoint. Cell 2011; 145:502–11.
- Weston CR, Davis RJ. The JNK signal transduction pathway. Curr Opin Cell Biol 2007; 19:142–9.
- Bailey TL, Boden M, Buske FA, Frith M, Grant CE, Clementi L, et al. MEME SUITE: tools for motif discovery and searching. Nucleic Acids Res 2009; 37:W202–8.
- Bailey TL, Gribskov M. Combining evidence using p-values: application to sequence homology searches. Bioinformatics 1998; 14:48–54.
- Willsey HR, Zheng X, Carlos Pastor-Pareja J, Willsey AJ, Beachy PA, Xu T. Localized JNK signaling regulates organ size during development. Elife 2016; 5.
- Liu P, Xiang Y, Fujinaga K, Bartholomeeusen K, Nilson KA, Price DH, et al. Release of positive transcription elongation factor b (P-TEFb) from 7SK small nuclear ribonucleoprotein (snRNP) activates hexamethylene bisacetamide-inducible protein (HEXIM1) transcription. J Biol Chem 2014; 289:9918–25.
- Frost LS, Mitchell CH, Boesze-Battaglia K. Autophagy in the eye: implications for ocular cell health. Exp Eye Res 2014; 124:56–66.
- Hazelett DJ, Bourouis M, Walldorf U, Treisman JE. decapentaplegic and wingless are regulated by eyes absent and eyegone and interact to direct the pattern of retinal differentiation in the eye disc. Development 1998; 125:3741–51.
- Treier M, Bohmann D, Mlodzik M. JUN cooperates with the ETS domain protein pointed to induce photoreceptor R7 fate in the Drosophila eye. Cell 1995; 83:753–60.
- Glise B, Bourbon H, Noselli S. hemipterous encodes a novel Drosophila MAP kinase kinase, required for epithelial cell sheet movement. Cell 1995; 83:451–61.
- Adachi-Yamada T, Fujimura-Kamada K, Nishida Y, Matsumoto K. Distortion of proximodistal information causes JNK-dependent apoptosis in Drosophila wing. Nature 1999; 400:166–9.
- Ni JQ, Markstein M, Binari R, Pfeiffer B, Liu LP, Villalta C, et al. Vector and parameters for targeted transgenic RNA interference in Drosophila melanogaster. Nat Methods 2008; 5:49–51.
- Hay BA, Wolff T, Rubin GM. Expression of baculovirus P35 prevents cell death in Drosophila. Development 1994; 120:2121–9.
- Dietzl G, Chen D, Schnorrer F, Su KC, Barinova Y, Fellner M, et al. A genome-wide transgenic RNAi library for conditional gene inactivation in Drosophila. Nature 2007; 448:151–6.
- Bhogal B, Plaza-Jennings A, Gavis ER. Nanos-mediated repression of hid protects larval sensory neurons after a global switch in sensitivity to apoptotic signals. Development 2016; 143:2147–59.
- Vucic D, Kaiser WJ, Miller LK. Inhibitor of apoptosis proteins physically interact with and block apoptosis induced by Drosophila proteins HID and GRIM. Mol Cell Biol 1998; 18:3300–9.
- Haining WN, Carboy-Newcomb C, Wei CL, Steller H. The proapoptotic function of Drosophila Hid is conserved in mammalian cells. Proc Natl Acad Sci U S A 1999; 96:4936–41.
- Shukla AK, Spurrier J, Kuzina I, Giniger E. Hyperactive Innate Immunity Causes Degeneration of Dopamine Neurons upon Altering Activity of Cdk5. Cell Rep 2019; 26:131–44 e4.
- Brand AH, Perrimon N. Targeted gene expression as a means of altering cell fates and generating dominant phenotypes. Development 1993; 118:401–15.
- Singh A, Chan J, Chern JJ, Choi KW. Genetic interaction of Lobe with its modifiers in dorsoventral patterning and growth of the Drosophila eye. Genetics 2005; 171:169–83.
- Singh A, Kango-Singh M, Sun YH. Eye suppression, a novel function of teashirt, requires Wingless signaling. Development 2002; 129:4271–80.
- Tare M, Chimata AV, Gogia N, Narwal S, Deshpande P, Singh A. An E3 ubiquitin ligase, cullin-4 regulates retinal differentiation in Drosophila eye. Genesis 2020; 58:e23395.
- Steffensmeier AM, Tare M, Puli OR, Modi R, Nainaparampil J, Kango-Singh M, et al. Novel neuroprotective function of apical-basal polarity gene crumbs in amyloid beta 42 (aβ42) mediated neurodegeneration. PLoS One 2013; 8:e78717.
- Chimata AV, Deshpande P, Mehta AS, Singh A. Protocol to study cell death using TUNEL assay in Drosophila imaginal discs. STAR Protoc 2022; 3:101140.
- Mehta AS, Deshpande P, Chimata AV, Tsonis PA, Singh A. Newt regeneration genes regulate Wingless signaling to restore patterning in Drosophila eye. iScience 2021; 24:103166.
- Gogia N, Sarkar A, Mehta AS, Ramesh N, Deshpande P, Kango-Singh M, et al. Inactivation of Hippo and cJun-N-terminal Kinase (JNK) signaling mitigate FUS mediated neurodegeneration in vivo. Neurobiol Dis 2020; 140:104837.
- Cutler T, Sarkar A, Moran M, Steffensmeier A, Puli OR, Mancini G, et al. Drosophila Eye Model to Study Neuroprotective Role of CREB Binding Protein (CBP) in Alzheimer’s Disease. PloS one 2015; 10:e0137691–e.
- Mehta AS, Luz-Madrigal A, Li JL, Panagiotis TA, Singh A. Total RNA extraction from transgenic flies misexpressing foreign genes to perform Next generation RNA sequencing. protocols io 2019:1–3.
- Mehta A, Singh A. Real time quantitative PCR to demonstrate gene expression in an undergraduate lab. Dros Inf Serv 2017; 100:5.
- Gogia N, Sarkar A, Singh A. An undergraduate cell biology lab: Western Blotting to detect proteins from Drosophila eye. Dros Inf Serv 2017; 100:218–25.