
ABSTRACT
Epithelial cells transport substances through the cellular and paracellular pathways. The last one depends on tight junctions, particularly on claudins, the family of integral membrane proteins responsible for the permeability and selectivity of these junctions. 300 nM ouabain (OUA) induces endocytosis and lysosomal degradation of claudin-2 and -4 in an Src and ERK1/2 kinases-dependent manner. Here we investigate whether OUA-induced lysosomal degradation of claudins implicates autophagy in renal epithelial Madin-Darby canine kidney cells. During autophagy, LC3 protein binds phosphatidylethanolamine and incorporates, together with protein p62, into the phagophore. Subsequently, the autolysosome degrades both LC3 and p62 proteins. OUA’s occupancy of its site in the Na⁺/K⁺ATPase (300 nM, 10 h) increases autophagic flux because of degradation of LC3 and p62 and an increase in the number of autophagosomes, as detected by fluorescent LC3 and p62 puncta and the rise in autolysosomes seen by the GFP-LC3-RFP probe. Finally, OUA increases the colocalisation of claudin-1, -2, or -4 with p62 in these puncta. OUA induces autophagy increasing reactive oxygen species generation that activates AMP-activated protein kinase, phosphorylating ULK1 at S555. The autophagy inducer rapamycin causes a degradation of the studied claudins comparable to the one generated by OUA. Furthermore, the autophagy inhibitor dorsomorphin blocks OUA-induced autophagy and claudin-1, -2, and -4 degradation. These results demonstrated that OUA induces claudin-1, -2, and -4 autophagy through oxidative stress.
Abbreviations: AMP: adenosine monophosphate; AMPK: AMP-activated protein kinase; ATP: Adenosine triphosphate; DM: dorsomorphin; EGFR: epidermal growth factor receptor; ERK: extracellular signal-regulated kinase; GAPDH: glyceraldehyde-3-phosphate dehydrogenase; LC3: microtubule-associated protein 1A/1B-light chain 3; MDCK: Madin-Darby canine kidney; mTOR: mammalian target of rapamycin; NAC: N-acetylcysteine; OUA: ouabain; PCC: Pearson’s correlation coefficient; PE: phosphatidylethanolamine, Rapa: rapamycin; ROS: reactive oxygen species; SNK: Student–Newman–Keuls; TER: transepithelial electrical resistance; TJs: tight junctions; ULK1: Unc-51-like kinase 1.
Introduction
Macroautophagy/autophagy is a cytosolic degradative process triggered by stress conditions, such as nutrient deprivation, hypoxia, and oxidative stress [Citation1-3]. These conditions activate the AMP-activated protein kinase (AMPK), the cellular energy sensor that initiates autophagy by inhibiting the mammalian target of rapamycin kinase (mTOR) and activating Unc-51-like kinase 1 (ULK1 [Citation4,Citation5]); thus, promoting the formation of the autophagy initiation complex that, in turn, induces the genesis of a double membrane organelle known as phagophore from the membrane of the rough endoplasmic reticulum. As the phagophore elongates, it engulfs cytosolic components such as protein aggregates and damaged organelles, regulating cell homoeostasis [Citation6]. For this elongation, cytosolic LC3-I (microtubule-associated protein light chain 3) must conjugate with phosphatidylethanolamine (PE) to form LC3-II. This LC3 protein form attaches to the phagophore membrane [Citation7]. In the nascent phagophores, LC3-II recruits the p62/SQSTM1 (sequestosome 1) receptor, which, in turn, captures ubiquitinated proteins destined for autophagy. The phagophores then close their membranes to form the autophagosome. This double membrane organelle fuses with the lysosome, forming the autolysosome, where all the autophagosome content and components are degraded, including LC3-II and p62. Alterations in autophagy have been implicated in numerous diseases, such as cancer, neurodegenerative disorders, and viral infections [Citation8]. However, little is known about the regulation of autophagy upon the renal epithelial tight junctions (TJs).
TJ and apical/basolateral cell polarity are the critical differentiated characteristics of epithelia [Citation9]. Renal TJ are crucial in concentrating the glomerular filtrate to transform it into urine through the reabsorption or secretion of metabolites, ions, and water. Epithelia, including the renal one, transport substances through the transcellular or the paracellular pathways [Citation9]; the transcellular pathway relays on channels, pumps, and carriers to transport substances across the plasma membrane and the paracellular pathway depends on TJ. These structures are protein complexes expressed at the most apical region of the lateral membrane of epithelial cells and consist of membrane-associated and integral proteins. Claudin is a family of TJ proteins with four transmembrane domains that obliterate the extracellular space because of binding with claudins of neighbour cells. These proteins form paracellular channels with a characteristic selectivity and permeability, depending on the type of claudin expressed [Citation10]. The paracellular permeability is measured through the transepithelial electrical resistance (TER [Citation11,Citation12]) and adjusts according to physiological requirements, pharmacological challenges, and pathological and environmental conditions. Thus, if a given epithelium expresses claudin-1 and claudin-4, both known as barrier-forming claudins, it forms a paracellular barrier with high TER values; on the other hand, if the epithelium expresses claudin-2, a pore-forming claudin, it acquires a leaky phenotype with low TER due to the formation of paracellular channels that transport substantial amounts of cations, mainly Na+, and water [Citation10,Citation13].
In previous works, we have demonstrated that the prototypical cardiotonic steroid ouabain (OUA) regulates the expression of claudins in renal epithelial Madin-Darby canine kidney (MDCK) cells. This cardiotonic steroid, originally extracted from plants (Strophanthus gratus and Acokanthera ouabaio), is a therapeutic substance to treat cardiac arrhythmia and congestive heart failure [Citation14]. OUA is also found in human plasma [Citation15] and urine. It is described as a hormone released from the adrenal glands and the hypothalamus [Citation16,Citation17] that participates in salt-sensitive hypertension, salt handling in the kidney, and sodium homoeostasis [Citation18-20]. It exerts these effects by inhibiting the Na⁺/K⁺-ATPase that transports Na⁺ from the cell’s interior to the media and K⁺ in the opposite direction, driven by ATP hydrolysis. Besides inhibiting transport, OUA occupancy of its binding site in the ⍺-subunit of the Na⁺/K⁺-ATPase triggers a variety of signalling pathways that regulate cell proliferation, hypertrophy, apoptosis [Citation20,Citation21], cell migration [Citation22], and adhesion [Citation23]. These pathways include Src kinase, extracellular signal-regulated protein kinases 1 and 2 (ERK 1/2), the inositol 1,4,5-tris-phosphate receptor (IP3R), the nuclear factor kappa B (NF-κB), and reactive oxygen species (ROS) release, among others [Citation24-29].
We also demonstrated that OUA regulates TJ in two contrary ways, depending on the concentration of OUA used: at low concentrations (10 nM), it induces the expression of claudin-1, -2, and -4, increasing TER [Citation30], and it also accelerates collective cell migration [Citation22] and the development of cell polarity, as indicated by the development of the major cilium [Citation31]; at high concentrations (300 nM), OUA induces the formation of a signalosome that includes the Na⁺/K⁺-ATPase, Src kinase, and the epidermal growth factor receptor (EGFR [Citation27]). Src complexed with the Na⁺/K⁺-ATPase transactivates EGFR that, in turn, activates the ERK 1/2 kinases. The activation of these kinases promotes clathrin and dynamin-dependent endocytosis of claudin-2 and -4 and their subsequent lysosomal degradation, resulting in a continuous decrement of TER to zero level in the first place and the coincident detachment of cells from each other and finally, from the substrate with subsequent cell death [Citation23,Citation32]. Since lysosomes are the main degradative cellular organelles closely related to autophagy, we are interested in investigating whether autophagy participates in this process and if it has a role in claudins’ proteostasis regulation.
Results
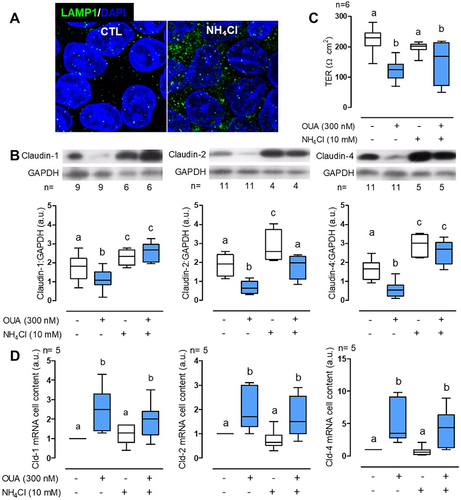
Ouabain promotes claudin-1, -2, and -4 lysosomal degradation
We have demonstrated previously that claudin-2 and -4 undergo lysosomal degradation upon OUA incubation [Citation32]. We now extend this result to claudin-1, incubating mature MDCK confluent monolayers for 10 h in the presence or absence of OUA (300 nM), with or without NH₄Cl (10 mM), which inhibits lysosomal function by promoting its alkalinisation and increase LAMP1 fluorescence signal (). OUA decreased a 34%, 65%, and 62% and, in contrast, NH₄Cl increased by 31%, 49%, and 80% the cell content of claudin-1, -2, and -4, respectively (). The latter results demonstrate that cells degrade claudins in lysosomes in basal conditions. Interestingly, claudin-1 and -4 abundance exhibited no significant difference between the NH₄Cl alone or in combination with OUA, evidencing lysosomal degradation impairment; however, for claudin-2, the results show a different behaviour: OUA decreased its cell content even in the presence of NH₄Cl, although at a higher level as OUA alone (). Furthermore, NH₄Cl inhibited claudins degradation, without affecting TER in control cells, nor impairing OUA effect (). That indicates that NH₄Cl only exerts an effect on claudins’ degradation but not in their endocytosis. Additionally, we confirmed that OUA increased claudin-4 mRNA and extended the result to claudin-1 and -2, while NH₄Cl does not have an effect ().
Figure 1. OUA promotes claudin-1, -2, and -4 lysosomal degradation. a) LAMP1 immunofluorescence of MDCK incubated without (CTL) or with 10 mM NH₄Cl for 10 h, showing the typical increase in inhibited lysosomes’ signal. b) Claudins cell content in MDCK cells incubated as indicated above, in the presence or absence of OUA (300 nM); graphs represent the densitometric analysis in arbitrary units (a.u.) in control (white boxes) or OUA-containing media (cyan boxes); representative immunoblots are shown above. c) TER, and d) mRNA levels of claudins in the same conditions as b. The difference among groups was analysed by one-way ANOVA followed by the Student–Newman–Keuls (SNK). Groups not different from each other are marked by the same letter.
Lysosomes are the main degradative hub in the cells to which several pathways converge: the endosomal route, where early endosomes mature into late endosomes or multivesicular bodies that fuse with lysosomes; the microautophagy pathway, characterised by lysosomes engulfment of cytosolic proteins, and macroautophagy, commonly referred as autophagy, characterised by the formation of autophagosomes that fuses with lysosomes [Citation33,Citation34]. For this reason, the demonstration that lysosome inhibition precludes protein degradation is a requirement but not strong proof of autophagy involvement. Therefore, proving the autophagy mechanism in protein degradation requires evaluating colocalisation and abundance with appropriate markers.
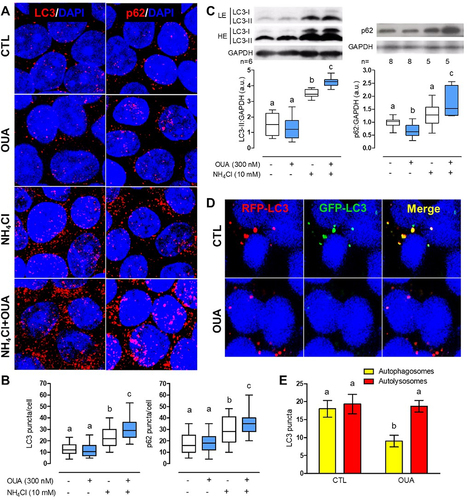
Ouabain increases autophagy flux
We analysed the immunofluorescence of autophagy markers LC3 and p62 in MDCK cells incubated for 6 h in the above experimental conditions. When these proteins recruit into an autophagosome, they generate a fluorescent staining pattern of structures called puncta, better visualised after incubation with NH₄Cl to prevent degradation. OUA by itself does not significantly change the number of LC3 or p62 puncta because as autophagosomes are formed, they are being degraded; however, in the presence of NH₄Cl, OUA increased the number of LC3 puncta 32% in comparison with NH₄Cl alone, and 132% versus control, while p62 puncta increased 20% and 102%, respectively (). Moreover, we analysed these markers’ cell content in MDCK cells incubated for 10 h with or without OUA and NH₄Cl (). The amount of LC3-II reflects the number of autophagosomes and hence the autophagy flux activity. However, to distinguish LC3-II accumulation by autophagic induction or lysosome impairment, we measure autophagy markers in the presence and absence of NH₄Cl [Citation35]. OUA did not significantly affect LC3 II content because it degraded after generation. In contrast, in the presence of NH₄Cl, OUA increased it by 21% compared with NH₄Cl alone and 180% versus CTL; this evidences LC3 activation and degradation impairment given by lysosome inhibition. OUA induced p62 30% degradation, which is also accumulated under lysosome inhibition by 37% versus NH₄Cl alone and 77% versus CTL (). Furthermore, we transfected MDCK cells with the plasmid GFP-LC3-RFP tandem probe and evaluated the fluorescence after 6 h of incubation with OUA. This plasmid lets us differentiate between autophagosomes and autolysosomes: when LC3 is in the former, both RFP and GFP signals colocalise and will generate yellow dots; however, when autophagosomes fuse with lysosomes, pH decreases, which leads to the quenching of the sensible pH fluorescence of GFP; hence, autolysosomes are visualised just as red dots. OUA promotes the progression of autophagosomes to autolysosomes, as seen by a 50% reduction of the former, while autolysosomes do not necessarily increase due to degradation (). All these results confirm that OUA increases autophagy flux.
Figure 2. OUA increases autophagy flux. MDCK cells were incubated for 6 h in the presence or absence of OUA (300 nM) with or without NH₄Cl (10 mM), an inhibitor of lysosomal function. A) Representative immunofluorescences of LC3 and p62 puncta. B) LC3 and p62 puncta quantification per cell, 90 cells evaluated per condition. C) MDCK cells were incubated for 10 h in the presence or absence of OUA (300 nM) with or without NH₄Cl (10 mM), and we evaluated LC3 and p62 cell content. Graphs represent the densitometric analysis in a.u. Representative immunoblots are shown above. High exposure (HE) and low exposure (LE) representative immunoblots were used to analyse properly markers’ proteins exhibiting low and high signals, respectively. D) MDCK cells were transfected with the plasmid GFP-LC3-RFP tandem probe and incubated with or without OUA for 6 h. Representative fluorescence is shown. The yellow signal represents the autophagosomes, while the red represents the autolysosomes. E) Number of autophagosomes and autolysosomes calculated from d, 50 cells evaluated per condition.
Ouabain induces claudin-1, -2, and -4 autophagic degradation
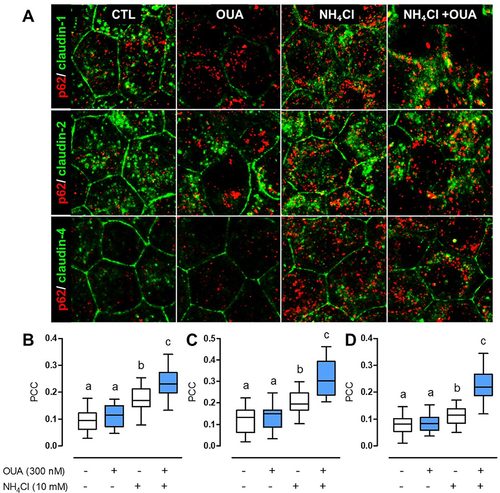
Next, we investigated whether OUA induces claudin’s autophagy. If this were the case, claudins undergoing degradation most localise in the autophagosome and, therefore, colocalise with p62. In MDCK cells incubated for 6 h in the usual experimental conditions, claudins localise at TJs in a classical honeycomb pattern in control and NH₄Cl conditions ( CTL, green), while p62 stains intracellular puncta that correspond to autophagosomes (, red [Citation35]). OUA induced the endocytosis of claudin-1, -2, and -4, increasing their intracellular localisation. NH₄Cl increased claudins colocalisation with p62 at intracellular puncta (, yellow) because it inhibits their degradation. The combination of NH₄Cl+OUA increases even more claudins colocalisation with p62. Pearson’s correlation coefficient (PCC) analysis shows that OUA in the presence of NH₄Cl increased the colocalisation of claudin-1 with p62 by 36% in comparison with NH₄Cl alone and 148% versus CTL, while claudin-2 colocalisation increased by 57% and 158%, respectively, and claudin-4 increased by 97% versus NH₄Cl and 182% versus CTL (). This coefficient shows how much a protein colocalises with the other [Citation36] and demonstrates that claudins increase its colocalisation with p62 upon OUA treatment. It would be interesting to evaluate if there is any direct interaction among them. All these results confirm that OUA promotes claudin-1, -2, and -4 autophagy.
Figure 3. OUA induces the colocalisation of claudin-1, -2, and -4 with p62. MDCK cells were incubated for 10 h in the presence or absence of OUA (300 nM), with or without NH₄Cl (10 mM). A) Representative immunofluorescence images showing p62 staining in red puncta and claudins in green. Colocalisation is seen as yellow dots. PCC was calculated as a colocalisation analysis for the correlation between p62 and B) Claudin-1, C) Claudin-2, and D) Claudin-4 per cell, 40 cells evaluated per condition.
Autophagy regulates claudin-1, -2, and -4 cell content
Knowing that OUA induces claudins’ autophagy, we next wondered whether the autophagy inducer Rapamycin (Rapa, 500 nM; a natural anti-fungal antibiotic that promotes autophagy mimicking starvation by inhibiting mTOR) provokes the same effect as OUA. We found that rapamycin decreased claudin-1, -2, and -4 abundance by 22%, 42%, and 21%, respectively, an effect indistinguishably from OUAs (). Besides strengthening our demonstration that OUA induces claudins autophagy, these results show that autophagy regulates claudin cell content in basal conditions, and Rapa did not potentiate OUA when cells were incubated with both drugs (, fourth column in each graph).
Figure 4. Autophagy regulates claudin-1, -2, and -4 cell content. MDCK cells were incubated for 10 h in the presence or absence of OUA (300 nM) with or without Rapa (500 nM), a potent autophagy inducer. A) Graphs represent claudin cell content, evaluated by densitometric analysis and expressed as a.u. Representative immunoblots are shown above. B) TER of the monolayers. One-way ANOVA followed by the SNK analysed the difference among groups. Groups not different from each other are marked by the same letter.
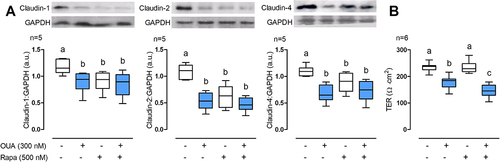
Autophagy, induced either by mimicking starvation or OUA, regulates claudins abundance. We then investigated the role of autophagy in TJ sealing. We examined the paracellular permeability of confluent MDCK monolayers through TER measurements. As shown before [Citation32], OUA decreased TER by 25%, while autophagy induction with Rapa did not affect TER (). This result indicates that Rapa does not induce claudin’s endocytosis, degradation, or inactivation at the TJ but triggers autophagy of the intracellular pools of these proteins. Nevertheless, autophagy induction potentiated the TER decrease induced by OUA up to reach 37% (, fourth column), unveiling a third process of autophagy control of claudins consisting of the acceleration of the OUA-induced component; it also confirms the active role of autophagy in claudins degradation and abundance.
Ouabain promotes autophagy through AMPK activation
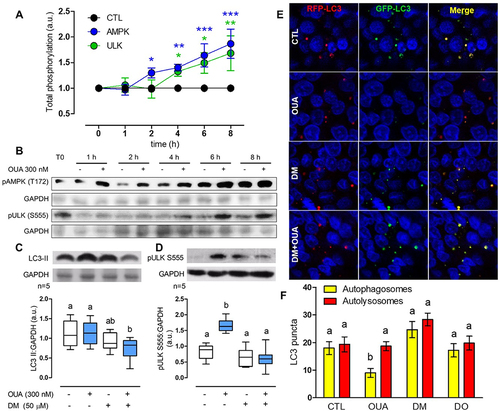
The fact that OUA increases autophagy flux is fascinating, considering that it disrupts TJ after the occupancy of its binding site at the ⍺-subunit of the Na⁺/K⁺-ATPase and the subsequent transactivation of the EGFR pathway through the small binding protein c-Src [Citation27]. To investigate how the activation of the EGFR pathway, which usually conduces to an autophagy blockage [Citation37], participates in OUA-induced autophagy, we analysed the primary autophagy regulator ULK1 and its upstream modulator AMPK, as a function of time. OUA increased AMPK Thr-172 phosphorylation to 30% at the second hour and retained this activation level during the remaining studied period (6 h more), with a maximum increment of 86% at 8 h of incubation. OUA-induced AMPK activation promoted ULK1 phosphorylation at Ser-555, with an initial increase of 33% at 4 h and a maximum of 68% at 8 h (), correlating with the autophagy flux increase mentioned in . To confirm OUA-induced autophagy through AMPK activation, we incubated MDCK cells with or without dorsomorphin (DM, 50 μM), an AMPK inhibitor, during a 10-h OUA treatment and measured LC3-II cell content. As before, OUA alone did not significantly change LC3-II quantity because, after its generation, it decreases rapidly; DM by itself had no statistically significant effect either; but the combination of DM and OUA significantly decreased LC3-II (), which means that AMPK inhibition provokes LC3 inactivation and, subsequently, blocks the autophagy flux induced by OUA. Furthermore, we evaluated ULK1 activation, incubating cells in the same conditions as above for 6 h, and demonstrated that upon AMPK inhibition, ULK1 is no longer activated (). We also assessed the autophagy flux through the GFP-LC3-RFP probe; in MDCK cells, incubated in the same conditions as before, DM ( DM+OUA) prevented the progression from autophagosomes to autolysosomes induced by OUA ( OUA), confirming that it blocks the autophagy flux progression. All these results demonstrate that OUA sequentially activates AMPK, ULK1, and autophagy.
Figure 5. OUA promotes autophagy through AMPK activation. A) Total phosphorylation, normalised with GAPDH, of the autophagy regulators in the presence (blue and green lines) or absence (black line) of OUA 300 nM at a function of time (hours, h), evaluated by the corresponding densitometric analysis and expressed as a.u. Values above the control (CTL) line denote a phosphorylation increase. Two-way ANOVA followed by SNK analysed the difference among groups. B) Representative immunoblots showing cell content of the autophagy regulators AMPK and ULK1 with their respective activated-phosphorylated forms (pAMPK T127 and pULK1 S555) in the absence (-) or presence (+) of OUA 300 nM. C) LC3-II content of MDCK cells incubated for 10 h in the presence or absence of OUA (300 nM) with or without DM (50 μM), an inhibitor of AMPK. D) pULK1 S555 content of MDCK cells incubated in the same conditions for 6 h. Representative immunoblots are shown above. E) MDCK cells were transfected with the plasmid GFP-LC3-RFP tandem probe and incubated in the same conditions as d. Yellow signal represents the autophagosomes, while red represents the autolysosomes. F) Number of autophagosomes and autolysosomes calculated from e, 50 cells evaluated per condition.
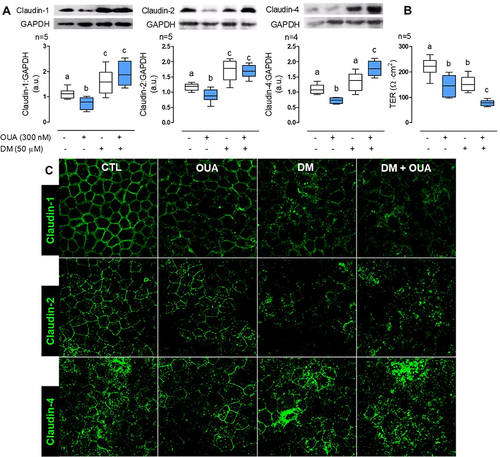
AMPK regulates claudin-1, -2, and -4 cell content and TJs´ sealing
As shown before [Citation38-41], AMPK plays a crucial role in regulating and stabilising TJ. Here, we demonstrate that OUA induces autophagy through AMPK activation, and autophagy regulates claudins’ abundance. Therefore, we also investigated whether AMPK activation regulates claudins’ cell content. We incubated MDCK cells for 10 h in the presence or absence of OUA (300 nM) with or without DM (50 μM), the AMPK inhibitor. OUA induced claudin-1, -2, and -4 degradation as usual; interestingly, DM increased 28% and 48% claudin-1 and -2 cell content, respectively, but showed no significant effect on claudin-4, and DM impaired OUA-induced degradation of the three claudins studied in comparison with OUA alone (), a similar behaviour is shown with autophagy blockage by NH₄Cl. Interestingly, the combination of OUA and DM increases even more claudin-4 cell content; it would be interesting to investigate the role of AMPK on claudin-4 expression. Taking these results together, we can conclude that besides the essential role of AMPK in TJ regulation, it also modulates claudins’ abundance through autophagy. Moreover, AMPK inhibition produces a TER decrease to the same level as OUA (), explained by TJ destabilisation elsewhere [Citation41]; interestingly, the combination of DM and OUA potentiates TER decrease (); these are the combined effects of the TJs weakening given by AMPK inhibition and claudins endocytosis produced by OUA. To confirm this, we evaluated claudins cell localisation by immunofluorescence in the same conditions (); in the control condition (CTL), claudin-1, -2, and -4 localise at TJs in a classical honeycomb pattern. As shown before, upon OUA treatment, these claudins are endocytosed from the plasma membrane. The same effect is observed in the presence of DM, proving the TJ’s destabilisation. The combination of OUA and DM exerts the most notorious disassembly of the TJ, as all the claudins’ signal appears only in the cytosol in this condition. These results prove that AMPK regulates claudins cells content and TJs sealing.
Figure 6. AMPK regulates claudin-1, -2, and -4 cell content. MDCK cells were incubated for 10 h in the presence or absence of OUA (300 nM) with or without DM (50 μM), an inhibitor of AMPK. A) Graphs represent claudin cell content, evaluated by densitometric analysis and expressed as a.u.; representative immunoblots are shown above. B) TER of the monolayers. C) Representative immunofluorescence of claudins cell localisation in these conditions.
Ouabain activates AMPK through oxidative stress
Finally, we evaluated the mechanism of AMPK activation. AMPK regulates energy homoeostasis to increase ATP generation when AMP:ATP ratio is elevated [Citation42]. This enzyme is a heterotrimer constituted by a catalytic α subunit and the two regulator β and γ subunits. AMPK activation depends on the phosphorylation of the subunit α at the Thr-172 by LKB1 or CAMKK [Citation43]. When AMP binds to the subunit γ, it facilitates subunit α phosphorylation and inhibits dephosphorylation. Considering that reactive oxygen species (ROS) increase the AMP:ATP ratio activating AMPK [Citation44] and that OUA promotes ROS generation [Citation45], we hypothesise that oxidative stress is implicated in AMPK activation by OUA. First, we measured ROS at the function of time and found an increase of 260% at 2 h of incubation with OUA (), which correlates with the time of AMPK activation (); then, to demonstrate that this increment activates AMPK, we analysed its phosphorylation in the presence and absence of OUA and N-acetylcysteine (NAC, 50 μM) a potent antioxidant. As described before (), OUA activated AMPK, while NAC impaired this activation (). These results demonstrate that OUA activates AMPK through oxidative stress. Finally, we evaluated claudins cells content under the same conditions; the results have a very similar pattern of the autophagy blockage by NH₄Cl and DM, in which NAC prevents claudins degradation by OUA (). Taking these results together, we can confirm that OUA increases ROS generation that activates AMPK, which in turn activates ULK1, therefore increasing autophagy flux that degrades claudin-1, -2, and -4 ().
Figure 7. OUA activates AMPK through ROS generation. A) ROS measurement in MDCK cells at a function of time of incubation with OUA (FAU: Fluorescence arbitrary units). B) MDCK cells were incubated in the presence or absence of OUA (300 nM) with or without NAC (50 μM), a potent antioxidant. The graph represents AMPK total phosphorylation evaluated by densitometric analysis and expressed as a.u. after 4-h incubation with OUA. C) Claudins cell content in MDCK cells incubated for 10 h in the same conditions as b. Representative immunoblots are shown above.
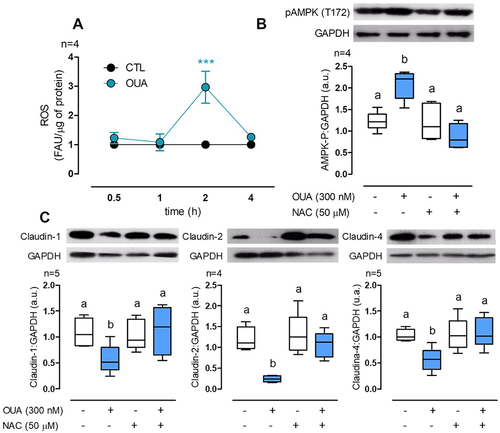
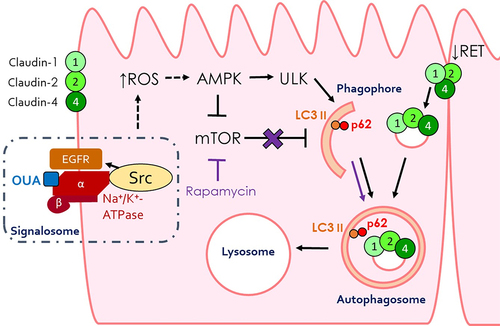
Figure 8. Model of claudins’ abundance regulation by OUA through autophagy. OUA pathway is depicted in black lines and the rapamycin one in purple lines. Dashed arrows represent indirect modulation. See the text for details.
Discussion
Proteostasis is the dynamic process that regulates proteome through a network that controls protein synthesis, folding, function, and degradation, and it is essential for human health [Citation46]. Claudin proteostasis studies include gene transcription, folding, post-translational modifications, and traffic [Citation10]; despite the evidence of claudins’ lysosomal degradation [Citation33], the role of autophagy in this process is mainly unknown. Here, we confirmed the claudin-2 and -4 lysosomal degradation seen before [Citation32] and extended it to claudin-1 (). We confirmed our previous results showing that claudin-4 mRNA increment upon OUA treatment and extended it to claudin-1; surprisingly, we now found that OUA also induces claudin-2 mRNA increase (), in contrast to our previous results [Citation32]. Cell adhesion proteins’ mRNA upregulation in detached cells may be part of a cellular mechanism to restore adhesion. In this respect, cells incubated without Ca⁺⁺ lack TJs but have a high mRNA cell content of the scaffolding tight and adherens junctions’ protein ZO-1 [Citation47].
We also demonstrated that OUA increases autophagy flux by measuring LC3-II and p62 content, quantifying autophagosomes through LC3 and p62 puncta and the GFP-LC3-RFP tandem probe (). This autophagy is essential to claudins proteostasis and affects TJs on three levels: 1) It participates in the degradation by OUA, seen by their colocalisation with p62 (); 2) It regulates the basal state of claudins without affecting normal TER (); 3) It potentiates the TER decrease by OUA (). Considering the essential role of claudins on paracellular transport, autophagy degradation may be involved in numerous pathologies; for example, Cryptosporidium parvum, a protozoan parasite of the small intestine, induces autophagy through mTOR inactivation, resulting in a decrease in claudin-4 content that enables the infection by disrupting the epithelial barrier [Citation48]. Moreover, thrombospondin-1, secreted by astrocytes, activates selective autophagy of claudin-5 in endothelial cells, which leads to blood–brain barrier leakage [Citation49], and autophagy enhances intestinal epithelial TJ by claudin-2 selective degradation [Citation50]. Claudins autophagy may also be implicated in kidney homoeostasis, as selective deletion of Atg5 or Atg7 in mice’s proximal tubules produce progressive kidney damage, suggesting that basal autophagy is essential to proximal tubule cells’ normal conditions [Citation51]. Additionally, autophagy could be associated with kidney diseases related to TJ. Acute renal failure is characterised by the loss of barrier function [Citation52], and its pathogenesis includes cells starvation, oxidative stress, hypoxia, and endoplasmic reticulum stress [Citation53], all of which promote autophagy; it would be interesting to evaluate claudins autophagy in this mechanism.
We also demonstrated that OUA induces claudin-1, -2, and -4 autophagy in renal epithelial cells through oxidative stress and AMPK activation (). Cardiac glycosides regulate autophagy through different processes [Citation54]. OUA, for instance, has been demonstrated to induce autophagic cell death in non-small cell lung carcinoma (A549 and H460 cells) through a mechanism dependent on the ERK 1/2 and Src activity [Citation55,Citation56]. The same research group demonstrated that AMPK is an upstream regulator of Src in the autophagy induction process [Citation57]. On the other hand, OUA-induced autophagy decreases the number of Tau aggregates that correlate with dementia in Alzheimer’s disease [Citation58]. Oxidative stress-induced AMPK activation may be explained by ROS generated by opening the mitochondrial KATP channel by OUA [Citation59]. Also, ROS are essential for ERK 1/2 and Ras activation [Citation45] in cardiac myocytes. This opens the question of whether ROS act as essential messengers in the ERK 1/2 pathway activated by OUA and EGFR. Although our results demonstrate that OUA induces claudin’s autophagy, increasing ROS and activating AMPK (), it remains for future investigation whether the OUA-induced oxidative stress activates AMPK by changing the AMP:ATP ratio, as seen before [Citation44], or by changing the oxidation state of cysteine residues at the α and β subunits, increasing the kinase activity, independently of changes in AMP:ATP ratio [Citation60-62].
Finally, we demonstrated that AMPK regulates claudins abundance through autophagy induction (). In this respect, AMPK is essential in TJ regulation; during Ca++ switch, a method used to investigate the mechanism of this complex formation, AMPK produces TJ, as it accelerates ZO-1 relocation to TJ, increases TER and decreases the dextran flux rate across the monolayer [Citation39]. ZO-1 relocation during the Ca++ switch depends on the phosphorylation of afadin by AMPK, which promotes its binding with ZO-1, facilitating the arrival at the TJ. Moreover, treatment with metformin, an AMPK activator, in obese Zucker rats increases ZO-2 and claudin-1 expression in the liver, reducing paracellular permeability [Citation63]. AMPK also regulates TJ stability in basal conditions. It phosphorylates the multimodular polarity scaffold protein GIV (G-alpha interacting vesicle-associated protein), stabilising the complex and increasing TER [Citation41]. Our results confirm this stabilisation, as AMPK inhibition in basal conditions decreases TER (, second column). Interestingly, the combination of DM and OUA exerts a potentiation upon TER diminish (, fourth column); here, we can see the combined effects of the TJs weakening given by AMPK inhibition and claudins endocytosis produced by OUA. This means that even if the degradation process is inhibited, proteins are still being removed from the membrane ().
In conclusion, we demonstrate that OUA regulates TJs by inducing claudin autophagy through ROS-mediated AMPK activation. Our results support the following model: OUA triggers a signalling cascade starting with the formation of a signalosome, followed by the inhibition of the Na⁺/K⁺-ATPase that increases intracellular ROS production that activates AMPK. Active AMPK leads to the phosphorylation of ULK1 at S555 and mTOR inactivation, which induces autophagy. AMPK-induced autophagy is responsible for the degradation of claudin-1, -2, and -4, as seen by their colocalisation with p62 and the increase in the autophagic flux ().
Materials and methods
Chemicals and antibodies
We purchased OUA (03235), Rapa (R87810), DM (P5499), and NAC (A7250) from Sigma-Aldrich; NH₄Cl (0660) from J.T. Baker; antibodies against anti-claudin-1 (2H10D10) from Thermo Fisher; anti-claudin-2 (51-6100), anti-claudin-4 (34-4800), and anti-mouse HRP-linked (62-6520) from Invitrogen; anti-GAPDH (Ab9484) from Abcam; anti-rabbit Alexa Fluor-555 (A21428) and anti-mouse Alexa Fluor-488 (A11001) from Life Technologies; anti-LC3 (2775), anti-p62 (8025), anti-phospho-AMPKα (Thr172; 2535), anti-AMPKα (5832), anti-phospho-ULK1 (Ser 555; 5869), anti-ULK1 (8054), and anti-rabbit HRP-linked (7074) from Cell Signaling Technology.
Cell culture
We performed all experiments on epithelial MDCK cell clones 7.15, chosen because of their intense blistering activity when plated on plastic Petri dishes and a low basal TER (200 Ω∙cm2) when plated on polycarbonate filters [Citation64]. We grew cells on Petri dishes at 37°C in an atmosphere of 5% CO₂ and 95% air in Dulbecco’s modified Eagle’s medium (Life Technologies, 31,600-083) supplemented with Penicillin (10.000 units/ml) mixed with streptomycin (10 mg/ml; In Vitro S.A., A-01) and 10% foetal bovine serum with iron (Life Technologies, 10,437-028), in the foregoing referred as CDMEM. After harvesting with trypsin-versene (In Vitro S.A., EN-005), we transferred the cells’ suspension onto multiwell plates (Corning Co-Star, 3524) when used for western blot and immunofluorescence or Transwell® inserts (Corning Co-Star, 3415) for TER; after plating, we maintained the cells for 48 h in CDMEM and then transferred cells to a low serum media (24 h in CDMEM with SFB 1%) and treated with different experimental media. Then, we preincubated monolayers for 1 h with the inhibitors (10 mM NH₄Cl, 500 nM Rapa, 50 μM DM, and 50 μM NAC) before adding 300 μM OUA for a period lasting as indicated in each figure.
Western blotting
To obtain total protein lysates, we washed monolayers plated on 24-multiwell plates (Corning Co-Star, 3524) three times with ice-cold PBS (Life Technologies, 21,300-058). We incubated them overnight at −80°C in lysis buffer (20 mM Tris pH 7.0, 2 mM EGTA, 5 mM EDTA, 30 mM sodium fluoride, 40 mM β-glycerophosphate, 1 mM sodium orthovanadate, 3 mM benzamidine, 0.5% Nonidet P-40, and Complete Protease Inhibitor Cocktail [Roche Applied Science, 4,693,116,001]). We measured total protein content using the BCA assay following the manufacturer’s instructions (Thermo Fisher Scientific, 23,235). Next, we boiled protein extracts in Laemmli buffer for 5 min, passed extracts 10 times through a 21-gauge needle, resolved by SDS-PAGE, and transferred them to polyvinylidene difluoride membranes (Bio-Rad, 1,620,177). Later, we incubated the membranes overnight with the primary antibodies at a 1:1000 dilution and 1 h with the secondary antibodies at a 1:15,000 dilution. Finally, we detected immunoreactive bands with a chemiluminescent substrate (ECL; GE Healthcare, RPN2236) and pre-flashed films (Amersham Hyperfilm, GE Healthcare) subjected to densitometry analysis using ImageJ [Citation65]. Specific phosphorylation corresponds to the ratio between the amounts of phosphorylated and the total protein.
Immunofluorescence
We processed monolayers grown on glass coverslips using the previously described antibody signal enhancer (ASE) [Citation66,Citation67]. Briefly, we rinsed coverslips three times with ice-cold PBS, fixed with methanol at −20°C for 10 min, rinsed three times again with PBS, and incubated them for 30 min in ASE blocking solution. Posteriorly we incubated the cells overnight at 4°C in primary antibodies diluted 1:1000 in ASE primary antibody solution. Then, we rinsed three additional times with PBS and set for 2 h with the solution containing secondary antibodies and DAPI (1:1000) in Triton X-100 at room temperature, rinsed as indicated above once more and mounted in Vectashield® (Vector Laboratories, H-1200). We acquired images with a Leica TCS SP8 laser confocal microscope, using Leica HC PL APO CS2 63x/1.40 oil objective. ImageJ was used to adjust the brightness and contrast of images and figure constructions. We calculated Pearson’s correlation coefficient using the JACoP Image J plugin [Citation68].
Transepithelial electrical resistance
We assessed the degree of the TJ sealing to ionic solutes by measuring the TER of the monolayers grown on Transwell® inserts (Corning, 3415) permeable supports using a volt Ohm meter (EVOM2) and EndOhm-6 system, according to the manufacturer’s instructions (World Precision Instruments, Sarasota, FL).
mRNA quantification by RT-qPCR
We isolated total RNA from MDCK 7.11 cells with TRIzol reagent (Cat. No. 15,596-026, Life Technologies), and determined GAPDH, and claudin-1, -2, and -4 mRNA concentrations in a StepOne Real-Time PCR Thermal Cycler apparatus (ThermoFisher) using a DNA Master SYBR Green Kit (Cat No. 12,158,817,001, Roche). We amplified the templates in 45 cycles of a two-step PCR cycle; each cycle comprised 30 sec of 95°C denaturation and 30 sec of 61°C annealing. We calculated the differential gene expression as the normalisation of the gene expression of GAPDH. We analysed the data with the equation previously described by Livak and Schmidgen (target = 2-DDCt) [Citation69]. We designed the following primers to amplify a 200-bp PCR product each: CLDN-1: CGACTCGCTGCTGAATCTGA (forward), AAACAGCCAGACCTGCAATA (reverse); CLDN-2: GACTCCCGAGCCAAAGACAG (forward), ACCAGGGAGAACAAGGAGGA (reverse); CLDN-4: ACAGGCTTCCAGGTCGTAGA (forward), CAGTTCATCCACAGGCCCTC (reverse); GAPDH: ATCCATGACCACTTCGGCATC (forward), CCAGTGAGCTTCCCGTTCAG (reverse).
Cell transfection
Noboru Mizushima donated the plasmid pMXs GFP-LC3-RFP (Addgene plasmid #117,413; http://n2t.net/addgene:117413; RRID:Addgene_117413) [Citation70]. We plated MDCK cells and transfected them when confluence reached an 80%, using Lipofectamine 2000, according to the manufacturer’s instructions (Thermo Fisher Scientific 11,668,019). We transfected the cells with 2.5 μg/ml of the plasmid; after 5 h in the transfection mix, we washed the monolayers with PBS and incubated them in DMEM supplemented with 10% FBS for 20 h. Then we transferred cells to a low serum media (24 h in CDMEM with SFB 1%) and treated them with different experimental media. Autophagosomes and autolysosomes quantification was performed using the ImageJ multi-point tool.
ROS detection
To investigate whether OUA induces the production of ROS, we used cells grown in 10 cm2 Petri dishes. We washed the cells three times with PBS and incubated for 1 h with phenol red free DMEM (Gibco 21,063-029) containing 10 mM of 2´,7´-Dichlorofluorescein diacetate (Sigma 35,845). Next, we washed the cultures with PBS and incubated them in DMEM 1% FBS for 1 h. After this time, we transferred the monolayers to DMEM containing or not containing 300 nM OUA. Then, we obtained triplicate samples of cells at 30, 60, 120, and 240 min, washed them with PBS, and lysed them with PBS supplemented with 1% SDS. We exposed 100 µl of each sample to an excitation beam of 485 nm and registered the corresponding emission at 530 nm.
Statistical analysis
We analysed statistical significance by applying unpaired t-tests or one-way ANOVA, followed by the SNK test, using Prism 5 (GraphPad software). We considered the compared data groups statistically significant if p was equal or higher than 0.05, as indicated by different letters on the corresponding columns.
Acknowledgments
We thank Eduardo Estrada, Erika del Oso, Samuel Guzmán Torres, and Iván U. Valladares-Hernández for their generous help.
Disclosure statement
The authors declare no conflict of interest.
Additional information
Funding
References
- Coffey JW, De Duve C. Digestive activity of lysosomes. J Biol Chem. 1968;243(17):3255–25. PMC5656369
- Mizushima N. Autophagy : process and function. Genes Dev. 2007;21:2861–2873. PMC18006683. doi: 10.1101/gad.1599207
- Tsukada M, Ohsumi Y. Isolation and characterization of autophagy-defective mutants of Saccharomyces cerevisiae. FEBS J. 1993;333(1):169–174. PMC8224160. doi: 10.1016/0014-5793(93)80398-e
- Gwinn DM, Shackelford DB, Egan DF, et al. AMPK phosphorylation of raptor mediates a metabolic checkpoint. Mol Cell. 2008 Apr 4 [cited 2022 Sep 13]; 30(2):214. PMC2674027. doi: 10.1016/j.molcel.2008.03.003
- Kim J, Kundu M, Viollet B, et al. AMPK and mTOR regulate autophagy through direct phosphorylation of Ulk1. Nat Cell Biol. 2011. doi: 10.1038/ncb2152
- Dikic I, Elazar Z. Mechanism and medical implications of mammalian autophagy. Nat Rev Mol Cell Biol. 2018;19(6):349–364. PMC29618831. doi: 10.1038/s41580-018-0003-4
- Rawet Slobodkin M, Elazar Z. The Atg8 family: multifunctional ubiquitin-like key regulators of autophagy. Essays Biochem. 2013;55(1):51–64. PMC24070471. doi: 10.1042/bse0550051
- Klionsky DJ, Petroni G, Amaravadi RK, et al. Autophagy in major human diseases. EMBO J. 2021;40(19):1–64. PMC8488577 doi: 10.15252/embj.2021108863
- Cereijido M, Contreras RG, Shoshani L. Cell adhesion, polarity, and epithelia in the dawn of metazoans. Physiol Rev. 2004;84(4):1229–1262. PMC15383651. doi: 10.1152/physrev.00001.2004
- Gunzel D, Yu ASL. Claudins and the modulation of tight junction permeability. Physiol Rev. 2013;93:525–569.
- Cereijido M, Robbins ES, Dolan WJ, et al. Polarized monolayers formed by epithelial cells on a permeable and translucent support. J Cell Biol. 1978;77(3):0601–853. PMC2110138. doi: 10.1083/jcb.77.3.853
- Claude P. Morphological factors influencing transepithelial permeability: a model for the resistance of the Zonula Occludens. J Membr Biol. 1978;39(2–3):219–232. PMC641977. doi: 10.1007/BF01870332
- Amasheh S, Meiri N, Gitter AH, et al. Claudin-2 expression induces cation-selective channels in tight junctions of epithelial cells. J Cell Sci. 2002;115(Pt 24):4969–4976. PMC12432083. doi: 10.1242/jcs.00165
- Withering W. An account of the foxglove, and some of its medical uses: with practical remarks on dropsy, and other diseases. G. G. J. and J. Robinson. London: 1785. p. 1–159.
- Hamlyn JM, Blaustein MP, Bova S, et al. Identification and characterization of a ouabain-like compound from human plasma. Proc Natl Acad Sci U S A. 1991;88(July):6259–6263. PMC52062. doi: 10.1073/pnas.88.14.6259
- Kawamura A, Guo J, Itagaki Y, et al. On the structure of endogenous ouabain. Proc Natl Acad Sci U S A. 1999;96(12):6654–6659. PMC21970. doi: 10.1073/pnas.96.12.6654
- Schneider R, Wray V, Nimtz M, et al. Bovine adrenals contain, in addition to ouabain, a second inhibitor of the sodium pump. J Biol Chem. 1998. doi: 10.1074/jbc.273.2.784
- Fedorova OV, Shapiro JI, Bagrov AY. Endogenous cardiotonic steroids and salt-sensitive hypertension. Biochim Biophys Acta - Mol Basis Dis. 2010;1802(12):1230–1236. PMC2933321. doi: 10.1016/j.bbadis.2010.03.011
- Moreth K, Kuske R, Renner D, et al. Blood pressure in essential hypertension correlates with the concentration of a circulating inhibitor of the sodium pump. Klin Wochenschr. 1986;64(5):239–244. PMC3009961. doi: 10.1007/BF01711656
- Bagrov AY, Shapiro JI, Fedorova OV. Endogenous cardiotonic steroids: physiology, pharmacology, and novel therapeutic targets. Pharmacol Rev. 2009;61(1):9–38. PMC2763610. doi: 10.1124/pr.108.000711
- Cavalcante-Silva LHA, Lima de A É, Carvalho DCM, et al. Much more than a cardiotonic steroid: modulation of inflammation by ouabain. Front Physiol. 2017;8(NOV):1–8. PMC5686084. doi: 10.3389/fphys.2017.00895
- Verdejo-Torres O, Flores-Maldonado C, Padilla-Benavides T, et al. Ouabain accelerates collective cell migration through a cSrc and ERK1/2 sensitive metalloproteinase activity. J Membr Biol. 2019. doi: 10.1007/s00232-019-00066-5
- Contreras RG, Shoshani L, Lázaro A, et al. Relationship between Na +, K + -ATPase and cell attachment. J Cell Sci. 1999;4232:4223–4232. PMC10564641. doi: 10.1242/jcs.112.23.4223
- Aizman O, Uhlén P, Lal M, et al. Ouabain, a steroid hormone that signals with slow calcium oscillations. Proc Natl Acad Sci U S A. 2001;98(23):13420–13424. PMC60886. doi: 10.1073/pnas.221315298
- Aperia A. New roles for an old enzyme: Na,K-ATPase emerges as an interesting drug target. J Intern Med. 2007;261(1):44–52. PMC17222167. doi: 10.1111/j.1365-2796.2006.01745.x
- Wang H, Haas M, Liang M, et al. Ouabain assembles signaling cascades through the caveolar Na +/K+-ATPase. J Biol Chem. 2004;279(17):17250–17259. PMC14963033. doi: 10.1074/jbc.M313239200
- Xie Z. Molecular mechanisms of Na/K-ATPase-mediated signal transduction. Ann N Y Acad Sci. 2003;1:497–503. PMC12763870. doi: 10.1111/j.1749-6632.2003.tb07234.x
- Xie Z, Askari A. Na+/K+-ATPase as a signal transducer. Eur J Biochem. 2002;269(10):2434–2439. PMC12027880. doi: 10.1046/j.1432-1033.2002.02910.x
- Zhang S, Malmersjö S, Li J, et al. Distinct role of the N-terminal tail of the Na,K-ATPase catalytic subunit as a signal transducer. J Biol Chem. 2006;281(31):21954–21962. PMC16723354. doi: 10.1074/jbc.M601578200
- Larre I, Lazaro A, Contreras RG, et al. Ouabain modulates epithelial cell tight junction. Proc Natl Acad Sci USA. 2010 Jun 22 [cited 2022 Sep 20];107(25):11387–11392. PMC20534449. doi: 10.1073/pnas.1000500107]
- Larre I, Castillo A, Flores-Maldonado C, et al. Ouabain modulates ciliogenesis in epithelial cells. Proc Natl Acad Sci USA. 2011 Dec 20 [cited 2022 Sep 20];108(51): 20591–20596. PMC22143774. doi: 10.1073/pnas.1102617108
- Rincon-Heredia R, Contreras RG, Bonilla-Delgado J, et al. Ouabain induces endocytosis and degradation of tight junction proteins through ERK1/2-dependent pathways. Exp Cell Res. 2014;320(1):108–118. Available from. PMC24140471. doi: 10.1016/j.yexcr.2013.10.008
- Flores-Maldonado C, Cabrera AR, García-Hernández V, et al. Lysosomal degradation of junctional proteins. Lysosomes - Assoc Dis Methods to Study Their Funct. doi: 10.5772/intechopen.69370 2017.
- Luzio JP, Pryor PR, Bright NA. Lysosomes: fusion and function. Nat Rev Mol Cell Biol. 2007;8(8):622–632. PMC17637737. doi: 10.1038/nrm2217
- Yoshii SR, Mizushima N. Monitoring and measuring autophagy. Int J Mol Sci. 2017;18(9):1–13. PMC28846632. doi: 10.3390/ijms18091865
- Dunn KW, Kamocka MM, McDonald JH. A practical guide to evaluating colocalization in biological microscopy. Am J Physiol Cell Physiol. 2011;300(4):723–742. PMC21209361. doi: 10.1152/ajpcell.00462.2010
- Li H, You L, Xie J, et al. The roles of subcellularly located EGFR in autophagy. Cell Signal. 2017;35:223–230. doi: 10.1016/j.cellsig.2017.04.012
- Zheng B, Cantley LC. Regulation of epithelial tight junction assembly and disassembly by AMP-activated protein kinase. Proc Natl Acad Sci U S A. 2007 Jan 16;104(3):819–822. PMC17204563. doi: 10.1073/pnas.0610157104
- Zhang L, Li J, Young LH, et al. AMP-activated protein kinase regulates the assembly of epithelial tight junctions. Proc Natl Acad Sci USA. 2006 Nov 14 [cited 2020 Sep 27];103(46):17272–17277. PMC17088526. doi: 10.1073/pnas.0608531103
- Rowart P, Wu J, Caplan MJ, et al. Implications of AMPK in the formation of epithelial tight junctions. Int J Mol Sci. 2018 [cited 2020 Sep 27];19:2040. PMC30011834. doi: 10.3390/ijms19072040
- Aznar N, Patel A, Rohena CC, et al. AMP-activated protein kinase fortifies epithelial tight junctions during energetic stress via its effector GIV/Girdin eLife. 2016. PMC27813479. doi: 10.7554/eLife.20795
- Kahn BB, Alquier T, Carling D, et al. AMP-activated protein kinase: ancient energy gauge provides clues to modern understanding of metabolism. Cell Metab. 2005 Jan;1(1):15–25. PMC16054041. doi: 10.1016/j.cmet.2004.12.003
- Oakhill JS, Steel R, Chen ZP, et al. AMPK is a direct adenylate charge-regulated protein kinase. Science. 2011;332(6036):1433–1435. PMC21680840. doi: 10.1126/science.1200094
- Auciello FR, Ross FA, Ikematsu N, et al. Oxidative stress activates AMPK in cultured cells primarily by increasing cellular AMP and/or ADP. Febs Lett. 2014 Sep 9 [cited 2022 Sep 22];588(18):3361. PMC25084564. doi: 10.1016/j.febslet.2014.07.025
- Xie Z, Kometiani P, Liu J, et al. Intracellular reactive oxygen species mediate the linkage of Na+/K+-ATPase to hypertrophy and its marker genes in cardiac myocytes. J Biol Chem. 1999 Jul 2 [cited 2022 Sep]; 19 doi: 10.1074/jbc.274.27.19323];274(27):19323–19328. PMC10383443.
- Roth DM, Balch WE. Modeling general proteostasis: proteome balance in health and disease. Curr Opin Cell Biol. 2011;23(2):126–134. PMC21131189. doi: 10.1016/j.ceb.2010.11.001
- González-Mariscal L, Islas S, Contreras RG, et al. Molecular characterization of the tight junction protein ZO-1 in MDCK Cells. Exp Cell Res. 1999 Apr 10;248(1):97–109. PMC10094817. doi: 10.1006/excr.1999.4392
- Priyamvada S, Jayawardena D, Bhalala J, et al. Cryptosporidium parvum infection induces autophagy in intestinal epithelial cells. Cell Microbiol. 2021;23:4. PMC33237610. doi: 10.1111/cmi.13298
- Yang Z, Huang C, Wu Y, et al. Autophagy protects the blood-brain barrier through regulating the dynamic of claudin-5 in short-term starvation. Front Physiol. 2019 Jan 18 [cited 2020 Mar 31];10(JAN):2.
- Nighot PK, Hu CAA, Ma TY. Autophagy enhances intestinal epithelial tight junction barrier function by targeting claudin-2 protein degradation. J Biol Chem. 2015 Mar 13 [cited 2021 Jun 13];290(11):7234–7246. PMC25616664. doi: 10.1074/jbc.M114.597492
- Tang C, Livingston MJ, Liu Z, et al. Autophagy in kidney homeostasis and disease. Nat Rev Nephrol. 2020;16(9):489–508. PMC32704047. doi: 10.1038/s41581-020-0309-2
- Lee DBN, Huang E, Ward HJ, et al. Tight junction biology and kidney dysfunction. Am J Physiol Ren Physiol. 2006;290:20–34. PMC16339962. doi: 10.1152/ajprenal.00052.2005
- Kaushal GP, Shah SV. Autophagy in acute kidney injury. Kidney Int. 2016 Apr 1;89(4):779–791. PMC26924060. doi: 10.1016/j.kint.2015.11.021
- Škubník J, Pavlíčková VS, Psotová J, et al. Cardiac glycosides as autophagy modulators. Cells. 2021 Dec 1 [cited 2022 Sep 19];10(12). PMC34943848. doi: 10.3390/cells10123341
- Wang Y, Qiu Q, Shen JJ, et al. Cardiac glycosides induce autophagy in human non-small cell lung cancer cells through regulation of dual signaling pathways. Int J Biochem Cell Biol. 2012;44(11):1813–1824. PMC22750415. doi: 10.1016/j.biocel.2012.06.028
- Wang Y, Zhan Y, Xu R, et al. Src mediates extracellular signal-regulated kinase 1/2 activation and autophagic cell death induced by cardiac glycosides in human non-small cell lung cancer cell lines. Mol Carcinog. 2015;54(S1):E26–34. PMC24610665. doi: 10.1002/mc.22147
- Shen J, Zhan Y, Li H, et al. Ouabain impairs cancer metabolism and activates AMPK-Src signaling pathway in human cancer cell lines. Acta Pharmacol Sin. 2020;41(1):110–118. PMC31515527. doi: 10.1038/s41401-019-0290-0
- Song HL, Demirev AV, Kim NY, et al. Ouabain activates transcription factor EB and exerts neuroprotection in models of Alzheimer’s disease. Mol Cell Neurosci. 2019;95(December 2018):13–24. PMC30594669. doi: 10.1016/j.mcn.2018.12.007
- Tian J, Liu J, Garlid KD, et al. Involvement of mitogen-activated protein kinases and reactive oxygen species in the inotropic action of ouabain on cardiac myocytes. A potential role for mitochondrial K ATP channels. Mol Cell Biochem. 2003;242:181–187. PMC12619881.
- Cardaci S, Filomeni G, Ciriolo MR. Redox implications of AMPK-mediated signal transduction beyond energetic clues. J Cell Sci. 2012 May 1;125(9):2115–2125. PMC22619229. doi: 10.1242/jcs.095216
- Choi SL, Kim SJ, Lee KT, et al. The regulation of AMP-activated protein kinase by H2O2. Biochem Biophys Res Commun. 2001 Sep 14;287(1):92–97. PMC11549258. doi: 10.1006/bbrc.2001.5544
- Zmijewski JW, Banerjee S, Bae H, et al. Exposure to hydrogen peroxide induces oxidation and activation of AMP-activated protein kinase. J Biol Chem. 2010 Oct 22;285(43):33154–33164. PMC20729205. doi: 10.1074/jbc.M110.143685
- González-González L, Gallego-Gutiérrez H, Martin-Tapia D, et al. ZO-2 favors hippo signaling, and its re-expression in the steatotic liver by AMPK restores junctional sealing. Tissue Barriers. 2022;10(2). doi: 10.1080/21688370.2021.1994351
- Flores-Benítez D, Ruiz-Cabrera A, Flores-Maldonado C, et al. Control of tight junctional sealing: role of epidermal growth factor. Am J Physiol Ren Physiol. 2007;292:828–836. PMC17077385. doi: 10.1152/ajprenal.00369.2006
- Schneider CA, Rasband WS, Eliceiri KW. NIH Image to ImageJ: 25 years of image analysis. 2012. doi: 10.1038/nmeth.2089
- Rosas-Arellano A, Villalobos-González JB, Palma-Tirado L, et al. A simple solution for antibody signal enhancement in immunofluorescence and triple immunogold assays. Histochem Cell Biol. 2016 Oct 1 [cited 2022 Aug 4];146(4):421–430. PMC27188756. doi: 10.1007/s00418-016-1447-2
- Flores-Maldonado C, Albino-Sánchez ME, Rodríguez-Callejas JD, et al. A low cost antibody signal enhancer improves immunolabeling in cell culture, primate brain and human cancer biopsy. Neuroscience. 2020;439:275–286. PMC31954828. doi: 10.1016/j.neuroscience.2020.01.009
- Bolte S, Cordelieres FP. A guided tour into subcellular colocalization analysis in light microscopy. J Microsc. 2006;224(3):213–232. PMC17210054. doi: 10.1111/j.1365-2818.2006.01706.x
- Livak KJ, Schmittgen TD. Analysis of relative gene expression data using real-time quantitative PCR and the 2(-Delta Delta C(T)) Method. Methods. 2001;25(4):402–408. PMC11846609. doi: 10.1006/meth.2001.1262
- Morita K, Hama Y, Izume T, et al. Genome-wide CRISPR screen identifies TMEM41B as a gene required for autophagosome formation. J Cell Biol. 2018 Nov 1 [cited 2023 Apr 1];217(11): 3817–3828. PMC30093494. doi: 10.1083/jcb.201804132