
ABSTRACT
ATG9A is an important membrane protein in mammalian macroautophagy. The formation of autophagosomes and phagophores is blocked in atg9a KO cells. However, it remains possible that residual membrane formation activity exists in these cells. These precursor structures that precede phagophores are, if they exist, rare and may be difficult to find. Here, we introduce the modified volume correlative light and electron microscopy (CLEM) method to analyze these structures three-dimensionally. In addition to target proteins, mitochondria were labeled as a landmark for precise correlation of slice images by a confocal fluorescence microscope and a focused ion beam scanning electron microscope. We found phagophores and small membrane vesicles near SQSTM1/p62 aggregates in atg9a KO cells, indicating that phagophores could be formed in atg9a-deficient cells, although they were immature and inefficient. Furthermore, we found that RB1CC1/FIP200-positive structures formed clusters around SQSTM1/p62 with ferritin and TAX1BP1. Taken together, our method contributes to the understanding of undiscovered fine structures.
Abbreviations: CLEM: correlative light and electron microscopy; EM: electron microscopy; ER: endoplasmic reticulum; FIB-SEM: focused ion beam scanning electron microscopy; FM: fluorescence microscopy; GFP: green fluorescent protein; KO: knock out; MEF: mouse embryonic fibroblast; PBS: phosphate-buffered saline; ROI: region of interest; SEM: scanning electron microscopy.
Introduction
Macroautophagy/autophagy (hereafter referred to as autophagy) is the intracellular mechanism by which cytoplasmic materials, such as proteins and organelles, are degraded into monomers that are recycled. A flattened membrane structure called the phagophore, or the isolation membrane, elongates around the object to be degraded. The phagophore is finally incorporated into a double-membrane vesicle called an autophagosome, followed by fusion with lysosomes for degradation. In the present understanding of the molecular mechanism of autophagosome biogenesis in mammalian cells, autophagy initiates with the ULK complex, composed of ULK1/2, RB1CC1/FIP200 (hereafter referred to as FIP200), ATG13, and ATG101 [Citation1-3]. Multimeric ULK complexes assemble at the site of autophagosome formation and function as a platform for the generation of the phagophore. ATG9 is a multispanning membrane protein that resides on small vesicles [Citation4,Citation5]. The deletion of Atg9a leads to impairment of the recruitment of other proteins [Citation4]; it is required for the early steps of autophagy, including the recruitment of proteins of autophagy machinery and, possibly, membrane supply [Citation4,Citation6,Citation7]. Only recently, the structure of ATG9A was reported [Citation8-10], and it was suggested that ATG9A has lipid scramblase activity [Citation9,Citation10]. On the other hand, several studies reported that autophagosomes were able to be formed in atg9a KO cells [e.g., Citation11]. This discrepancy is at least partly due to the gap between the formation of autophagosomes and LC3 puncta [Citation12]. However, some kinds of incomplete phagophores may be still formed in atg9a KO cells. To directly observe such membranes, electron microscopy is used as an essential tool. In the last decade, three-dimensional electron microscopy (3D EM or volume EM) has advanced rapidly [Citation13-15]. In newly developed methods, some processes are automated and become easier to use. Another development of the EM technique is correlative light and electron microscopy (CLEM), in which the same region is imaged in both light and electron microscopy [Citation16,Citation17]. Since it is time-consuming to observe a large area with an electron microscope, CLEM is an essential technique to find and observe rare objects. Here, we used a combined method, namely, 3D-CLEM or volume-CLEM [Citation18,Citation19]. To observe rudimentary membrane structures for autophagosome formation in atg9a KO cells, we used focused ion beam scanning electron microscopy (FIB-SEM), which offers the highest voxel resolution and automatic imaging system in volume EM [Citation13-15,Citation20,Citation21]. In FIB-SEM, the surface of a sample block is repeatedly milled by a gallium ion beam. After each milling cycle, serial SEM images of the block face are automatically acquired. One of the disadvantages of FIB-SEM is that it has a smaller imaging area and volume than other methods. Because of the difficulty of observing the region of interest (ROI), CLEM is particularly valuable for FIB-SEM. In this study, we found unique structures at the autophagosome formation site in atg9a KO cells by volume CLEM analysis and revealed a unique localization pattern of FIP200.
Results
SQSTM1/p62 and ULK1 colocalized and accumulated in atg9a KO cells
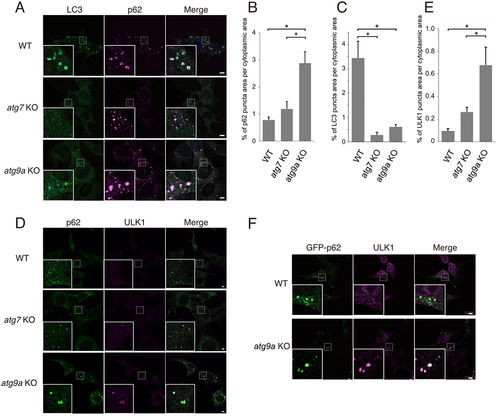
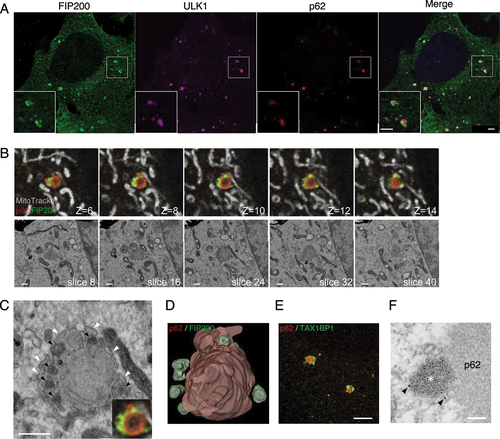
To characterize Atg9a-deficient cells, we first examined the localization of LC3 and SQSTM1/p62 (hereafter referred to as p62) in wild-type, atg7 KO, and atg9a KO mouse embryonic fibroblasts (MEFs) (, Fig. S1A). LC3 is a member of the Atg8-family of proteins, the C termini of which are conjugated to lipids and anchored to autophagic membranes [Citation1,Citation2]; therefore, LC3 is a traditional marker of autophagosomes. p62 is a receptor/adaptor protein for selective autophagy that binds to ubiquitinated cargo proteins and LC3 [Citation1]. LC3 and p62 puncta colocalized in wild-type cells (). In contrast, LC3 puncta were almost dispersed in atg7 KO cells, in which LC3-lipid conjugation was abrogated. In atg9a KO cells, p62 accumulated more intensely than in other cell types (). Such intense accumulation of p62 was reduced by the expression of ATG9A-GFP (). Electron microscopy analysis also confirmed that ATG9A-GFP expression leads to the formation of autophagic vacuoles (autophagosomes or autolysosomes) in atg9a KO cells (Fig. S1C). In atg9a KO cells, the LC3 puncta was reduced (). However, the weak LC3 signal markedly co-localized with p62 (). As reported previously [Citation12], LC3 abnormally accumulated in p62-positive aggregates in autophagy-deficient cells. Thus, LC3 was not a reliable marker of autophagic structures in atg9a KO cells. Instead, we used ULK1 as an early-stage marker of autophagy (). ULK1 remarkably colocalized with p62 in atg9a KO cells compared to in WT and atg7 KO cells (). This suggests that ULK1 accumulated more in atg9a KO cells than in atg7 KO cells, possibly because of the strict blockage of autophagosome formation. We aimed to visualize the structures around ULK1 and p62 aggregates with volume CLEM analysis. As a first step, we used GFP-p62 as a marker of the autophagosome formation site for CLEM, since immunostaining of endogenous p62 with permeabilization possibly disrupts target membranes. Before proceeding to CLEM experiments, we confirmed that GFP-p62 also colocalized with ULK1 in atg9a KO cells ().
Figure 1. ULK1- and p62-positive structures accumulate in atg9a KO cells. (A-E) MEFs from wild-type, atg7 KO and atg9a KO mice were starved for 1 h, fixed, and immunostained with antibodies. (A) Immunopositive staining for LC3 (green) and p62 (magenta) is shown in these cells. (B and C) Bar graphs showing the percentages of p62 puncta area (B) and LC3 puncta area (C) per cytoplasmic area in (A). The mean and SEM are shown. (D) MEFs immunostained with anti-ULK1 (magenta) and anti-p62 (green) antibodies are shown. ULK1 and p62 was well colocalized in atg9a KO cells. (E) A bar graph shows percentages of areas for ULK1 puncta with p62 puncta per cytoplasmic area in (D). (F) MEFs expressing GFP-p62 (green) were starved for 1 h, fixed, and immunostained with anti-ULK1 (magenta) antibody. GFP-positive puncta were well colocalized with puncta immunopositive for ULK1. Boxed areas are enlarged in the left-hand corner. Statistical analysis was performed using one-way ANOVA with Tukey’s multiple comparisons using GraphPad Prism. *p < 0.05. Scale bars, 5 µm.
Improvement of the volume CLEM protocol
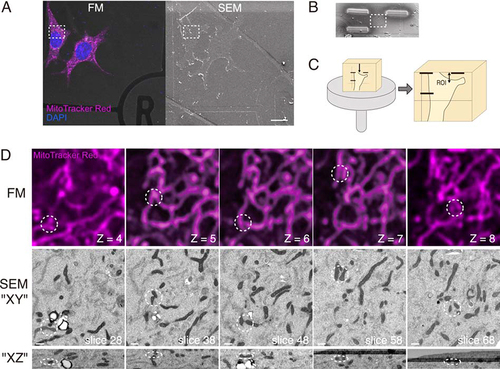
For precise and simple correlation, we modified the method of CLEM (, Fig. S2, and see Materials and Methods). Since the grid pattern is too wide to find strictly the same position and has no information regarding the depth direction, we used mitochondria as internal landmarks. Mitochondria are easy to stain noninvasively for fluorescence microscopy due to their membrane potential. Mitochondria have similar shapes, but their whole structures are distinct from each other. Therefore, they are suitable for positional correlation. Cells expressing GFP-p62 were also stained with MitoTracker Red and then fixed with glutaraldehyde. Fluorescent z-stack images of the target area were captured with a confocal laser scanning fluorescence microscope (hereafter referred to simply as FM). Cells were then postfixed and embedded for electron microscopy. The surface of the Epon block was observed with FIB-SEM. The same area as the FM image was found by using grid patterns as a guide (). The region of interest (ROI) was marked by platinum deposition with FIB (). The sample was cut into pieces with a razor, and a piece including the ROI was attached to a pin stab vertically (). To reduce the time and cost for imaging, we performed horizontal imaging in the present study (Fig. S2). The Epon piece was trimmed and sectioned until the ROI was close to the top surface of the block. Serial block-face imaging with FIB-SEM was performed as described in the Materials and Methods section. For the positional correlation between FM and SEM images, the characteristic shape of mitochondria was used as a landmark. Some representative points (marked as circles in ) were used for the correlation of xyz positions. When the thickness of the SEM and FM images was respectively 20 nm and 200 nm, 10 slice images of SEM corresponded to one image of FM. Since the resolutions of the z-axis of SEM and FM were different, the appearance of a single slice was not identical (only part of the mitochondria observed in an FM image is visible in a single SEM image). Therefore, volume imaging of SEM was also helpful for correlation. Although we could not find a completely corresponding location, we could narrow the range of alignment down to a few slices. The width of mitochondria in these cells was approximately 150 nm to 350 nm, which is much smaller than the grid pattern. Thus, our method enabled more accurate correlation than common protocols. After the correlation with this protocol, the target structure at the ROI was analyzed in FIB-SEM images.
Figure 2. A workflow for precise volume CLEM. (A) Cells on a gridded coverslip were stained with MitoTracker Red (magenta), fixed and observed with a confocal fluorescence microscope (FM). After confocal z-stack images were taken, the cells were postfixed and embedded for electron microscopy. The surface of the EPON block was observed under a scanning electron microscope (SEM). The boxed area is the region of interest (ROI). Scale bars, 20 µm. (B) The ROI is marked with platinum deposition for the following trimming step. (C) The Epon block is cut into small pieces, including the ROI, and vertically attached to an SEM stub. The upper surface of the block is trimmed with an ultramicrotome to the deposition marks. The distance from the top surface to the ROI, two-headed arrow, is less than 20 µm. (D) Correlated images of FM and SEM. The patterns of mitochondria that are easy to distinguish (dotted circle) are used as landmarks for correlation. The optical slice thickness of the FM z-stacks is 200 nm. The lower images are the XZ projection, including circled areas. The number of z-stacks of FM and the slice number of FIB/SEM are shown. Scale bars, 500 nm.
Endoplasmic reticulum and abnormal phagophores surrounded GFP-p62 aggregates in atg9a KO cells
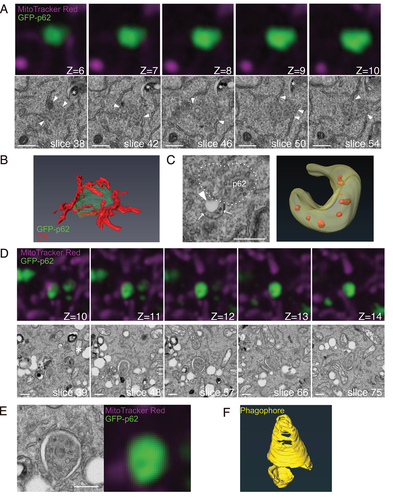
MEFs expressing GFP-p62 were starved and subjected to CLEM analysis as described above. In these cells, lysosome-like structures were more frequently found than normal MEFs. These structures are considered to be artificially generated by lipofection treatment [Citation22,Citation23]. In wild-type MEFs, autophagic vacuoles (autophagosomes or autolysosomes) were found at the position corresponding to GFP-p62 signals (). Some autophagic vacuoles include GFP-p62 aggregates in their lumen. In another example, there was no GFP-p62 signal at the site where autophagic vacuoles were present (Fig. S3A). In atg7 KO cells, phagophores with endoplasmic reticulum (ER) were frequently found, as expected ( and S3B). There was no GFP-p62 inside these membranes. These results were consistent with those of previous studies [Citation24,Citation25]. In atg9a KO cells, autophagosomes and phagophores were hardly observed (). Instead, these p62 aggregates were associated with rough ER (), as we have reported in the brain of atg9a KO mice [Citation26]. Although there was no typical phagophore in these cells, unique membrane structures were often found in the periphery of aggregates ( and S3C). These crescent-shaped membranes contained small vesicles or granules in their lumen (arrow) and were adjacent to vacant structures inside the arc (arrowhead). On the other hand, we found unclosed phagophores around GFP-p62 aggregates in a small fraction of cells (). Unlike atg7 KO cells, these membranes had many gaps and surrounded GFP-p62 aggregates, implying the existence of LC3. ER was also attached to these phagophores, but the association was not as tight as that in atg7 KO cells. These results suggest that aberrant membrane structures, potentially the intermediates of phagophores, still form in atg9a KO cells.
Figure 3. Volume CLEM analysis of WT and atg7 KO MEFs. MEFs expressing GFP-p62 (green) were labeled with MitoTracker Red (magenta). Serial images were taken with FM and FIB/SEM. (A) CLEM images of the WT cell. (B) CLEM images of the atg7 KO cell. The optical slice thickness of FM z-stacks is 200 nm (A) or 80 nm (B). Arrowheads indicate p62-containing autophagic vacuoles (WT), or phagophores adjacent to p62 aggregates (atg7 KO). Scale bars, 500 nm.
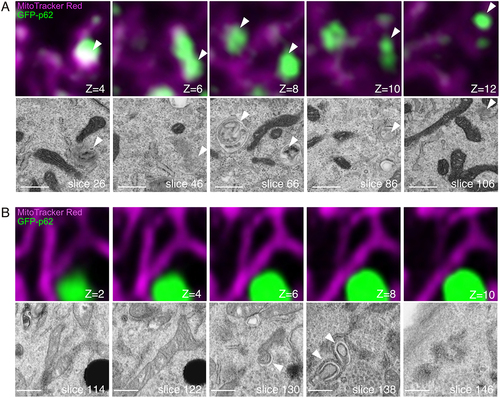
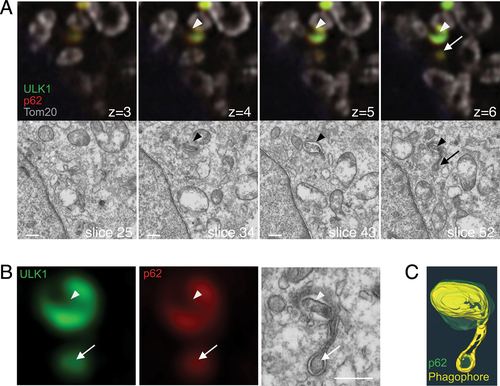
Figure 4. Volume CLEM analysis reveals that ER and phagophores partly surround GFP-p62 aggregates in atg9a KO cells. (A) Representative FIB/SEM slice images and corresponding FM images of atg9a KO cells. The slice numbers of SEM and the z-stack numbers of FM are shown. The optical slice thickness of FM z-stacks is 80 nm. ER are closely in contact with the GFP-p62 aggregates (arrowheads). Asterisk, lysosome-like structure. (B) A segmented 3D model of GFP-p62 (green) and ER (red). (C) The crescent-shaped membrane with internal vesicles (arrows) and a vacant region (arrowhead). A segmented 3D model is shown. (D) Serial images of GFP-p62 and corresponding SEM figures that show the phagophore surrounding GFP-p62 aggregates in atg9a KO cells. The optical slice thickness of FM z-stacks is 180 nm. (E) Magnified images of membrane structures in (D). (F) A segmented 3D model of the phagophore (yellow). Also see Video S1A. Scale bars, 500 nm.
Small phagophores resided around endogenous p62 aggregates
The results obtained above were from cells expressing GFP-p62. The formation of phagophores might be facilitated by the overexpression of p62. To exclude this possibility, we next tried to examine structures around endogenous p62. After examining the optimal conditions, sufficient results were obtained if cells were fixed with a low concentration of glutaraldehyde and permeabilized with 0.1% saponin (data not shown). Since membranes were preserved sufficiently to allow for the identification of autophagosomes, we applied these fixation processes to the following experiment. In the CLEM analysis of atg9a KO MEFs, we found phagophores near structures positive for endogenous p62 and ULK1 (). In these images, two membrane structures were closely associated with each other. In one structure, p62 aggregates (and ULK1) disappeared from the lumen of the membrane (arrowheads, ). Interestingly, another one was an abnormally elongated membrane (arrows) that surrounded a small p62 aggregate. In most cases, such typical phagophores were not found. Instead, ER was partly attached to the aggregates (Fig. S4A and B), resembling the image of GFP-p62-expressing cells. These p62 aggregates sometimes included small fragments of phagophores (Fig. S4B, black arrowheads). Overall, membrane structures observed in cells expressing GFP-p62 were also found in the proximity of endogenous p62 in atg9a KO cells. To find proteins that are present on these potential phagophore precursors, we performed immunofluorescence microscopy (Fig. S4D). Among candidate proteins (FIP200, DFCP1, ATG16L, Syntaxin 17, GM130, Adaptin γ), only FIP200 colocalized with p62 in the atg9a KO cells. We also carried out the experiments in GFP-p62 expressing KO cells, with the same results (Fig. S4E).
Figure 5. Phagophore-like structures are found around endogenous p62 in atg9a KO cells. (A) atg9a KO MEFs were starved for 60 min, fixed, and immunostained with anti-ULK1 (green), anti-p62 (red), and anti-Tom20 (grey). Correlated regions were analyzed with SEM. The slice numbers of SEM and the z-stack numbers of FM are shown. The optical slice thickness of FM z-stacks is 180 nm Arrowheads, membranes inside of p62 aggregates. Arrows, membranes around p62 aggregates. (B) Magnified images of the ULK1- and p62-positive structure in (A). Arrowheads indicate the region without p62 and ULK1. Arrows indicate the p62- and ULK1-positive structure inside of the phagophore. (C) A segmented 3D model of p62 (green) and a phagophore (yellow). Also see Video S1B. Scale bars, 500 nm.
FIP200, but not ULK1, co-accumulated with ferritin and TAX1BP1
During these experiments, we used ULK1 as a marker for the autophagosome formation site. FIP200 is a component of the ULK complex and usually colocalizes with ULK1 at the site of autophagosome formation. Unexpectedly, we found that the localization patterns of FIP200 and ULK1 were often different in atg9a KO cells (). In these cells, ULK1 and p62 accumulated and colocalized, whereas FIP200 did not completely colocalize with the other two proteins. FIP200 often localized alongside ULK1 and p62 aggregates. Such a localization pattern of these three proteins was not observed in WT or atg7 KO cells (data not shown). To dissect the FIP200 localization, we performed a volume CLEM analysis ( and S5A). FIP200 fluorescent signals formed multiple puncta around a large p62 aggregate, which corresponded to electron-dense materials in EM images (). These puncta appeared to be membrane-free structures. Such high-density structures were previously reported as ferritin clusters in Atg9a-deficient cells [Citation27]. Ferritin is a major iron storage protein that is degraded by autophagy and ferritinophagy [Citation28]. In our immunofluorescence and immunoelectron experiments (Fig. S5B and C), ferritin localized in the periphery of p62 aggregates, which was similar to the localization pattern of FIP200. TAX1BP1, another receptor protein for selective autophagy, was reported to be involved in the localization of FIP200 [Citation29] and related to ferritinophagy [Citation30,Citation31]. Immunostaining of TAX1BP1 showed the same localization pattern as that of FIP200 ().
Figure 6. FIP200, but not ULK1, forms puncta with ferritin and TAX1BP1 in the vicinity of p62. (A) atg9a KO MEFs starved for 2 h, fixed, and immunostained against FIP200 (green), ULK1 (magenta), and p62 (red). (B) atg9a KO cells immunopositive for anti-FIP200 (green) and anti-p62 (red) are shown after they were labeled with MitoTracker Red (grey), starved for 2 h, fixed and immunostained. Representative FIB/SEM slice images and corresponding FM images are shown. The optical slice thickness of FM z-stacks is 80 nm. (C) Magnified images of FIP200-positive structures in (B). Black arrowheads indicate electron-dense structures corresponding to FIP200. White arrowheads point to the ER. (D) A segmented 3D model of p62 aggregates (red) and FIP200 (green). Also see Video S1D. (E) Cells were immunopositive for TAXBP1 (green) and p62 (red). (F) Preembedding immunoelectron microscopy with anti-TAX1BP1. Arrowheads, colloidal golds. Asterisk, electron-dense structures around p62. Scale bars, 2 µm in (A) and (E), 500 nm in (B) and (C), and 100 nm in (F).
Discussion
Here, we demonstrated aberrant and immature membrane structures similar to phagophores in atg9a KO cells with modified volume CLEM analysis. For the detailed analysis of ultrastructures, such as autophagic membranes, three-dimensional electron microscopy is an effective and essential method. Since it is difficult to observe rare objects in the electron microscope, especially in serial block-face imaging with FIB-SEM, we performed CLEM analysis. For the correlation of light and electron microscopic images, some positional markers (landmarks or fiducial markers) make it easier to correlate images [Citation16,Citation17]. Blood vessels [Citation32,Citation33] or artificial marking by laser branding [Citation34] are popular markers in tissue samples. For cultured cells, gridded glass-bottom dishes or coverslips are commonly used [Citation35]. However, as the size of these grids is too coarse, another internal fiducial marker is required for precise correlation. For CLEM on sections, fluorescent beads become excellent markers [Citation17,Citation36]. Fermie and his colleagues analyzed lysosomes with GFP-tagged LAMP1 and fluorescent dextran [Citation37]. We selected mitochondria as an intracellular landmark, resulting in high correlation images (). Although it is a simple method, CLEM studies that use mitochondria as a landmark have scarcely been conducted. In the most recent elegant work by Hoffman and colleagues, they also used mitochondria and ER as landmarks in frozen cells [Citation38]. In addition, our method with horizontal milling and imaging of flat cells could reduce the time and cost for FIB-SEM.
In atg9a KO cells, the majority of p62 aggregates were not engulfed by phagophores. Instead, unique small membrane structures were detected in close proximity to p62 (). Although our data are insufficient to argue for whether these crescent-shaped structures were involved in autophagy, such membrane structures seemed to be an initial stage of the phagophore. They seem to resemble the structures reported as cup-shaped vesicles in the recent CLEM analysis of atg2 KO cells [Citation39,Citation40]. ATG2 is known to interact directly with ATG9A [Citation41,Citation42]. Since the lipid transfer protein ATG2 and ATG9A are thought to cooperate in membrane elongation, it is reasonable to assume that membrane formation stops at a close stage. In addition, we observed phagophores (). The presence of these aberrant phagophores suggests that atg9a KO cells still retain the ability to generate phagophores. ATG9 vesicles are believed to be the seeds of autophagosome biogenesis. Recently, ATG9 was reported to exhibit lipid scrambling activity in vitro [Citation9,Citation10], which is possibly important for lipid supply and expansion of phagophores. It is rare to find phagophores and autophagosomes in atg9a KO cells. Our results indicated that phagophores could elongate without ATG9A, even though it was delayed and had imperfections. In addition to Atg9a, there is another paralog of mammalian Atg9, Atg9b. Although it has been reported that the expression of Atg9b is limited [Citation43], ATG9B might partially compensate for the function of ATG9A. The phagophores in this study were restricted to the regions adjacent to p62 aggregates, suggesting the possibility that atg9a KO cells could generate phagophores only when p62 aggregates (or other cargo and receptor proteins) exist as a platform for autophagosome formation. Moreover, further analysis is needed to determine the contribution of ATG9B and p62 aggregates. ER appeared frequently adjacent to p62 aggregates and phagophores in atg9a KO cells, although not in continuous close contact as seen in atg7 KO cells. This suggests that the autophagosome formation site is linked to the ER without atg9a. We speculate that atg9a is required for the maintenance of the contact site between the phagophore and ER.
ULK1 and FIP200 are components of the ULK complex, which is the most upstream factor in autophagy proteins. In the present high-resolution imaging study of atg9a KO cells, however, FIP200 showed different localization patterns from those of ULK1 and p62 (). ULK1 is known to bind directly to p62 [Citation44], so the ULK1 localization we see here could be due to accumulated p62. Although the localization pattern of FIP200 at this point differs from that of ULK1 and p62, we do not rule out the possibility that it is fundamentally ULK1- or p62-dependent. The present volume CLEM analysis revealed that FIP200 formed small clusters, which were adjacent to large p62 aggregates and ER, and these clusters could be the autophagosome formation sites in which FIP200 accumulated since the autophagy process did not proceed in atg9a KO cells. Moreover, ferritin and TAX1BP1 are known to be colocalized with the FIP200 cluster, as evidenced in the present study. It has been reported that ATG9A and FIP200 regulate ferritin turnover independent of canonical macroautophagy [Citation30]. The accumulation of ferritin clusters with FIP200 and TAX1BP1 around p62 aggregates appeared without membrane structures in atg9a KO cells in which autophagosome formation does not proceed. This indicates that ferritin turnover is deeply associated with TAX1BP1 and FIP200 in atg9a KO cells.
In conclusion, volume CLEM analysis is valuable for characterizing novel structures. It is difficult to find unidentified structures solely with conventional electron microscopy, and the currently available options for finding such structures are immunoelectron microscopy and CLEM. Immunoelectron microscopy is superior in positional accuracy, while CLEM is often suitable for maintaining fine structures. The structures we found in the present study are candidates for the initial stage of the phagophore. However, no data were available to prove this; FIP200 was present on ferritin clusters rather than in membrane structures and other autophagy-related proteins did not localize around GFP-p62 in atg9a KO (Fig. S4D). One of the main limitations of our analysis is that the indirect marker p62 was employed. Our present data could not show the proteins that localized on the initial stage membranes in atg9a KO cells. It is essential to find such proteins to improve our understanding of the earliest stage of autophagosome formation.
Materials and Methods
Cell culture and transfection
MEFs were isolated from the embryos of wild-type, atg7-knockout [Citation45], and atg9a-knockout mice [Citation46] and immortalized by infecting with a recombinant retrovirus carrying a temperature-sensitive simian virus 40 large T antigen. MEFs were cultured in DMEM (Nacalai, 08545845) supplemented with 100 U/mL penicillin, 100 µg/mL streptomycin (Nacalai, 26253-84) and 10% fetal bovine serum (GIBCO, 10437-028) at 37 °C with 5% CO2. Amino acid starvation was induced by incubation for 1–2 h in DMEM with sodium pyruvate and without amino acids (Wako, 048-33575). For protein expression, cells were transfected using Lipofectamine 3000 reagent (Invitrogen, L3000008) according to the manufacturer’s instructions. To generate a GFP-p62 plasmid, an open reading frame of the human p62/SQSTM1 gene was subcloned into the pAcGFP-C1 vector (Clontech, 632470). ATG9A-GFP plasmid have been generated as described previously [Citation5].
Antibodies
Mouse anti-βActin (Sigma, A5441), rabbit anti-LC3A/B (Cell Signaling Technology, 4108), rabbit anti-ATG7 (Cell Signaling Technology, 8558), rabbit anti-ATG9A (Cell Signaling Technology, 13509) were used for immunoblot analysis. The following reagents were used for immunostaining. Guinea pig anti-p62/SQSTM1 (GP62-C) was purchased from Progen. Mouse anti-ULK1 (F-4, sc-390904) and anti-Tom20 (F-10, sc-17764) and rabbit anti-Tom20 (FL145, sc-11415) were purchased from Santa Cruz Biotechnology. Mouse anti-LC3 (Clone LC3-1703, CTB-LC3-2-IC), rabbit anti-ATG16L (TMD-PH-AT16L) were purchased from Cosmo Bio. Rabbit anti-FIP200/RB1CC1 (17250-1-Ap) was purchased from Protein Tech. Rabbit anti-TAX1BP1 (D1D5, 5105) was purchased from Cell Signaling Technology. Mouse anti-ferritin (F6136) and rabbit anti-syntaxin 17 (HPA001204) were purchased from Sigma. Mouse anti-GM130 (610822) and mouse anti-adaptin gamma (610385) were purchased from BD Biosciences. Rabbit anti-DFCP1 #2 was described in the previous study [Citation47]. Goat anti-rabbit IgG nanogold conjugate (for immunoelectron microscopy) was purchased from Nanoprobes (2004-0.5ML).
Immunoblotting
SDS-PAGE and immunoblot analysis was performed as described previously [Citation5]. Briefly, proteins from cell lysates were separated by SDS-PAGE and transferred to a PVDF membrane (Immobilon-P, Millipore, IPVH07850) for immunoblotting. Blotted membranes were incubated with primary antibodies for 2 h at room temperature, followed by incubation with HRP-conjugated secondary antibodies for 1 hr. A Fusion FX western blot imaging system (Vilber Lourmat, Marne-la-Vallée, France) with FEMTOGLOW Plus (Michigan Diagnostic LLC, SHRPE21008) was used to detect protein bands.
Fluorescence microscopy
For immunostaining (), cells were starved and then fixed with 2% paraformaldehyde (PFA) in phosphate-buffered saline (PBS; Nacalai, 14249-95) for 20 min, permeabilized with 0.5% saponin (Wako, 199-18653), and blocked with 1% BSA in PBS. They were incubated with primary antibodies overnight followed by incubation with secondary antibodies conjugated with Alexa488, Alexa555, or Alexa680 for 2 h in PBS containing DAPI (Dojindo, 342-07431). Finally, cover slips were mounted on glass slides with VECTA shield Vibrance antifade mounting medium (Thermo, H-1700) and observed using a laser scanning confocal microscope TCS SP5 HyVolution with a 63x oil-immersion objective lens (Leica Microsystems, Wetzlar, Germany; for ). The images from Leica Hyvolution were deconvolved using Huygens Essential (Scientific Volume Imaging, Hilversum, Netherlands). Quantification was performed using ImageJ software. For CLEM analysis, cells were cultured on gridded glass coverslips (Matsunami, GC1310) that were coated with carbon using a carbon coater CADE-4T (Meiwa Fosis, Tokyo, Japan) for easy removal of coverslips after embedding [Citation37]. For live-staining CLEM in , cells transiently expressing GFP-p62 were stained with MitoTracker Red CMXROS (Invitorogen, M7512) for 30 min, starved for 1 h and fixed with 2% PFA, 1% glutaraldehyde, and 50 mM sucrose in PBS for 1 h. After DAPI staining for 30 min, cover slips were mounted in the Cellcyto chamber (TOKAI HIT, Shizuoka, Japan) and observed with LSM880 Airyscan with a 63x oil-immersion objective lens (Zeiss, Munich, Germany; for ). For immunostaining CLEM in , cells were fixed with 2% PFA, 0.025% glutaraldehyde, and 50 nM sucrose in PBS for 30 min. After permeabilization with 0.1% saponin for 5 min, immunostaining was performed as described above. The pixel resolution of these CLEM data was set at the pixel size of 40 nm (, S3B, and 4) or 80 nm (Figures S3A, S4, S5, and 6) in the XY axis. The optical thickness, z-stack step size, was 200 nm (), 180 nm (), or 80 nm (, S3, 4A, S5, and 6). Quantification was performed using ImageJ software. Images were converted to gray scale and binarized at arbitrary thresholds. The same threshold value was applied to the same proteins. The area of each signal was measured using Analyze Particles. To estimate the cytoplasmic area in , the area was measured by lowering the threshold until the signal cover almost the cytoplasm. For Figure S1, cytoplasmic area of ATG9A-GFP cells or ATG9A-GFP-negative cells were traced manually, excluding nuclei. At least 20 cells were counted for each experiment. Data were reported as the means and standard errors of the mean of 4 or 5 samples.
Statistical analysis
Statistical analysis was performed using one-way ANOVA with Tukey’s multiple comparisons using GraphPad Prism (GraphPad software Inc, California, USA).
Electron microscopy
For correlative electron microscopy, cells after fluorescence imaging were fixed with 2% glutaraldehyde containing 50 mM sucrose in 0.1 M phosphate buffer, pH7.4 (LSI Medience, RM102-5L) for 1 h, followed by postfixation with 1% OsO4 in phosphate buffer for 30 min. In general, the sample for serial block face scanning electron microscopy was treated with reduced osmium-thiocarbohydrazide-osmium (rOTO) for high contrast staining. However, it is well known that rOTO alters some intracellular structures, e.g., it removes ribosomes. We used a normal fixation protocol other than rOTO to make it easier to compare the present data obtained with those of previous studies. Fixed specimens were subjected to en bloc staining with 1% uranyl acetate for 2 h, dehydrated with a graded series of ethanol, and embedding in an epoxy resin, Epon812 (Oken shoji, 02-1003). The standard CLEM analysis in Fig. S1C was performed as described previously [Citation5]. Briefly, ultrathin sections were cut with an ultramicrotome UC7 (Leica Microsystems, Wetzlar, German), mounted on glass coverslips, and stained with uranyl acetate and lead citrate. Areas observed by fluorescence microscopy were observed with a scanning electron microscope Helios NanoLab 660 (FEI, Oregon, USA). For the volume CLEM analysis, polymerized epoxy blocks were coated with Au/Pd by an E-1010 ion sputter coater (Hitachi, Tokyo, Japan). ROIs were found using a grid pattern as a guide under a FIB-SEM Helios NanoLab 660 (FEI, Oregon, USA). These areas were marked with platinum deposition at 20 µm from the center of the ROIs. Epoxy blocks were removed from the FIB/SEM and cut into small pieces including each ROI. The sample was vertically attached on an SEM stub (). In conventional protocols, the ion beam mills the block vertically to the surface, and the resulting SEM image is a vertical cross section of the flat cell (Fig. S2A left). The cell structures in the vertical section are much smaller than those in the horizontal section (Fig. S2A right). If the vertical length of the ROI is 10 µm and the slice thickness is 20 nm, five hundred imaging cycles are needed. On the other hand, since the height of the MEF is usually less than 3 µm, imaging of horizontal slices finishes within 150 cycles. Therefore, our method saves time and cost. The sample was trimmed with an ultramicrotome to the deposition marks. The deeper the ROI is, the longer the FIB milling time for serial block face imaging, so we tried to keep the distance from the top surface to the ROI as short as possible. After recoating with Au/Pd, samples were set into the FIB-SEM for serial block-face imaging. Samples were tilted until the side of the face, the surface of the cell bottom, was perpendicular to the FIB axis (Fig. S2B). In the conventional protocol with vertical slicing, electrons can be hindered by the Epon block, resulting in shadowing [Citation21]. Furthermore, the XY plane of FM z-stack images corresponds to the XZ or YZ plane of EM images when following the conventional protocol. In addition to the highest resolution of the XY plane, only XY is raw data, while other planes are reconstructed images. Thus, the shapes and sizes of planes other than XY are not accurate. On the other hand, the XY plane of FM images corresponds to the XY plane of EM images in our method, which facilitated the correlation of EM images with FM images. With the FIB-SEM method, only the top surface of the sample block is visible in the FIB image, while the ROI on the side is visible in the SEM image (Fig. S2B and C). The ROI was found with deposition marks. Serial imaging was performed every 20 nm by using a backscattered electron detector (MD detector) at an acceleration voltage of 2.0 kV and a current of 0.4 nA with a pixel dwell time of 30 µs. The image resolution was 3072 x 2048 pixels with a width of 13.8 µm at a magnification of 15,000x (the X and Y pixel sizes were 4.5 and 4.7 nm, respectively). These serial block-face FIB-SEM images z-stack and FM images were manually correlated using Amira 3D software (FEI, Oregon, USA). The shapes and positions of mitochondria were used as fiducial points for precise correlation (). The 3D reconstruction was performed with Amira 3D. For immunoelectron microscopy, immunostaining was performed as described above except nanogold-conjugated antibodies were used as secondary antibodies. After immunostaining, cells were fixed with 1% glutaraldehyde in PBS for 30 min. Gold enhancement was performed using GOLDENHANCE EM Plus (Nanoprobes, 2114) according to the manufacturer’s instructions, followed by osmium fixation and embedding for EM. These samples were examined with a JEM-1400 Flash transmission electron microscope (JEOL, Tokyo, Japan). All images were edited with Affinity Designer (Serif, Nottingham, United Kingdom) for figures.
Supplemental Material
Download Zip (20.3 MB)Acknowledgments
We thank Masaaki Komatsu for providing atg7 KO mice, and Tatsuya Saitoh for atg9a KO mice. The authors thank members of the Uchiyama laboratory for technical assistance and helpful comments. We also thank members of the Laboratory of Morphology and Image Analysis, Biomedical Research Core Facilities, Juntendo University Graduate School of Medicine for technical assistance with microscopy. This work was supported by a Grant-in-Aid for Young Scientists (B) (17K15550 to S. Kakuta). This work was also supported by the Project for Elucidating and Controlling Mechanisms of Aging and Longevity from the Japan Agency for Medical Research and Development (AMED 21gm5010003 to Y. Uchiyama) and by the MEXT-supported Program for the Strategic Research Foundation at Private Universities (to Y. Uchiyama).
Disclosure statement
No potential conflict of interest was reported by the authors.
Supplementary Material
Supplemental data for this article can be accessed online at https://doi.org/10.1080/27694127.2023.2256599
References
- Melia TJ, Lystad AH, Simonsen A. Autophagosome biogenesis: From membrane growth to closure. J Cell Biol. 2020 Jun 1;219(6).
- Nakatogawa H. Mechanisms governing autophagosome biogenesis. Nat Rev Mol Cell Biol. 2020 Aug;21(8):439–19.
- Nishimura T, Tooze SA. Emerging roles of ATG proteins and membrane lipids in autophagosome formation. Cell Discov. 2020;6(1):32.
- Itakura E, Kishi-Itakura C, Koyama-Honda I, et al. Structures containing Atg9A and the ULK1 complex independently target depolarized mitochondria at initial stages of Parkin-mediated mitophagy. J Cell Sci. 2012 Mar 15;125(Pt 6):1488–99.
- Kakuta S, Yamaguchi J, Suzuki C, et al. Small GTPase Rab1B is associated with ATG9A vesicles and regulates autophagosome formation. FASEB J. 2017 Sep;31(9):3757–3773.
- Puri C, Renna M, Bento CF, et al. ATG16L1 meets ATG9 in recycling endosomes: additional roles for the plasma membrane and endocytosis in autophagosome biogenesis. Autophagy. 2014 Jan;10(1):182–4.
- Sawa-Makarska J, Baumann V, Coudevylle N, et al. Reconstitution of autophagosome nucleation defines Atg9 vesicles as seeds for membrane formation. Science. 2020 Sep 4;369(6508).
- Guardia CM, Christenson ET, Zhou W, et al. The structure of human ATG9A and its interplay with the lipid bilayer. Autophagy. 2020 Dec;16(12):2292–2293.
- Maeda S, Yamamoto H, Kinch LN, et al. Structure, lipid scrambling activity and role in autophagosome formation of ATG9A. Nat Struct Mol Biol. 2020 Dec;27(12):1194–1201.
- Matoba K, Kotani T, Tsutsumi A, et al. Atg9 is a lipid scramblase that mediates autophagosomal membrane expansion. Nat Struct Mol Biol. 2020 Dec;27(12):1185–1193.
- Orsi A, Razi M, Dooley HC, et al. Dynamic and transient interactions of Atg9 with autophagosomes, but not membrane integration, are required for autophagy. Mol Biol Cell. 2012 May;23(10):1860–73.
- Runwal G, Stamatakou E, Siddiqi FH, et al. LC3-positive structures are prominent in autophagy-deficient cells. Sci Rep. 2019 Jul 12;9(1):10147.
- Peddie CJ, Collinson LM. Exploring the third dimension: volume electron microscopy comes of age. Micron. 2014 Jun;61:9–19.
- Miranda K, Girard-Dias W, Attias M, et al. Three dimensional reconstruction by electron microscopy in the life sciences: An introduction for cell and tissue biologists. Mol Reprod Dev. 2015 Jul-Aug;82(7–8):530–47.
- Titze B, Genoud C. Volume scanning electron microscopy for imaging biological ultrastructure. Biol Cell. 2016 Nov;108(11):307–323.
- Ando T BS, Brending N, Colin-York H, et al. The 2018 correlative microscopy techniques roadmap. . J Phys D Appl Phys. 2018;51(44):443001.
- de Boer P, Hoogenboom JP, Giepmans BN. Correlated light and electron microscopy: ultrastructure lights up! Nat Methods. 2015 Jun;12(6):503–13.
- Guerin CJ, Lippens S. Correlative light and volume electron microscopy (vCLEM): How community participation can advance developing technologies. J Microsc. 2021 Nov;284(2):97–102.
- Lippens S, Jokitalo E. 3D CLEM: Correlating Volume Light and Electron Microscopy. In: Collinson L, Verkade P, eds. Correlative Imaging: Focusing on the Future. Hoboken, NJ: John Wiley & Sons Ltd.; 2019:67–79.
- Heymann JA, Hayles M, Gestmann I, et al. Site-specific 3D imaging of cells and tissues with a dual beam microscope. J Struct Biol. 2006 Jul;155(1):63–73.
- Kizilyaprak C, Bittermann AG, Daraspe J, et al. FIB-SEM tomography in biology. Methods Mol Biol. 2014;1117:541–58.
- Zhou X, Huang L. DNA transfection mediated by cationic liposomes containing lipopolylysine: characterization and mechanism of action. Biochim Biophys Acta. 1994 Jan 19;1189(2):195–203.
- Jonker C, de Heus C, Faber L, et al. An adapted protocol to overcome endosomal damage caused by polyethylenimine (PEI) mediated transfections. Matters. 2017.
- Kageyama S, Gudmundsson SR, Sou YS, et al. p62/SQSTM1-droplet serves as a platform for autophagosome formation and anti-oxidative stress response. Nat Commun. 2021 Jan 4;12(1):16.
- Agudo-Canalejo J, Schultz SW, Chino H, et al. Wetting regulates autophagy of phase-separated compartments and the cytosol. Nature. 2021 Mar;591(7848):142–146.
- Yamaguchi J, Suzuki C, Nanao T, et al. Atg9a deficiency causes axon-specific lesions including neuronal circuit dysgenesis. Autophagy. 2018;14(5):764–777.
- Kishi-Itakura C, Koyama-Honda I, Itakura E, et al. Ultrastructural analysis of autophagosome organization using mammalian autophagy-deficient cells. J Cell Sci. 2014 Sep 15;127(Pt 18):4089–102.
- Asano T, Komatsu M, Yamaguchi-Iwai Y, et al. Distinct mechanisms of ferritin delivery to lysosomes in iron-depleted and iron-replete cells. Mol Cell Biol. 2011 May;31(10):2040–52.
- Ohnstad AE, Delgado JM, North BJ, et al. Receptor-mediated clustering of FIP200 bypasses the role of LC3 lipidation in autophagy. EMBO J. 2020 Dec 15;39(24):e104948.
- Goodwin JM, Dowdle WE, DeJesus R, et al. Autophagy-Independent Lysosomal Targeting Regulated by ULK1/2-FIP200 and ATG9. Cell Rep. 2017 Sep 5;20(10):2341–2356.
- Ohshima T, Yamamoto H, Sakamaki Y, et al. NCOA4 drives ferritin phase separation to facilitate macroferritinophagy and microferritinophagy. J Cell Biol. 2022 Oct 3;221(10).
- Karreman MA, Hyenne V, Schwab Y, et al. Intravital Correlative Microscopy: Imaging Life at the Nanoscale. Trends Cell Biol. 2016 Nov;26(11):848–863.
- Thomas CI, Ryan MA, Scholl B, et al. Targeting Functionally Characterized Synaptic Architecture Using Inherent Fiducials and 3D Correlative Microscopy. Microsc Microanal. 2021 Feb;27(1):156–169.
- Maco B, Holtmaat A, Cantoni M, et al. Correlative in vivo 2 photon and focused ion beam scanning electron microscopy of cortical neurons. PLoS One. 2013;8(2):e57405.
- Russell MR, Lerner TR, Burden JJ, et al. 3D correlative light and electron microscopy of cultured cells using serial blockface scanning electron microscopy. J Cell Sci. 2017 Jan 1;130(1):278–291.
- Kukulski W, Schorb M, Welsch S, et al. Correlated fluorescence and 3D electron microscopy with high sensitivity and spatial precision. J Cell Biol. 2011 Jan 10;192(1):111–9.
- Fermie J, Liv N, Ten Brink C, et al. Single organelle dynamics linked to 3D structure by correlative live-cell imaging and 3D electron microscopy. Traffic. 2018 May;19(5):354–369.
- Hoffman DP, Shtengel G, Xu CS, et al. Correlative three-dimensional super-resolution and block-face electron microscopy of whole vitreously frozen cells. Science. 2020 Jan 17;367(6475).
- Gudmundsson SR, Kallio KA, Vihinen H, et al. Morphology of Phagophore Precursors by Correlative Light-Electron Microscopy. Cells. 2022 Sep 30;11(19).
- Olivas TJ, Wu Y, Yu S, et al. ATG9 vesicles comprise the seed membrane of mammalian autophagosomes. J Cell Biol. 2023 Jul 3;222(7).
- Ghanbarpour A, Valverde DP, Melia TJ, et al. A model for a partnership of lipid transfer proteins and scramblases in membrane expansion and organelle biogenesis. Proc Natl Acad Sci U S A. 2021 Apr 20;118(16).
- van Vliet AR, Chiduza GN, Maslen SL, et al. ATG9A and ATG2A form a heteromeric complex essential for autophagosome formation. Mol Cell. 2022 Nov 17;82(22):4324–4339 e8.
- Yamada T, Carson AR, Caniggia I, et al. Endothelial nitric-oxide synthase antisense (NOS3AS) gene encodes an autophagy-related protein (APG9-like2) highly expressed in trophoblast. J Biol Chem. 2005 May 6;280(18):18283–90.
- Ikeda R, Noshiro D, Morishita H, et al. Phosphorylation of phase-separated p62 bodies by ULK1 activates a redox-independent stress response. EMBO J. 2023 Jun 12:e113349.
- Komatsu M, Waguri S, Ueno T, et al. Impairment of starvation-induced and constitutive autophagy in Atg7-deficient mice. J Cell Biol. 2005 May 9;169(3):425–34.
- Saitoh T, Fujita N, Hayashi T, et al. Atg9a controls dsDNA-driven dynamic translocation of STING and the innate immune response. Proc Natl Acad Sci U S A. 2009 Dec 8;106(49):20842–6.
- Nanao T, Koike M, Yamaguchi J, et al. Cellular localization and tissue distribution of endogenous DFCP1 protein. Biomed Res. 2015;36(2):121–33.