
ABSTRACT
Being present in substantial numbers, astrocytes play an indispensable role in maintaining homeostasis in the brain. However, their positive or negative involvement in pathological conditions in the brain has not been explored much. In recent years, an emerging thought of targeting astrocytes for the resolution of neurodegenerative diseases has gained momentum. In this study, we have attempted to explore the likelihood of targeting astrocytes by using a natural compound, gentiacaulein (GENT), for clearance of amyloid-β (Aβ) through autophagy and amelioration of neuroinflammation associated with Aβ. We found that GENT treatment of astrocytes hampered the transport of glucose across the cell membrane, which resulted in a reduction in ATP production. With increased treatment time, AMP: ATP ratio was increased significantly, which caused the induction of PRKAA1-mediated autophagy. We further show that increased autophagy considerably enhanced the clearance of amyloid-β by astrocytes. GENT reduced the Aβ mediated inflammation by inhibiting the nuclear translocation of NF-κB and decreased the release of inflammatory cytokines TNF-α and IL-6. The role of PRKAA1 in GENT-induced autophagy and anti-inflammatory activity was confirmed when its knockdown reversed these effects. Our data suggest that targeting astrocytes can be a good strategy to prevent/treat Alzheimer’s disease.
Introduction
Astrocytes constitute a significant proportion of non-neuronal cells in the brainCitation1,Citation2. They play a multifaceted role to preserve the physiological homeostasis in the brain Citation3,Citation4. Astrocytes help neurons by providing them structural and nutritional support, sustaining the integrity of the blood-brain barrier and they also play a crucial immunological role under different conditionsCitation5,Citation6. Some recent work has shown that astrocytes play a prime role in the pathology of various neurodegenerative diseases including Alzheimer’s disease (AD) Citation7. The progression of AD is accompanied by the formation of extracellular amyloid-β plaques, and intracellular neurofibrillary tangles of tau protein along with disruption of neuronal synapse and neuroinflammationCitation8,Citation9. Astrocytes work against AD pathology by clearing Aβ through phagocytosis and autophagic degradation and by secretion of proteolytic enzymes Citation10-12. However, under pathological conditions, astrocytes may contribute to further deterioration of AD-related neuroinflammation and death of neuronsCitation13,Citation14. Aβ deposition is considered to be one of the crucial factors responsible for the reactive proinflammatory phenotype of the astrocytes Citation15,Citation16. Therefore, targeting AD pathology through the modulation of astrocytes functioning can be a good consideration for the development of new therapeutics against AD Citation13,Citation17.
Sporadic AD is an age-related disorder, which progresses through the slowing down of several Aβ clearance mechanisms including autophagyCitation18,Citation19. Astrocytes can contribute significantly in lowering the Aβ load through autophagy and thus, can also lead to a reduction in Aβ related neuroinflammation in the brain. Therefore, we designed this study to ascertain if the elicitation of autophagy can assist in the clearance of Aβ and whether the inflammation induced by Aβ can be downregulated through the induction of autophagy in astrocytes. In this study, to induce autophagy in astrocytes, we used a natural compound gentiacaulein (GENT), which belongs to a class of compounds called xanthones. GENT was isolated from Gentiana kochiana, which was collected from the Leh region of India. A literature survey of GENT revealed its pharmacological properties ranging from anti-hypertensive, anti-depressant, anxiolytic, spasmolytic, and anti-pyritic, etc. Citation20,Citation21. However, there is no report on the induction of autophagy by GENT. We show in this study that GENT induced autophagy by inhibiting glucose transport, which led to increased AMP: ATP ratio and induction of the AMPK/PRKAA1 pathway. We further show that GENT treatment of astrocytes led to significant clearance of Aβ and reduction in inflammation markers. However, the knockdown of AMPK almost completely stopped the autophagy and resulted in reduced clearance of Aβ and restoration of inflammation. The findings of this study emphasize the use of GENT or other autophagy inducers to modulate the activities of astrocytes against AD pathology. In the absence of any effective anti-AD therapy, this study may open a new way to treat AD.
Results
Gentiacaulein induces autophagy in mouse primary astrocytes
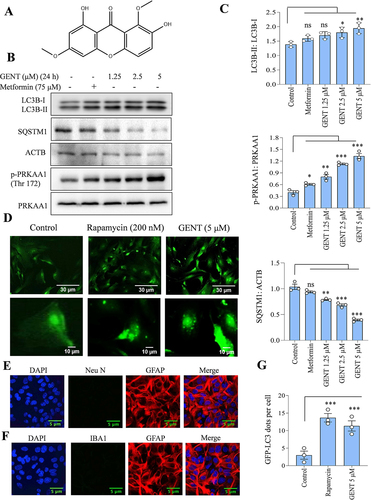
In our preliminary studies, we found that gentiacaulein (GENT) () after 24 h treatment induced autophagy in a concentration-dependent manner (1.25 to 5 µM) in primary astrocytes, which was evident through the increased intensity of LC3B-II band and degradation of SQSTM1 (). Additionally, GENT also induced the phosphorylation of PRKAA1 (Thr 172), thus indicating the involvement of the PRKAA1 pathway in the autophagy induced by GENT (). Metformin in this experiment was used as a standard. Further, the formation of LC3B-II puncta in primary astrocytes by 5 µM of GENT treatment also confirmed the induction of autophagy in primary astrocytes, rapamycin used as a standard also displayed a similar effect (). The astrocytes used in all these experiments were tested for contamination of neurons and microglial cells by using markers of astrocytes (GFAP) and neurons (NEUN) () and microglial cells IBA1 through immunofluorescence ().
Figure 1. GENT induced autophagy in primary astrocytes. (A) Chemical structure of Gentiacaulein. (B) Western blot examination for LC3B-II, SQSTM1, and p-PRKAA1 (Thr 172) after concentration-dependent treatment of astrocytes with GENT for 24 h. (C) Densitometry of the western blots for LC3B-II, SQSTM1, and p-PRKAA1 (Thr 172). The normalization of LC3B-II was done with LC3B-I and SQSTM1 was done using ACTB while that of p-PRKAA1 (Thr 172) was done with PRKAA1. (D) Confocal microscopy analysis for GFP-LC3 puncta formation after treating primary astrocytes with rapamycin (200 nM) as a standard and GENT (5 µM) for 24 h. The puncta were counted manually after taking the images at 40x. (E, F) Confocal microscope images of GFAP, NEUN, and IBA1 as markers for astrocytes and neurons respectively to check the purity of astrocytes at 40x.(G) Graphical representation of the average number of puncta per cell from three similar experiments. ImageJ software was used to insert the scale bar in confocal images and for densitometric analysis of western blots while one-way ANOVA and post-hoc Bonferroni test appertained to test the statistical significance. The p-value < 0.05 was considered to be significant with values defined as *p< 0.05, **p<0.01, ***p<0.001.
GENT induced autophagy flux in primary astrocytes
On the basis of the concentration-dependent effect of GENT on LC3B-II, we chose 5 µM concentration for calculating the autophagic flux caused by GENT in primary astrocytes. We treated astrocytes in a time-dependent manner through 24 h with GENT in the presence and absence of end-stage autophagy inhibitor bafilomycin A1. It binds with V-ATPase ATP6V0C/V0 subunit c of lysosome and reduces its acidity by inhibiting the passage of proton into the lumen of lysosome thereby preventing the fusion of autophagosome and lysosome. We checked for the levels of LC3B-II to assess the autophagy flux. The cells treated with GENT alone showed a significant rise in LC3B-II levels, which was further upregulated in the presence of bafilomycin A1 indicating the accumulation of autophagolysosomes ( and Supplementary Figure S1A). We further confirmed the induction of autophagy by analyzing the formation of autophagosomes and autolysosomes by using transmission electron microscopy (TEM). We found a significant increase in the formation of autophagosomes (purple arrows) and autolysosomes (yellow arrows) in the astrocytes treated with rapamycin and GENT in comparison to the untreated control cells, which appeared to have very few autophagic vesicles ( and Supplementary Figure S1B).
Figure 2. Analysis of autophagy flux in astrocytes after treatment with GENT in the presence or absence of bafilomycin A1. (A) Examination of autophagy flux through Western blotting of LC3B-II with or without bafilomycin A1. (B) TEM images to show the autophagosomes in primary astrocytes treated with Rapamycin and GENT (5 µM). Different color arrows indicate yellow (autolysosomes), purple (autophagosome), orange (autophagophore), and black (lysosome). Scale bars were drawn using ImageJ software. (C) Confocal images to check the expression of LAMP1 in primary astrocytes after treatment with GENT (5 µM) in the presence and absence of bafilomycin A1. The presented images are from one of the three similar experiments. The scale bar was inserted using ImageJ software. (D) Confocal images of primary astrocyte stained with Cathepsin D antibody (Green) to show lysosome acidification after treatment with GENT which was comparable to standard rapamycin. Scale bar 15 μm. (E) Colocalization of LC3B-II and LAMP1 after treatment with GENT. Immunofluorescence of primary astrocytes stained for LAMP1 (Red) and LC3B-II (Green). The green puncta represent LC3 positive structures and the red dots represent the LAMP1 positive structures. Merged images indicate colocalization of LAMP 1 and LC3B-II (yellow dots indicated with white arrows) giving more details of their overlap. Scale bar 14 μm. The fluorescent images were quantified by using CellPathfinder software. One-way ANOVA was applied for statistical comparisons with the post-hoc Bonferroni test. The p-value <0.05 was considered significant with values defined as *p< 0.05, **p<0.01, ***p<0.001
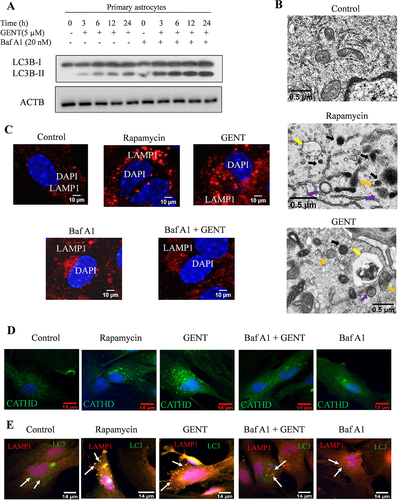
These findings were further confirmed when we checked the expression of LAMP1 in astrocytes treated with GENT in the presence and absence of bafilomycin A1. The cells treated with GENT displayed high expression of LAMP1. However, with bafilomycin A1 present, the expression of LAMP1 was highly diminished ( and Supplementary Figure S1C). Rapamycin used as a standard in this experiment also enhanced the expression of LAMP1 significantly ( and Supplementary Figure S1C). In addition to LAMP1 staining, we also checked for the presence of acidic lysosomes after treatment with GENT by staining the astrocytes with Lysotracker DND Red dye and Cathepsin D staining in separate experiments. The cells treated with GENT and rapamycin displayed significantly high intensity of red fluorescence indicating the formation of acidic vesicles (Supplementary Figures S1D & E) and green fluorescence indicating cathepsin D, whereas the cells treated with the combination of GENT and bafilomycin A1 showed negligible fluorescence of both lysotracker and cathepsin D (, Supplementary Figures S1D, E, F & G). To further confirm whether GENT-induced autophagy involved the fusion of lysosome with autophagosome, we checked the co-localization of LAMP1 and LC3 after treating astrocytes with GENT in the presence and absence of bafilomycin A1. We found that GENT significantly increased the co-localization of LAMP1 (green) and LC3 positive (red) vesicles ( and Supplementary Figures S1H & I). Rapamycin, which was used as a standard had a similar effect on co-localization ( and Supplementary Figures S1H & I). However, addition of autophagy inhibitor bafilomycin A1 reduced the LAMP1 and LC3 positive structures and their colocalization as well.
GENT did not show any toxic effect in primary astrocytes and hepatocytes when compared to the standard rapamycin
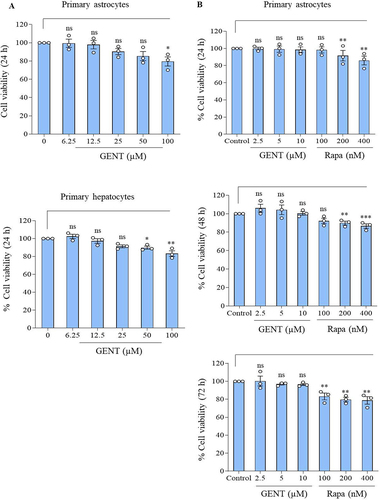
We further wanted to know if GENT has any cytotoxicity at the concentration (5 µM) used in this study. Therefore, we used two different types of cells that are primary astrocytes and hepatocytes to assess the effect of GENT for 24 h on cell viability by using MTT assay. GENT did not show any significant toxicity in primary astrocytes up to 25 µM, whereas, in hepatocytes, it did not show significant toxicity even at 50 µM (). Apart from testing the effect of GENT on the viability of different cell types, we also compared the effect of three concentrations of GENT and rapamycin on the viability of astrocytes over a period of 72 h. Interestingly, rapamycin induced significant toxicity at the concentrations of 200 and 400 nM through 72 h, whereas it significantly reduced the cell viability even at 100 nM after 72 h treatment of astrocytes (). GENT on the other hand did not show any toxicity at any of the concentrations (2.5, 5.0, and 10 µM) used in this experiment ().
Figure 3. MTT assay to check the effect of GENT on cell viability. (A) GENT did not show any significant toxicity for 24 h even at 25 μM concentration in two different cell types including primary astrocytes and primary hepatocytes. (B) Comparison of the effect of GENT and rapamycin on cell viability of astrocytes. GENT did not show any cytotoxicity at the working concentrations through 72 h of treatment of astrocytes. Statistical comparisons were made by using one-way ANOVA followed by the Bonferroni test. The value of control was calculated as 100 percent in each experiment and each data point represents one independent experiment and the p-value <0.05 was considered significant with values shown as *p< 0.05, **p<0.01, ***p<0.001.
GENT induces autophagy via AMPK/PRKAA1 pathway and independent of MTOR
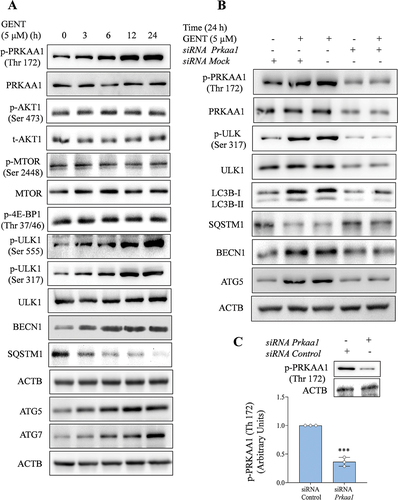
After confirming the autophagy induction by GENT in primary astrocytes, we further attempted to explore the mechanism of autophagy induced by GENT. We focused on the PRKAA1 pathway, which is one of the main mechanisms involved in autophagy induction. Treatment of astrocytes with GENT (5 µM) clearly enhanced the phosphorylation of PRKAA1 at Thr 172 in a time-dependent manner through 24 h. Activation of PRKAA1 further caused phosphorylation and activation of ULK1 (Ser 555 & Ser 317). However, we wanted to know the effect of GENT on the AKT-MTOR pathway as well. But we did not find any change in the expression of pAKT (Ser 473) or inhibition of MTOR (Ser 2448). The findings were further confirmed when no change in the expression of its downstream target p-4E-BP1 (Thr 37/46) was observed ( and Supplementary Figure S2A). Further, GENT treatment caused the activation of other autophagy-related proteins ATG5, ATG7, and BECN1 and led to the degradation of SQSTM1 ( Supplementary Figure S2A). In order to confirm the involvement of PRKAA1 in autophagy induced by GENT, we knocked down PRKAA1in primary astrocytes and checked if the expression of autophagic proteins is affected after treatment with GENT or not. The data clearly indicated that autophagy induced by GENT involved the activation of PRKAA1. The expression of LC3B-II and other autophagy related proteins like ATG5 and BECN1 was significantly diminished in contrast to the wild-type primary astrocytes ( and Supplementary Figure S2B). The phosphorylation of downstream target protein p-ULK1 (Ser 317) also displayed similar results ( and Supplementary Figure S2B).); Thus, confirming the involvement of PRKAA1 in GENT induced autophagy. In all the knock-down experiments the expression of p-PRKAA1 (Thr 172) was checked after treatment with siPrkaa1, which showed >70% downregulation ( and Supplementary Figure S2B).
Figure 4. GENT-induced autophagy in astrocytes is mediated by the PRKAA1 pathway. (A) GENT at a concentration of 5 μM, time-dependently increased the expression level of p-PRKAA1 (Thr 172) while it had no effect on p-MTOR (Ser 2448) level as shown by the representative images of Western blotting. Which was also evident by no effect on 4E-BP1. It also enhanced the levels of proteins involved in autophagy machinery viz p-ULK 1 (Ser 317), p-ULK 1 (Ser 555), BECN1, SQSTM1, ATG5, and, ATG7 in a time-dependent manner at the same concentration. In order to normalize the protein level, β-Actin was used and the quantification was done using ImageJ software. (B) Western blots representing the effect of knockdown of PRKAA1 with siPrkaa1in GENT-treated astrocytes on the expression levels of pPRKAA1 (Thr 172), PRKAA1, pULK-1 (Ser 317), ULK1, LCB-II, SQSTM1, BECN and ATG 5. (C) Transfection of primary astrocytes with siPrkaa1 significantly reduced PRKAA1 expression when compared to the control cells transfected with mock siRNA. Data shown here are the mean ±SD of three independent experiments and the Bonferroni test was employed to calculate the statistical significance. The value of siRNA control was taken as 1 arbitrary unit (AU) in each experiment and each data point on the graph corresponds to one independent experiment. The p-value <0.05 was considered significant with values defined as *p< 0.05, **p<0.01, ***p<0.001.
GENT inhibits glucose transport to increase AMP: ATP ratio
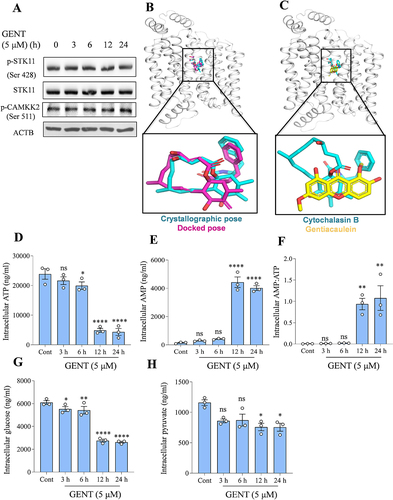
After deciphering the mechanism of autophagy induction downstream of PRKAA1, we wanted to know the exact cause of PRKAA1 activation. To do that, we checked the status of the two most important kinases STK11 (Ser 428) and CAMKK2 (Ser 511) that can phosphorylate and activate PRKAA1. However, we did not find any change in their expression after the treatment of astrocytes with GENT (). We also confirmed the non-involvement of CAMKK2 by analysis of free calcium in astrocytes after treatment with GENT. However, no increase in the levels of free intracellular calcium was observed (Supplementary Figure S3A & S3B). To check the possibility of GENT inhibiting glucose transport across the cell membrane by binding to human GLUT1, we performed molecular docking. In order to test the docking protocol, re-docking of the bound inhibitor cytochalasin B was performed. Cytochalasin B has been reported to potentially inhibit the transport of deoxyglucose and glucose across the cell membrane. Our results showed that the docked pose for the inhibitor reconciled well with the crystallographic pose of the ligand. The binding energy for the docked cytochalasin B was -10.47 Kcal/mol (). Using the same docking protocol, GENT was docked to GLUT1, and it got docked to the inhibitor-binding pocket with a score of -8.45 Kcal/mol (). The comparable docking score of the known inhibitor and GENT indicated that GENT could potentially bind to GLUT1 and inhibit its activity. We further checked the intracellular levels of ATP and AMP by using LCMS to know if the altered ratio of AMP: ATP is responsible for PRKAA1 activation. We found that GENT treatment significantly reduced the intracellular levels of ATP after 6 h of treatment, and the reduction was further increased by about 70-80% after 12 and 24 h treatment (). Similarly, levels of AMP were highly raised during the corresponding time periods (). Further calculation of the AMP: ATP ratio clearly showed the GENT treatment led to a highly favored AMP: ATP ratio (). We further sought the cause of declined levels of ATP and measured the levels of intracellular glucose. The intracellular levels of glucose showed a declining trend in a time-dependent manner and were observed to be reduced significantly after 3 h of treatment, which was reduced by >50% after 12 h of treatment of astrocytes with GENT (). We found that pyruvate, which is a downstream metabolite of glucose catabolism was also present in reduced quantities in the cells after treatment with GENT (). These data also established the link between reduced intracellular levels of glucose and ATP caused by GENT treatment.
Figure 5. GENT inhibits GLUT 1 to reduce glucose transport and energy levels of astrocytes. (A) Western blots representing the effect of GENT on the expression levels of pSTK11 and pCAMKK2. (B) Superimposition of the crystallographic (cyan) and docking (magenta) poses of Cytochalasin B to human GLUT1 (white ribbon). (C) Superimposition of the crystallographic pose of Cytochalasin B (cyan) and the docked pose of GENT (yellow). LC-MS was used to assess the different parameters governing the energy status of the cell. (D) LCMS-based measurement of intracellular levels of various energy-related parameters in astrocytes including ATP (E) Intracellular AMP (F) Ratio of AMP: ATP (G) Intracellular glucose (H) Pyruvate following treatment with GENT (5 µM) in a time-dependent manner. Statistical significance for analysis of metabolites was calculated by using two-way ANOVA and post-hoc Dunnett’s test was applied. The p-value < 0.05 was appraised to be significant.
GENT facilitated the clearance of soluble amyloid-β in primary astrocytes
After confirming the molecular pathways involved in autophagy induced by GENT, we wanted to know if GENT can alter the phenotype of astrocytes to clear amyloid-β. Therefore, we pretreated the astrocytes with GENT for 12 h, which was followed by a 12 h treatment of hilyte fluor 555 tagged Aβ42. GENT-treated cells displayed a highly significant decrease (40%) in the Aβ fluorescence as compared to the untreated control cells ( and Supplementary Figure S4A). On the contrary, the last stage autophagy inhibitor bafilomycin A1 treatment for 3 h prior to termination of the experiment led to an accumulation of Aβ in GENT-treated cells ( and Supplementary Figure S4A) thus, confirming the involvement of GENT-induced autophagy in the clearance of Aβ by astrocytes. Rapamycin, which was used in this experiment as a standard also showed similar effects as that of GENT. Further, we also checked the level of Aβ in the supernatants of cells in an experiment similar to to know the effect of GENT on the uptake of Aβ by astrocytes. The ELISA measurements of Aβ clearly showed that GENT treatment significantly enhanced the phagocytotic ability of astrocytes, whereas treatment of bafilomycin A1 significantly reduced the uptake of Aβ (). The standard drug rapamycin was more potent to increase the uptake capacity of astrocytes ().
Figure 6. GENT leads to amyloid-β clearance in primary astrocytes. (A) Confocal images of primary astrocytes that were treated with fluorescently tagged Aβ Hilyte Fluor 555 displayed relatively lower fluorescence intensity (red color) in the cells treated with GENT (5 µM) in comparison to the cells treated with Aβ alone. Rapamycin (200 nM) treatment, which was used as a positive control, the red intensity was decreased indicating the clearance of Aβ protein. Bafilomycin A1 significantly enhanced red fluorescence indicating decreased Aβ was clearance. Quantification of relative fluorescence intensity (RFI) was done using FV-10-ASW (Version 1.7) software while scale bar was inserted using ImageJ software. For calculating RFI at least five cells from each sample were taken and then the overall average was calculated from at least three independent experiments, the data are presented here in the form of a bar graph. RFI of Aβ treated sample was normalized to 1 AU. (B) ELISA of the similarly treated samples as in Figure A was done to measure extracellular Aβ present in the supernatant of cultured primary astrocytes. (C) Confocal microscope analysis of primary astrocytes transfected with siPrkaa1 and treated with tagged Aβ Hilyte Fluor 555 with or without GENT. Knockdown of Prkaa1 led to the reversal of effect of GENT on Aβ clearance when compared to the non-transfected cells. These images were obtained using Olympus Fluoview, FV-1000 confocal laser scanning microscope at 60x and ImageJ software was used to insert the scale bar in the images. At least five cells in the sample were taken to evaluate the relative fluorescence intensity as average RFI while final average RFI was calculated after performing three independent experiments. Data presented here are mean ±SD of three independent experiments and statistical significance was calculated by using one way ANOVA and Bonferroni test was used to compare multiple samples. The p-values are represented as *p< 0.05, **p<0.01, ***p<0.001, ns = not significant.
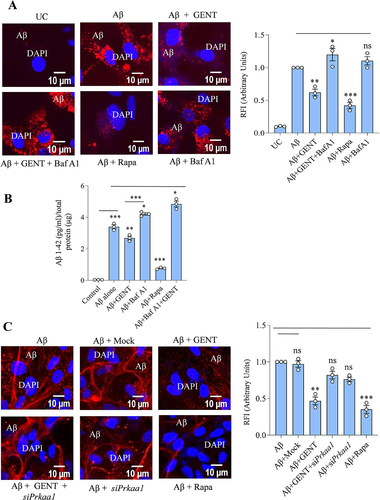
We further confirmed the involvement of GENT-induced autophagy in the clearance of Aβ by downregulating the Prkaa1 expression through siRNA. The astrocytes treated with GENT significantly reduced the Aβ42 fluorescence similar to data obtained in . However, the downregulation of Prkaa1 almost completely reversed the results and the Aβ fluorescence was restored to the comparable levels of cells treated with mock siRNA ( and Supplementary Figure S4B). These data clearly proved the involvement of GENT induced PRKAA1 mediated autophagy in the clearance of Aβ.
GENT reduced the levels of pro-inflammatory cytokines
Astrocytes play an essential role in both innate and adaptive immunity in the brain. Therefore, we decided to analyze if the GENT can affect the phenotype of astrocytes under inflammatory conditions. In this direction, we challenged the astrocytes with Aβ for 12 h followed by treatment with GENT, and checked the levels of proinflammatory cytokines TNF-α and IL-6. Aβ caused a significant release of both TNF-α and IL-6, while the cells treated with GENT displayed markedly reduced release of these cytokines (). Dexamethasone (Dexa) used in this experiment as a standard drug also showed similar results as that of GENT (). These inflammatory cytokines are mainly regulated by nuclear factor-κB (NF-κB), though STAT-3 also plays a role in the regulation of IL-6. Therefore, we focused our attention mainly on the involvement of NF-κB in the anti-inflammatory effect of GENT. The astrocytes treated under similar conditions as in () showed significantly upregulated phosphorylation of NF-κB, p65 at Ser 536 in the presence of Aβ, which was strongly abrogated upon treatment with GENT or Dexa ( and Supplementary Figure S5A) when analyzed in whole cell lysates. GENT had a similar effect on p-IKK (Ser 177), the positive regulator of NF-κB ( & Supplementary Figure S5A). We further wanted to know if GENT can affect the movement of NF-κB from cytoplasm to nucleus.
Figure 7. GENT reduced the release of Aβ prompted pro-inflammatory cytokines TNF-α and IL-6 by inhibiting nuclear translocation of NF-κB in primary astrocytes. (A) ELISA for analyzing the release of TNF-α and (B) IL-6 in primary astrocytes. Primary astrocytes were initially given treatment with Aβ for 12 h followed by treatment with GENT (5 µM), which was followed by measurement of TNF-α and IL-6 in supernatant through ELISA. (C) Western blot analysis for the effect of GENT on p-NF-ĸB, p65 (Ser 536), NF-ĸB, p65, p-IKKβ (Ser 177), and IKKβ in the whole cell lysates. (D) GENT inhibited the Aβ induced nuclear translocation of p-NF-ĸB, p65, and p-NF-ĸB, p50 as analyzed by Western blotting of cytosolic and nuclear fractions. ACTB was used as a marker for cytosolic fraction while LMNA was used as a nuclear fraction marker. The blots presented here are representative of one of three independent experiments. (E) Immunofluorescence examination for effect of GENT on translocation of p-NF-ĸB, p65 (Ser 536) to the nucleus. GENT treatment significantly intensified the red fluorescence in the cytoplasm of astrocytes when compared to the cytoplasm of cells treated with Aβ alone. Dexamethasone in this experiment was used as a standard. In this figure, ImageJ was used to insert the scale bar, and statistical comparisons were made using one-way ANOVA followed by the Bonferroni test where a p-value of < 0.05 was considered significant with ***p<0.001, **p<0.01.*p< 0.05 as significance order.
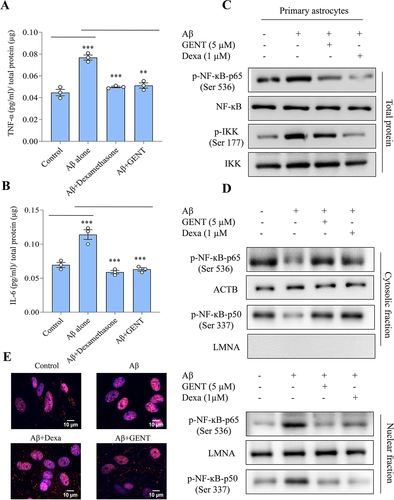
Therefore, we checked the expression of p-NF-κB, p50 (Ser 337) and p-NF-κB, p65 (Ser 536) in both these fractions and found that there was a significant reduction in the translocation of both the subunits p-NF-κB, p50 (Ser 337) and p-NF-κB, p65 (Ser 536) from the cytoplasm to the nucleus in the cells treated with GENT when compared to the cells treated with Aβ ( and Supplementary Figure S5B). We also confirmed the effect of GENT on the nuclear translocation of p-NF-κB, p65 (Ser 536) through confocal microscopy, and the data showed similar results ( & Supplementary Figure S5C)
Knockdown of Prkaa1 abrogated the anti-inflammatory effect of GENT on amyloid-β induced inflammation in primary astrocytes
Our previous data indicated that GENT induced autophagy by activating PRKAA1 and displayed an anti-inflammatory effect by inhibiting the translocation of NF-κB to the nucleus. Therefore, to explore the possible role of PRKAA1 on the anti-inflammatory activity of GENT, we decided to knock down Prkaa1 expression through siRNA in astrocytes. The results clearly showed that reduced expression of Prkaa1 () had a direct impact on the release of TNF-α and IL-6 in the presence of GENT. The cells transfected with mock siRNA and treated with Aβ and GENT displayed significantly reduced release of TNF-α in comparison to cells treated with Aβ (). However, when cells were transfected with siPrkaa1, the release of TNF-α increased by about 42% in the samples treated with GENT and Aβ, which was comparable to the cells transfected with mock siRNA and treated with Aβ and GENT (). Similar kind of results was obtained when the effect of siPrkaa1 was checked on the release of IL-6 under similar experimental conditions ().
Figure 8. PRKAA1 knockdown reversed the anti-inflammatory effect of GENT in Aβ activated astrocytes (A) Primary astrocytes were transfected with siPrkaa1 and the expression of p-PRKAA1 (Thr 172) was analyzed through western blotting, which showed significantly reduced levels as compared to cells transfected with mock siRNA. (B, C) ELISA of TNF-α and IL-6 from the supernatants of primary astrocytes treated with GENT (5 µM) in the presence and absence of siPrkaa1. The knockdown of PRKAA1 significantly reduced the inhibitory effect of GENT on the release of TNF-α and IL-6. (D) Western blot analysis in whole cell lysate for the effect of GENT on the expression of different proteins p-PRKAA1 (Thr 172) and p-NF-ĸB, p65 (Ser 536) in the presence and absence of siPrkaa1. Knockdown of PRKAA1 strongly compromised the inhibitory effect of GENT on p-NF-ĸB, p65 (Ser 536) expression. (E) Western blotting of p-NF-κB, p65 (Ser 536) in the cytosolic and the nuclear fraction of the primary astrocytes treated with GENT and siPrkaa1. As a cytosolic marker, ACTB was used and for the nuclear marker, LMNA was used. The blots depicted the enhanced shifting of p-NF-κB, p65 (Ser 536) from the cytoplasm to the nucleus in the astrocytes treated with GENT in the presence of siPrkaa1.Western blots presented here are representative of one of three experiments. For calculating statistical significance, one-way ANOVA was used and post-hoc Bonferroni test was applied. The p-values *p < 0.05, **p <0.01, ***p<0.001 are considered to be significant.
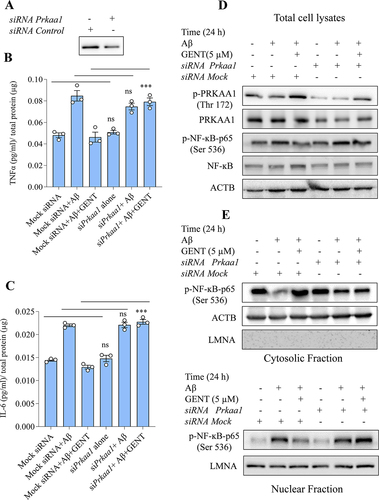
We further explored the effect of siRNA-mediated suppression of Prkaa1 on GENT-mediated inhibition of NF-κB, which is an upstream regulator of TNF-α and IL-6. We found that the inhibitory effect of GENT on NF-κB was significantly reversed in the astrocytes transfected with siPrkaa1, which was evident by the reduced phosphorylation of NF-κB, p65 at Ser 536 ( and Supplementary Figure S6A). Additionally, the inhibition of shifting of p-NF-κB, p65 (Ser 536) from the cytoplasm to the nucleus caused by GENT was also reversed to a significant extent ( and Supplementary Figure S6B). These data confirmed the involvement of PRKAA1 in the anti-inflammatory activity of GENT.
Discussion
Despite the indispensable role that the astrocytes play in maintaining brain homeostasis and their involvement in the development of several brain pathologies, the astrocytes have not been given enough importance as a target for drug discovery Citation19,Citation22. Several research groups, including ours, have shown that autophagy can be induced in neurons to clear amyloid-β and to stop neurodegeneration in Alzheimer’s disease (AD)Citation23,Citation24. However, in this study, we decided to choose astrocytes as a model system for the induction of autophagy for clearance of amyloid-β. Selecting astrocytes as a target for pharmacological induction of autophagy is significant as they are involved in multiple aspects of brain physiology and pathology. Our initial data indicated that GENT apart from being a relatively less explored natural compound is also a good inducer of autophagy in astrocytes. Therefore, we decided to proceed with GENT to explore the possibilities of clearing amyloid-β and related pathology by using primary astrocytes. We found that GENT induced autophagic flux by activating the PRKAA1 pathway. This is one of the most important pathways that regulate autophagy by sensing the energy state of the cell Citation25,Citation26. Before proceeding with detailed studies with GENT, we wanted to be sure about it has any cytotoxicity. Therefore, we confirmed that GENT did not produce any significant toxicity in primary astrocytes and primary hepatocytes even at a concentration five-time higher (25 µM) than the concentration used in this study (5 µM). Apart from that GENT also displayed a significantly better safety profile in astrocytes at the working concentration. Thus, making it a good drug candidate to move forward.
PRKAA1 pathway plays a crucial role in intracellular homeostasis maintenance by regulating the process of autophagyCitation26,Citation27. Our data indicated that GENT induces autophagy through the PRKAA1 pathway, though, it did not have any effect on MTOR. These data were further confirmed when no change in the expression of phosphorylated AKT and 4E-BP1 was observed after treatment with GENT. Inhibition of MTOR is one of the primary causes of induction of autophagy, however, several studies have shown that autophagy can be induced in the cells without affecting MTOR, and AMPK can directly activate ULK1Citation28-30. GENT also appeared to follow the same mechanism, which ultimately led to the activation of downstream proteins like BECN, ATG5, and ATG7 and the execution of autophagy. We confirmed the involvement of PRKAA1 in GENT-induced autophagy by downregulating it through siPrkaa1.We found that the activation of ULK1 was significantly reduced in the absence of PRKAA1, which was reflected in reduced levels of LC3B-II and hence autophagy. After confirming the downstream mechanism of autophagy, we wanted to know the mechanism through which GENT activated PRKAA1. As p-STK11 and p-CAMKK2 are two main kinases responsible for the phosphorylation and activation of PRKAA1Citation31,Citation32, we checked if these kinases are activated by GENT to induce autophagy through PRKAA1. The results clearly showed that GENT does not affect these kinases. These findings were also supported by no increase in intracellular free calcium. We further focused our study on the energy status of the cells, which can be directly sensed by PRKAA1 to induce autophagy Citation33,Citation34. We, therefore, checked the levels of two important energy metabolites that is adenosine monophosphate (AMP) and adenosine triphosphate (ATP). The ratio of AMP: ATP showed a highly significant increase, thus implicating the low energy levels of cells as a cause for PRKAA1 activation. The level of cellular energy can determine the health state of the cell and the organism. Several studies have linked low-calorie intake to healthy aging and longevityCitation35,Citation36. ATP is required by the cell to perform all the necessary tasks including movement of cargo, replication, transcription and translation, biochemical reactions, etcCitation37. Age-related decline in the levels of glucose and ATP in the brain can also contribute to the deposition of amyloid beta and phosphorylation of tauCitation38. Therefore, extremely low cellular energy can have a detrimental effect on the health of the cell by affecting these processes. GENT, however, did not appear to adversely affect the health state of the cells as evidenced by no effect on the viability of primary astrocytes even after 72 h of treatment at two times higher concentration than was used in this study.
Further, we wanted to decipher the cause of the low energy state of the cells. Therefore, we asked if GENT can inhibit glucose transport and thus lower its availability to the cells. To check this hypothesis, we performed molecular docking studies of GENT against the glucose transporter GLUT1, which is abundantly expressed in astrocytes Citation39,Citation40. The docking studies indicated that GENT could effectively bind GLUT1 and inhibit glucose transport across the cell membrane. This hypothesis was further proved to be true when we checked the intracellular levels of glucose and its downstream metabolite pyruvic acid, both these metabolites showed a marked decline as the treatment time of astrocytes with GENT was increased. These data clearly demonstrated that GENT inhibits glucose transport to induce autophagy through the PRKAA1 pathway.
Reduced autophagic clearance of amyloid-β and α-synuclein is one of the main reasons for their accumulation in the brains of patients of Alzheimer’s disease and Parkinson’s disease respectivelyCitation41–43. Some of the earlier research has shown that when autophagy is induced pharmacologically in neurons, it can help in the reduction of Aβ and α-synuclein load in vitro and in the brainCitation44–46. Despite their abundance in the brain, astrocytes have not been explored enough to see their role in the clearance of accumulated proteins like Aβ and α-synuclein in the brain and their role in the pathology of AD and PD Citation22,Citation47. Therefore, we wanted to know if the induction of autophagy in astrocytes can also work the same way to reduce the Aβ levels. We treated the astrocytes with GENT to induce autophagy and observed its effect on the clearance of fluorescently tagged Aβ. We found that GENT effectively caused the clearance of Aβ, which was phagocytosed by the astrocytes. Moreover, when we knocked down Prkaa1, the effect of GENT was almost completely reversed, which further provided evidence for the association of PRKAA1 in GENT-induced autophagy and its effect on Aβ clearance in astrocytes.
Astrocytes perform multiple functions in the brain including regulation of inflammation Citation48,Citation49. Accumulation of proteins like Aβ and α-synuclein have been associated with neuroinflammation related to neurodegenerative diseases Citation7. These proteins are also reported to change the phenotype of astrocytes to their reactive forms Citation50,Citation51. Therefore, we hypothesized that if GENT could clear Aβ, it is also possible to reverse the reactive phenotype of astrocytes caused by Aβ to their normal state. To test this hypothesis, we activated the astrocytes by Aβ in the presence and absence of GENT and measured the levels of proinflammatory cytokines TNF-α and IL-6. We found a comprehensible decline in Aβ induced levels of TNF-α and IL-6 in the presence of GENT. We further observed that the NF-κB, which is the main transcription factor regulating these cytokines was also localized in the cytoplasm of cells treated with GENT. These data indicated that GENT could target two important hallmarks of AD that is accumulation of Aβ and neuroinflammation. However, we wanted to see if these multiple effects of GENT are associated with each other or not. There are multiple studies, which associate PRKAA1 and NF-κB pathways Citation52,Citation53. Therefore, to find an answer to this question, we knocked down PRKAA1 to know its effect on the anti-inflammatory activity of GENT. The reduced levels of PRKAA1 led to an almost complete reversal of the anti-inflammatory effect of GENT, which was indicated by the enhanced release of TNF-α and IL-6 and restoration of NF-κB movement to the nucleus.
In conclusion, we proved in this study that GENT exerts its pharmacological effects by inducing autophagy through the PRKAA1 pathway, which is activated by the inhibition of glucose transport in astrocytes. This study further emphasizes that astrocytes can be a good pharmacological target in AD and other neurodegenerative diseases, which are accompanied by the accumulation of proteins and involve neuroinflammation. Gentiacaulein should further be explored in-vivo for its possible anti-Alzheimer activity and further development.
Materials and methods
Reagents and antibodies:
DMEM, streptomycin, penicillin G sodium salt, rapamycin, bafilomycin A1, PBS, DAPI, DMSO, papain,ammonium persulfate, RIPA buffer, sodium orthovanadate, N, N′-Methylene bis acrylamide, TEMED, sodium bicarbonate, sodium fluoride, glycine, sodium pyruvate, EDTA; triton X-100, tween 20, trizma, sodium dodecyl sulphate, glycerol, HEPES, paraformaldehyde, protease inhibitor cocktail, Aβ (1-42) peptide and MTT were purchased from Sigma Aldrich. siRNA to Prkaa1/Ampk was bought from Cell Signaling Technology and scramble siRNA was purchased from Santa Cruz Biotechnology. Sodium chloride, skimmed milk, Acetic acid glacial, Tris, Free base, TCA were purchased from HiMedia. BSA, acrylamide and PMSF were purchased from MP Biomedical. OPTI-MEM media, and trypsin, and fetal bovine serum were purchased from Gibco and lipofectamine 3000 from Thermo Fisher Scientific. Aβ42-HiLyte Fluor555 was purchased from Anaspec and ELISA kit for human Aβ42 from Invitrogen Bioservices. ELISA kits for IL-6 and TNF-α, were purchased from Invitrogen (eBioscience). ECL-kit and PVDF Membrane were purchased from Merck Millipore and Fugene-6 from Promega. Protein assay dye, protein molecular weight markers, Bradford reagent were bought from Bio-Rad Laboratories.
Antibodies for ACTB/β-Actin, Phospho-PRKAA1/AMPK α (Thr 172), PRKAA1/AMPKα, GFAP, Phospho-STK11/LKB1 (Ser 428), STK11/LKB, SQSTM1, LC3-II were purchased from Sigma Aldrich. Anti-RBFOX3/NEUN, anti-mouse IgG Alexa flour 488, anti-rabbit IgG Alexa flour 555, Anti-rabbit IgG, HRP; Anti-mouse IgG, HRP; pCaMKK2 (Ser 511), ATG5, ATG 7, Phospho-ULK1 (Ser 317), LC3-II, Phospho-MTOR (Ser 2448), MTOR, PRKAA1/AMPK α, Phospho-PRKAA1/AMPK α (Thr 172), Phospho-ULK1(Ser 555), ULK1, Phospho-IKKβ, IKKβ, Phospho-4E-BP1 (Thr 37/46), AKT, Phospho-AKT (Ser 473), were bought from Cell Signaling Technology. LAMP1, ULK1, ATG7, BECN1, IBA1, LMNA, Phospho-NF-Kβ, p50, Phospho-NFKβ, p65, NF-Kβ, p65, and mouse scrambled siRNA were purchased from Santacruz Biotechnology. Cathepsin D antibody was purchased from Abcam. Catalog numbers of all the antibodies and reagents used in this study are provided in Supplementary Table S1 and S2.
Primary cell culture
Primary cell culture was done for hepatocytes and astrocytes in consent with Institutional Animals Ethics Committee (IAEC), IIIM, Jammu, India.
Primary astrocytes culture
Primary astrocytes were obtained from 4-5 days old pups of C57BL/6 mice. The pups were sacrificed through decapitation and sterilized with 70% ethanol. The brain was exposed and the olfactory lobes and cerebellum were removed. Meninges were also exposed. The cortical hemisphere portion was chosen for isolating the astrocytes by cutting them into smaller pieces using a blade. The cells were digested in HBSS containing 0.25% Trypsin. After repeated shaking and centrifugation, the cells were cultured in DMEM-high glucose media, and the media was replaced after every two days. After 6-7 days, the microglial layer was separated from the underlying astrocytic layer by shaking. Oligodendrocytes were removed after vigorous shaking (240 rpm) for 6 h. The astrocytes were trypsinized and cultured again for further experiments. The primary astrocyte culture was maintained at 370C in an incubator with 5% CO2 and 95% humid air. DMSO was used to dissolve GENT, rapamycin, and bafilomycin A1 while dexamethasone was dissolved in methanol. In the respective experiments, similar concentrations of DMSO and methanol were added to the control cells as added to the treated samples.
Primary hepatocytes culture
Hepatocytes were extracted from adult C57BL/6 mice. Briefly, the animals were anesthetized and the abdominal surface was cleaned to expose the hepatic portal vein. The liver was perfused with the perfusion buffers of different concentrations [Buffer 1: Mg2+ (MgCl2) to 0.9 mM, EDTA to 0.5 mM, and HEPES to 25 mM were added to Hank’s Balanced Salt Solution (HBSS); and for buffer-2, 25 mM of HEPES was added to HBSS containing Ca2+ and Mg 2+], till it became pale-colored and mushy. The liver was then extracted out into collagenase-containing perfusion buffer and then dispersed in MEM medium with the help of a scrapper. After repeated centrifugation and perfusions, the cells were cultured in an incubator with 95% of the humid atmosphere and 5% CO2 at 37 0C. The growth media was replaced after every two days.
Transfection with GFP-LC3B-II plasmid
Primary astrocytes at a density of 5×10⁵ cells per dish were seeded over a cover slip in a 6-well plate. Transfection was done using Fugene 6 at a concentration of 5 µl and 1μg plasmid in OPTI-MEM media. This transfecting mix was prepared and kept for 20 minutes inside the laminar before adding it to the cultured cells. After 24 h of adding the transfection mixture, the cells were given GENT (5 μM) treatment for 12 h. In this experiment, rapamycin (200 nM) was used as a standard. For the preparation of slides, the cells were given PBS wash twice and then fixation was done using 4% paraformaldehyde for 10 minutes and analyzed for GFP-LC3 puncta formation under a confocal microscope at 40x.
ELISA (Enzyme-linked Immunosorbent assay)
To analyze the Aβ clearance, primary astrocytes were treated with amyloid-β, rapamycin, and bafilomycin A1 in the respective manner as indicated and the levels of extracellular Aβ (from supernatant) were evaluated using sandwich ELISA. The experiment was performed in accordance with the manufacturer`s protocol. A Standard curve using recombinant Aβ was generated and used for the quantification of Aβ.
To measure the levels of pro-inflammatory cytokines, primary astrocytes were treated with GENT and Aβ was added to it after 12h. Dexamethasone was used as a positive standard in this experiment. In the end, the supernatant was collected to measure the levels of TNF-α and IL-6 cytokines in accordance with the manufacturer’s protocol.
Western Blotting
Primary astrocytes were given different treatments and then the cells were lysed using 1X RIPA lysis buffer supplemented with 0.5 mM Na3OV4, 2 mM PMSF,50 mM NaF, and protease inhibitor cocktail. Quantification of the proteins was done using the Bradford assay. The proteins were then loaded onto the gel and separated using SDS gel electrophoresis at 75 volts and then transferred to a PVDF membrane at 100 volts keeping it over the ice for 2 h. The blots were then blocked for 1 h at room temperature using 5% skimmed milk and then different primary antibodies were added after proper dilutions for overnight incubation at 40C. The following day, the blots were treated with HRP-conjugated secondary antibody for 1 h at room temperature. Before getting the exposure over X-ray or Chemidoc system, blots were incubated with western chemiluminescent HRP substrate from Millipore.
Calculating the autophagy flux
In all the experiments wherein autophagy has been depicted, the autophagic flux was calculated according to the Guidelines for the use and interpretation of assays for monitoring autophagyCitation54.
Transmission electron microscopy
For TEM, primary astrocytes were cultured in a T-75 cm2 flask and treated with Rapamycin and GENT for 24 h. After 24 h cells were fixed with a fixative solution containing 2.5% glutaraldehyde, 2% paraformaldehyde, 0.15 M cacodylate buffer pH 7.4 with 2 mM CaCl2, and stained with Evans blue solution. The cells were then post-fixed with 1% osmium tetroxide and gradually dehydrated in acetone and embedded in Araldite. Post fixation, samples were rinsed in 0.15 M cacodylate buffer containing 2 mM calcium chloride 3 times for 10 minutes each followed by a secondary fixation in 1% osmium tetroxide and 1.5% potassium ferrocyanide in 0.15 M cacodylate buffer containing 2 mM calcium chloride for 1 hour in the dark. The samples were then rinsed 3 times for 10 minutes each in ultrapure water and en bloc stained with 2% aqueous uranyl acetate overnight at 4 0C in the dark. After 4 washes for 10 minutes each in ultrapure water, the samples were dehydrated in a graded acetone series (10%, 30%, 50%, 70%, 90%, 100% x3) for 10 minutes each step, infiltrated with Spurr’s resin (Electron Microscopy Sciences) and embedded and polymerized at 60 0C for 72 h. Post-curing, 70 nm thin sections were cut and imaged on a TEM (Jeol JEM-1400 Plus) at 120 kV.
Preparation of HiLyte Fluor 555TM β-Amyloid42 peptide
For treating the cells with fluorescently tagged Aβ, HiLyte Fluor 555TMAβ42 peptide was prepared using the protocol established by the manufacturer (Anaspec Inc.). In brief, a 2 mg/ml stock of peptide was prepared by dissolving it in 1% NH3OH. This solution was further diluted in PBS to prepare a stock of 1mg/ml and then stored at -200C. This solution was prepared inside the laminar and the Aβ peptide generated was taken as soluble form.
Confocal microscopy to assess the clearance of Aβ in primary astrocytes:
Primary astrocytes were grown over a coverslip in a 6-well plate for 24 h. The cells were given treatment with GENT (5 μM) for 12 h after which Fluorochrome tagged Aβ42 HiLyte Fluortm555 (2μg/ml) was added for 12 h in the presence or absence of bafilomycin A1 (20 nM) which was used as negative standard. In this experiment, rapamycin (250 nm) was used as the standard for estimating the Aβ clearance. After the end of experiments, cells were washed three times with PBS and 4% paraformaldehyde was used to fix the cells. Cells were again given a PBS wash before adding DAPI. The slides were prepared by placing coverslips over mounting media (PBS and Glycerol) at 1:9 ratio. Images were taken at 60x under Olympus Fluoview, FV-1000 confocal laser scanning microscope.
Immunofluorescence staining for LAMP 1 in primary astrocytes
In order to assess the levels of LAMP1 in primary astrocytes, cells were grown over coverslips and then treated with GENT (5 μM) for 24 h in the presence and absence of bafilomycin A1 After the treatments, cells were given PBS wash three times and then fixed with 4% paraformaldehyde for 10-15 min at room temperature. Cells were again washed with PBS and then blocking was done using a blocking buffer consisting of 5% normal goat serum (Cell Signaling Technology) and 0.3% Triton X-100 mixed in PBS for 1 h. The primary antibody for LAMP1 was added to the slide overnight at 40C and then incubated with tagged secondary antibody for 1 h at room temperature. In the end, cells were finally washed thrice with PBS for an interval of 5 min. and the images were taken at 60x under a confocal microscope.
Immunofluorescence for LAMP 1 and LC3 co-localization in primary astrocytes
In order to assess the co-localization of LAMP 1 and LC3, primary astrocytes were grown in DMEM media over coverslips. The cells were then treated with GENT (5 μM) in the presence and absence of bafilomycin A1 and at the end of the experiment, cells were washed with PBS thrice and fixed with 4% paraformaldehyde at room temperature for 15-20 min. Paraformaldehyde was discarded and cells were washed with PBS again. The blocking was done using 5% fetal bovine serum and 0.2% Triton X-100 mixed in PBS for 1 h. The primary antibody for LAMP1 and LC3 was added to the cells on coverslips, placed on a slide overnight, and kept at 40C. The following day, the cells were incubated with tagged secondary antibodies for 2 h at room temperature. At the end of the experiment, cells were finally washed with PBS and the images were taken under a confocal microscope at 60x on Yokogawa CQ1 Confocal Quantitative Image Cytometer. The quantification of images was done by CellPathfinder software.
Lysotracker DND red staining in primary astrocytes
The analysis for acidification of lysosomes was done by using LysoTracker DND Red dye in primary astrocytes and imaged through confocal microscopy. The cells were grown in a 6-well plate over the coverslips and treated with GENT (5 μM) and bafilomycin A1 as required. At the end of the experiment, the cells were washed with PBS and fixed using 4% paraformaldehyde for 10-12 minutes. LysoTracker DND Red (80 nM) was added for 90 min. The cells were washed in the incomplete medium two times and cell images were taken under a confocal microscope at 60x on Yokogawa CQ1 Confocal Quantitative Image Cytometer.
Transfection of primary astrocytes with Prkaa1 siRNA
For transfecting the primary astrocytes with siRNA for Prkaa1, cells were seeded at a density of 0.5×10⁶ in 6-well plates. Transfecting media (OPTI-MEM) was added to the cells after removing the old media and transfection with siPrkaa1 was done using Fugene 6 at a concentration of 5 μl per well in the plate. After 24 h of transfection, Hilyte Fluor 555TM β-Amyloid1-42 was added at a concentration of 2 μg/ml and 5 μM of GENT was also added at the same time. After transfection, cells were prepared to be analyzed by confocal microscopy following the same procedure for slide preparations as described previously.
For Western analysis, after 24h of transfection cells were given different treatments, and then the lysates were prepared to be evaluated by SDS gel electrophoresis.
Intracellular Calcium measurement
Primary Astrocytes from one to five days old mice (C57BL/6J) pups were isolated and cultured in DMEM low glucose media supplemented with 10% FBS. After one passage cells were seeded in 96 well optical bottom plates. After 24 h, a time-dependent (24, 12, 6, and 3 h) treatment was given with GENT at a concentration of 5 μM. Calcium ion (Ca2+) Influx was analyzed using Fluo-3 AM dye at a concentration of 4 μM. Cells were incubated with Fluo-3 AM for 30 minutes before the images were captured. Four fields from each well were randomly selected and images were captured with Yokogawa CQ1 Confocal Quantitative Image Cytometer. The fluorescence intensity of the images was analyzed using CellPathfinder Software. 80-100 cells from each treatment group were randomly selected for statistical analysis. The data were analyzed using GraphPad Prism 8.0.2 software. The results shown here are Mean ± SD. The p-value was calculated by applying one-way ANOVA analysis with Bonferroni’s multiple comparisons tests. The p values <0.05 were considered significant.
Quantification of Western blots and Fluorescence images
All the western blots used in this study were quantified by using ImageJ software. The quantification of at least three blots from independent experiments was done and the data are presented in the form of bar graphs. The fluorescence confocal images were acquired on Yokogawa CQ1 Confocal Quantitative Image Cytometer and were quantified by using CellPathfinder high content analysis software, and the images acquired on Olympus Fluoview, FV-1000 confocal laser scanning microscope were quantified by using FV-10-ASW (Version 1.7) software.
Statistical analysis
Data represented here are shown as mean ± SD of three independent experiments. The analysis was done by using Instat-3 software. Statistical comparisons were made by using one-way or two-way ANOVA followed by the Bonferroni test or Dunnett’s test as a post-hoc method. Statistical significance is presented as a measure of p values taken as highly significant denoted as ****p≤0.0001, ***p≤0.001, **p≤0.01 and *p≤0.05.
Abbreviations
Author’s contribution
AS, SK, AW, DK, MA, and LS performed most of the experiments. SMA and PRS helped in the confocal microscopy-based experiments. AG and UN helped in LCMS based experiments. MD facilitated the molecular docking studies. CW helped in electron microcopy and confocal microscopy assays. AS, GS and AK planned the study and wrote the manuscript.
Supplementary_Material.docx
Download MS Word (13.4 MB)Acknowledgments
We are thankful to Late Dr. P. L. Sangwan from Natural Products and Medicinal Chemistry Division of CSIR-Indian Institute of Integrative Medicine for kindly providing us gentiacaulein. This study was funded by CSIR-Indian Institute of Integrative Medicine through the project MLP-6002. We are thankful to Department of Science and Technology (DST), India for the inspire fellowship support to Ms. Ankita Sharma. We are also grateful to Council of Scientific and Industrial Research (CSIR), India for providing research fellowship to Ms. Dilpreet Kour and Mehboob Ali. We acknowledge the assistance of John Wulf II, Gregory Strout, and Dr. Sanja Sviben at the Washington University Center for Cellular Imaging (WUCCI) in electron microscopy studies, which is supported by Washington University School of Medicine, The Children’s Discovery Institute of Washington University and St. Louis Children’s Hospital (CDI-CORE-2015-505 and CDI-CORE-2019-813) and the Foundation for Barnes-Jewish Hospital (3770 and 4642). TEM images were acquired using an AMT Nanosprint15-MkII sCMOS camera, which was purchased with support from the Office of Research Infrastructure Programs (ORIP), a part of the NIH Office of the Director under the grant (OD032186). This Manuscript has got an institutional publication number CSIR-IIIM/IPR/00412 from CSIR-IIIM publication committee.
Conflict of interest statement
Authors declare no conflict of interest.
Data availability statement
The data that support the findings of this study are available from the corresponding author upon reasonable request.
Supplementary Material
Supplemental data for this article can be accessed online at https://doi.org/10.1080/27694127.2023.2296209
Additional information
Funding
References
- Von Bartheld CS, Bahney J, Herculano-Houzel S. The search for true numbers of neurons and glial cells in the human brain: A review of 150 years of cell counting. The Journal of comparative neurology 2016; 524:3865–31.
- Herculano-Houzel S. The glia/neuron ratio: how it varies uniformly across brain structures and species and what that means for brain physiology and evolution. Glia 2014; 62:1377–91.
- Verkhratsky A, Nedergaard M. Physiology of Astroglia. Physiological reviews 2018; 98:239–389.
- Khakh BS, Sofroniew MV. Diversity of astrocyte functions and phenotypes in neural circuits. Nature neuroscience 2015; 18:942–52.
- Marina N, Christie IN, Korsak A, Doronin M, Brazhe A, Hosford PS, et al. Astrocytes monitor cerebral perfusion and control systemic circulation to maintain brain blood flow. Nature communications 2020; 11:131.
- Peteri UK, Niukkanen M, Castren ML. Astrocytes in Neuropathologies Affecting the Frontal Cortex. Frontiers in cellular neuroscience 2019; 13:44.
- Liu CY, Yang Y, Ju WN, Wang X, Zhang HL. Emerging Roles of Astrocytes in Neuro-Vascular Unit and the Tripartite Synapse With Emphasis on Reactive Gliosis in the Context of Alzheimer’s Disease. Frontiers in cellular neuroscience 2018; 12:193.
- DeTure MA, Dickson DW. The neuropathological diagnosis of Alzheimer’s disease. Molecular neurodegeneration 2019; 14:32.
- Rajmohan R, Reddy PH. Amyloid-Beta and Phosphorylated Tau Accumulations Cause Abnormalities at Synapses of Alzheimer’s disease Neurons. Journal of Alzheimer’s disease: JAD 2017; 57:975–99.
- Koistinaho M, Lin S, Wu X, Esterman M, Koger D, Hanson J, et al. Apolipoprotein E promotes astrocyte colocalization and degradation of deposited amyloid-beta peptides. Nature medicine 2004; 10:719–26.
- Wyss-Coray T, Loike JD, Brionne TC, Lu E, Anankov R, Yan F, et al. Adult mouse astrocytes degrade amyloid-beta in vitro and in situ. Nature medicine 2003; 9:453–7.
- Ries M, Sastre M. Mechanisms of Abeta Clearance and Degradation by Glial Cells. Frontiers in aging neuroscience 2016; 8:160.
- Escartin C, Galea E, Lakatos A, O’Callaghan JP, Petzold GC, Serrano-Pozo A, et al. Reactive astrocyte nomenclature, definitions, and future directions. Nature neuroscience 2021; 24:312–25.
- Hu J, Akama KT, Krafft GA, Chromy BA, Van Eldik LJ. Amyloid-beta peptide activates cultured astrocytes: morphological alterations, cytokine induction and nitric oxide release. Brain research 1998; 785:195–206.
- Pike CJ, Cummings BJ, Monzavi R, Cotman CW. Beta-amyloid-induced changes in cultured astrocytes parallel reactive astrocytosis associated with senile plaques in Alzheimer’s disease. Neuroscience 1994; 63:517–31.
- Montoliu-Gaya L, Mulder SD, Herrebout MAC, Baayen JC, Villegas S, Veerhuis R. Abeta-oligomer uptake and the resulting inflammatory response in adult human astrocytes are precluded by an anti-Abeta single chain variable fragment in combination with an apoE mimetic peptide. Molecular and cellular neurosciences 2018; 89:49–59.
- Pomilio C, Pavia P, Gorojod RM, Vinuesa A, Alaimo A, Galvan V, et al. Glial alterations from early to late stages in a model of Alzheimer’s disease: Evidence of autophagy involvement in Abeta internalization. Hippocampus 2016; 26:194–210.
- Uddin MS, Mamun AA, Labu ZK, Hidalgo-Lanussa O, Barreto GE, Ashraf GM. Autophagic dysfunction in Alzheimer’s disease: Cellular and molecular mechanistic approaches to halt Alzheimer’s pathogenesis. Journal of cellular physiology 2019; 234:8094–112.
- Nixon RA, Wegiel J, Kumar A, Yu WH, Peterhoff C, Cataldo A, et al. Extensive involvement of autophagy in Alzheimer disease: an immuno-electron microscopy study. Journal of neuropathology and experimental neurology 2005; 64:113–22.
- Tomic M, Tovilovic G, Butorovic B, Krstic D, Jankovic T, Aljancic I, et al. Neuropharmacological evaluation of diethylether extract and xanthones of Gentiana kochiana. Pharmacology, biochemistry, and behavior 2005; 81:535–42.
- Chericoni S, Testai L, Calderone V, Flamini G, Nieri P, Morelli I, et al. The xanthones gentiacaulein and gentiakochianin are responsible for the vasodilator action of the roots of Gentiana kochiana. Planta medica 2003; 69:770–2.
- Gorshkov K, Aguisanda F, Thorne N, Zheng W. Astrocytes as targets for drug discovery. Drug discovery today 2018; 23:673–80.
- Wani A, Gupta M, Ahmad M, Shah AM, Ahsan AU, Qazi PH, et al. Alborixin clears amyloid-beta by inducing autophagy through PTEN-mediated inhibition of the AKT pathway. Autophagy 2019; 15:1810–28.
- Wani A, Al Rihani SB, Sharma A, Weadick B, Govindarajan R, Khan SU, et al. Crocetin promotes clearance of amyloid-beta by inducing autophagy via the STK11/LKB1-mediated AMPK pathway. Autophagy 2021:1–20.
- Jang M, Park R, Kim H, Namkoong S, Jo D, Huh YH, et al. AMPK contributes to autophagosome maturation and lysosomal fusion. Scientific reports 2018; 8:12637.
- Herzig S, Shaw RJ. AMPK: guardian of metabolism and mitochondrial homeostasis. Nature reviews Molecular cell biology 2018; 19:121–35.
- Zhao M, Klionsky DJ. AMPK-dependent phosphorylation of ULK1 induces autophagy. Cell metabolism 2011; 13:119–20.
- Perera ND, Sheean RK, Lau CL, Shin YS, Beart PM, Horne MK, et al. Rilmenidine promotes MTOR-independent autophagy in the mutant SOD1 mouse model of amyotrophic lateral sclerosis without slowing disease progression. Autophagy 2018; 14:534–51.
- Rusmini P, Cortese K, Crippa V, Cristofani R, Cicardi ME, Ferrari V, et al. Trehalose induces autophagy via lysosomal-mediated TFEB activation in models of motoneuron degeneration. Autophagy 2019; 15:631–51.
- Manzoni C, Mamais A, Roosen DA, Dihanich S, Soutar MP, Plun-Favreau H, et al. mTOR independent regulation of macroautophagy by Leucine Rich Repeat Kinase 2 via Beclin-1. Scientific reports 2016; 6:35106.
- Shaw RJ, Kosmatka M, Bardeesy N, Hurley RL, Witters LA, DePinho RA, et al. The tumor suppressor LKB1 kinase directly activates AMP-activated kinase and regulates apoptosis in response to energy stress. Proceedings of the National Academy of Sciences of the United States of America 2004; 101:3329–35.
- Hawley SA, Pan DA, Mustard KJ, Ross L, Bain J, Edelman AM, et al. Calmodulin-dependent protein kinase kinase-beta is an alternative upstream kinase for AMP-activated protein kinase. Cell metabolism 2005; 2:9–19.
- Xiao B, Heath R, Saiu P, Leiper FC, Leone P, Jing C, et al. Structural basis for AMP binding to mammalian AMP-activated protein kinase. Nature 2007; 449:496–500.
- Gowans GJ, Hawley SA, Ross FA, Hardie DG. AMP is a true physiological regulator of AMP-activated protein kinase by both allosteric activation and enhancing net phosphorylation. Cell metabolism 2013; 18:556–66.
- Acosta-Rodriguez V, Rijo-Ferreira F, Izumo M, Xu P, Wight-Carter M, Green CB, et al. Circadian alignment of early onset caloric restriction promotes longevity in male C57BL/6J mice. Science 2022; 376:1192–202.
- Longo VD, Anderson RM. Nutrition, longevity and disease: From molecular mechanisms to interventions. Cell 2022; 185:1455–70.
- Seppet E, Gruno M, Peetsalu A, Gizatullina Z, Nguyen HP, Vielhaber S, et al. Mitochondria and energetic depression in cell pathophysiology. International journal of molecular sciences 2009; 10:2252–303.
- Hoyer S. Brain glucose and energy metabolism abnormalities in sporadic Alzheimer disease. Causes and consequences: an update. Experimental gerontology 2000; 35:1363–72.
- Morgello S, Uson RR, Schwartz EJ, Haber RS. The human blood-brain barrier glucose transporter (GLUT1) is a glucose transporter of gray matter astrocytes. Glia 1995; 14:43–54.
- Leino RL, Gerhart DZ, van Bueren AM, McCall AL, Drewes LR. Ultrastructural localization of GLUT 1 and GLUT 3 glucose transporters in rat brain. Journal of neuroscience research 1997; 49:617–26.
- Ahmed I, Liang Y, Schools S, Dawson VL, Dawson TM, Savitt JM. Development and characterization of a new Parkinson’s disease model resulting from impaired autophagy. The Journal of neuroscience: the official journal of the Society for Neuroscience 2012; 32:16503–9.
- Moors TE, Hoozemans JJ, Ingrassia A, Beccari T, Parnetti L, Chartier-Harlin MC, et al. Therapeutic potential of autophagy-enhancing agents in Parkinson’s disease. Molecular neurodegeneration 2017; 12:11.
- Komatsu M, Waguri S, Chiba T, Murata S, Iwata J, Tanida I, et al. Loss of autophagy in the central nervous system causes neurodegeneration in mice. Nature 2006; 441:880–4.
- Ajoolabady A, Aslkhodapasandhokmabad H, Henninger N, Demillard LJ, Nikanfar M, Nourazarian A, et al. Targeting autophagy in neurodegenerative diseases: From molecular mechanisms to clinical therapeutics. Clinical and experimental pharmacology & physiology 2021; 48:943–53.
- Huang M, Jiang X, Liang Y, Liu Q, Chen S, Guo Y. Berberine improves cognitive impairment by promoting autophagic clearance and inhibiting production of beta-amyloid in APP/tau/PS1 mouse model of Alzheimer’s disease. Experimental gerontology 2017; 91:25–33.
- Zhang Y, Wu Q, Zhang L, Wang Q, Yang Z, Liu J, et al. Caffeic acid reduces A53T alpha-synuclein by activating JNK/Bcl-2-mediated autophagy in vitro and improves behaviour and protects dopaminergic neurons in a mouse model of Parkinson’s disease. Pharmacological research 2019; 150:104538.
- Acioglu C, Li L, Elkabes S. Contribution of astrocytes to neuropathology of neurodegenerative diseases. Brain research 2021; 1758:147291.
- Giovannoni F, Quintana FJ. The Role of Astrocytes in CNS Inflammation. Trends in immunology 2020; 41:805–19.
- Suzumura A, Takeuchi H, Zhang G, Kuno R, Mizuno T. Roles of glia-derived cytokines on neuronal degeneration and regeneration. Annals of the New York Academy of Sciences 2006; 1088:219–29.
- Allaman I, Gavillet M, Belanger M, Laroche T, Viertl D, Lashuel HA, et al. Amyloid-beta aggregates cause alterations of astrocytic metabolic phenotype: impact on neuronal viability. The Journal of neuroscience: the official journal of the Society for Neuroscience 2010; 30:3326–38.
- Di Marco Vieira B, Radford RAW, Hayashi J, Eaton ED, Greenaway B, Jambas M, et al. Extracellular Alpha-Synuclein Promotes a Neuroinhibitory Secretory Phenotype in Astrocytes. Life 2020; 10.
- Li Y, Feng L, Li G, An J, Zhang S, Li J, et al. Resveratrol prevents ISO-induced myocardial remodeling associated with regulating polarization of macrophages through VEGF-B/AMPK/NF-kB pathway. International immunopharmacology 2020; 84:106508.
- Levine B, Mizushima N, Virgin HW. Autophagy in immunity and inflammation. Nature 2011; 469:323–35.
- Klionsky DJ, Abdel-Aziz AK, Abdelfatah S, Abdellatif M, Abdoli A, Abel S, et al. Guidelines for the use and interpretation of assays for monitoring autophagy (4th edition)(1). Autophagy 2021; 17:1–382.