
ABSTRACT
Autophagy is considered a target for cancer treatment, although few compounds manipulating this process have been added to the anticancer arsenal in humans. Pharmacological manipulation of autophagy has therefore been considered in the treatment and chemosensitization of hepatocellular carcinoma (HCC), a heterogeneous malignancy that remains difficult to treat (limited impact of genomic discoveries for the implementation of personalized precision medicine). We analyzed the autophagy marker proteins p62 and LC3 in paired tumor and adjacent cirrhotic non-tumor tissues of human HCC. We show strong variability in p62 and LC3-II levels between tumor parts of different HCC patients and between tumor and non-tumor HCC in the same patient, suggesting heterogeneity in autophagy flux. This diversity in flux led us to consider a non-personalized method of autophagy targeting, combining simultaneous activation and blockade of autophagy, which could, in theory, benefit a substantial number of HCC patients, irrespective of tumor autophagic flux. We show that the combination of sodium butyrate (NaB, autophagy inducer) and chloroquine (CQ, autophagy blocker) has a marked and synergistic cytotoxic effect in vitro on all human liver cancer cell lines studied, compared with the cellular effect of each product separately, and with no deleterious effect on normal hepatocytes in culture. Cancer cell death was associated with accumulation of autophagosomes, induction of lysosome membrane permeabilization and increased oxidative stress. Our results suggest that simultaneous activation and blockade of autophagy may be a valuable approach against HCC, and that microbiota-derived products improve the sensitivity of HCC cells to antitumor agents.
Abbreviations AV: annexin V; CI: combination index; CTSB: Cathepsin B; CTSD: Cathepsin D; CTSF: Cathepsin F; CQ: chloroquine; DEN: N-diethylnitrosamine; DMEM: Dulbecco’s modified eagle medium; FBS: fetal bovine serum; FSC: forward scatter; GNS: N-acetylglucosamine-6-sulfatase; HCC: hepatocellular carcinoma; HDACi: histone deacetylase inhibitor; HCQ: hydroxychloroquine; LMP: lysosomal membrane permeabilization; LAMP1: lysosome-associated membrane protein; LIPA: Lysosomal acid lipase; LSR: Lysosomal staining cells; MAP1LC3A: microtubule associated protein 1 light chain 3 alpha; NaB: sodium butyrate; NASH: non-alcoholic steatohepatitis; NRF2: nuclear factor erythroid 2–related factor 2; PI: propidium iodide; PMSF: phenylmethanesulfonyl fluoride; ROS: reactive oxygen species; SCARB2: Scavenger receptor class B member 2; SQSTM1/p62: sequestosome 1; SMPD1: Sphingomyelin phosphodiesterase 1; SSC: side scatter; TFEB: transcription factor EB.
Introduction
Primary liver cancer is the sixth most common cancer worldwide and the second most common cause of cancer death in men. Hepatocellular carcinoma (HCC), which accounts for 80% of primary liver cancers, is very difficult to treat and, to date only a few drugs have been approved for clinical use [Citation1]. Their success is generally unsatisfactory due to the advanced stage of the disease at diagnosis, low median overall survival rates, high recurrence rates and the limited set of often non-recurrent mutations and drivers that precision medicine can target [Citation2–5]. All these factors make the development of more effective treatments for HCC, particularly for advanced stages, a major concern for research in this field.
Autophagy is an evolutionarily conserved process that plays a wide range of fundamental physiological and pathophysiological functions [Citation6]. Almost all cells maintain a basal rate of autophagy to preserve quality control of proteins and organelles in the cytoplasm [Citation7]. Cells increase autophagy to cope with stressful conditions, including starvation, hypoxia, metabolic stress and chemotherapeutic agents [Citation8]. In cancer, autophagy can play an antagonistic and dynamically adaptive role as tumor suppressor or promoter, depending, among other things, on the cellular context, tumor type, stage of tumor development, somatic genetic alterations and tumor microenvironment. Weak basal autophagy is generally thought to act as a tumor suppressor by eliminating damaged organelles and mutated cells, thus preventing the increase of reactive oxygen species and, indirectly, DNA damage and genome instability. In advanced cancers, autophagy enhances the survival and fitness of tumor cells, enabling them to overcome nutrient deprivation and hypoxia, maintain the cancer stem cell pool and ensure chemoresistance [Citation9–14]. Autophagy is also closely associated with the therapeutic response induced by various anticancer agents acting as a mechanism of cell death or survival. In the liver, autophagic degradation is essential due to the high metabolic activity and energy requirements of hepatocytes. Hepatic autophagy supports the diverse metabolic functions of this vital organ, and its dysfunction is associated with the pathogenesis of liver diseases such as viral hepatitis, non-alcoholic steatohepatitis (NASH), cirrhosis and HCC [Citation9,Citation15]. Analyses of expression levels of the autophagy marker proteins p62 and LC3 in tumors and adjacent non-tumor areas suggest heterogeneity of autophagy flux in HCC [Citation16–20]. It is significant to note, however, that the number of studies simultaneously comparing p62 and LC3 expression levels in human liver cancers is small, and in the case of HCC, which develops in a chronically diseased liver, none to our knowledge compares the non-tumor (cirrhosis, fibrosis) and tumor T parts in the same patient. This knowledge could help to better understand the heterogeneity of autophagy in liver cancer cells, and to identify HCC patients most likely to benefit from available autophagy-targeted therapies.
Pharmacological modulation of autophagy in different ways has been considered an attractive option for the treatment and chemosensitization of HCC. Autophagy inhibitors have been used as single agents to destroy autophagy-dependent tumors [Citation21–23], or in combination with cytotoxic chemotherapy or targeted therapy (e.g. the multikinase inhibitor sorafenib in HCC) to circumvent resistance or improve cancer treatment [Citation24–35]. The antimalarials chloroquine (CQ) and hydroxychloroquine (HCQ) are the few FDA-approved autophagy blockers and have been evaluated in a number of cancer clinical trials, unfortunately without significant therapeutic benefit as monotherapy [Citation36]. Another approach explored in cellular and preclinical systems involves activation of autophagy by PI3K/Akt/mTOR inhibitors, leading to induction of autophagic cell death (ACD) [Citation37–47], apoptotic/necrotic death or inhibition of cell proliferation [Citation48–51]. In addition, several studies show that simultaneous induction of autophagy and disruption of autophagic flux trigger lysosomal cell death [Citation52–56]. These results indicate that appropriate levels of autophagosome degradation are required to support autophagy in cellular homeostasis. Conversely, they suggest that impaired autophagic flux shifts autophagy from a cell-protective process to one that is detrimental to the cell.
As autophagy flux can differ from one cancer patient to another and according to the stage of carcinogenesis, and as there are no biomarkers to measure autophagy flux [Citation57] accurately in archived samples and in vivo and to verify the effectiveness of a therapeutic intervention, we evaluated a non-personalized method of autophagy targeting, combining simultaneous activation and blockade of autophagy, which, in theory, could benefit many liver cancer patients. Chloroquine was chosen as autophagy blocker and sodium butyrate as autophagy activator. Sodium butyrate is a histone deacetylase inhibitor (HDACi), produced by bacterial fermentation of dietary fibers, which induces autophagy in cancer cells, including hepatoma cells, by inhibiting the Akt/mTOR pathway and increasing the expression of autophagy-related proteins [Citation58]. Furthermore, gut dysbiosis in patients with early-stage HCC is characterized by a decrease in the abundance of butyrate-producing commensal bacteria compared with healthy control individuals, and thus by a depletion of the short-chain fatty acid butyrate, which could be involved in HCC development [Citation59].
In this study, we demonstrate that LC3-II and p62 levels differ between the HCC tumors of different patients and between tumor and non-tumor parts of the same patient, suggesting a variable and heterogeneous intra-patient and inter-patient autophagy flux in HCC. We then conduct a series of in vitro experiments to assess the effects of the combination of sodium butyrate (NaB) and chloroquine (CQ) on cell lines derived from primary liver cancer. We confirm that butyrate activates autophagy and chloroquine blocks autophagic flux in the late phase of the autophagic process, leading to the accumulation of autophagosomes and cell death in all lines tested. A basis for the increased apoptotic death of cancer cells was found to be the effectiveness of the NaB/CQ combination in inducing autophagosome accumulation, lysosomal membrane permeabilization and increased reactive oxygen species.
Results
Autophagic flux is highly heterogeneous in human HCC
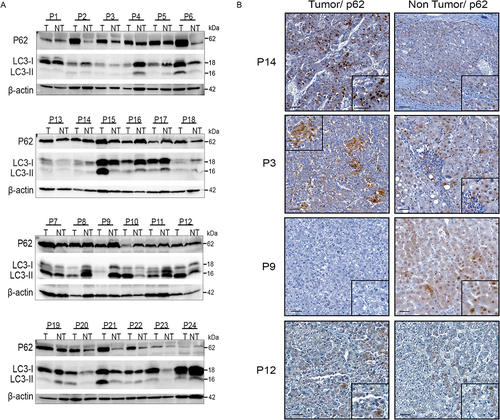
To obtain an accurate picture of autophagy flux in human HCC, we analysed the autophagy markers p62, also known as SQSTM1/sequestome 1, and LC3-II in pairs of tumor (T) and non-tumor (NT) HCC samples (n=23) by Western blot analysis and immunohistochemistry. We show that, although the sample cohort was relatively small, it was able to detect differences in p62 and LC3 levels between the T and NT parts of an individual patient, as well as between the T parts of different patients (). With all due caution given the small sample size, we did not find any significant association between tumor and non-tumor expression levels of p62 and LC3 with the clinical annotations available, in particular tumor grade (Edmondson-Steiner grade), etiological factor of HCC, 4-point Metavir fibrosis score. As the use of lysomotropic agents is the only means of deducing the basal autophagy flux in a patient and comparing this flux between the T and NT parts and between patients, which is obviously not feasible in humans, it is not possible to state with certainty the type of flux present at a given time in the liver of patients with HCC. For example, in the livers of P6, P15 and P21 patients, the levels of p62 and LC3 are increased in the T parts compared with the NT parts. On the one hand, the increase in LC3-II levels in the T part compared with the NT part may indicate either accumulation of autophagic vesicles and blockade of autophagy at late stages, or the formation of autophagic vesicles indicating activation of autophagy. On the other hand, the increase in p62 levels in the T part compared with the NT part may indicate either a blockade of autophagy or an increase in p62 expression. It is therefore impossible to draw conclusions about autophagic flux from the analysis of patient tissue samples. Another example is the livers of patients P9, P11, P16 and P17 in which the levels of p62 and LC3-II are decreased in the T parts compared with the NT parts. On the one hand, the decrease in LC3-II levels in the T part compared with the NT part could indicate either degradation of LC3-II during the autophagy process and therefore induction of autophagy, or a decrease in the formation of autophagic vesicles and therefore inhibition of autophagy. On the other hand, the decrease in p62 levels in the T part compared with the NT part may indicate either degradation of p62 by the autophagy process and therefore induction of autophagy, or a decrease in p62 expression levels. The p62 immunostaining profiles show that p62 is variably expressed in HCC, both in tumor parts of different patients and between tumor and non-tumor parts of the same patient, which is consistent with the immunoblot data (). In the livers of patients P3 and P14, the level of p62 is increased in the tumor part compared with the non-tumor liver, whereas it is decreased in the P9 tumor and is not modulated in the P12 tumor compared with the non-tumor liver. Although it is complex, if not impossible with the current tools available to us, to define the basal autophagy flux in a tumor and its variation between NT and T parts of the same liver, our results reveal intra-tumor heterogeneity in autophagy flux between HCC patients as well as heterogeneity in changes in autophagy flux between the T and NT areas of the same liver.
Figure 1. Diversity and variability of autophagic flux in human HCC. (A) Western blotting of anti-p62 and anti-LC3 on extracts of tumor (T) and non-tumor (NT) liver tissue from 24 HCC patients. P2: patient number 2. (B) Representative immunohistochemical staining of p62 in tumor and non-tumor areas from the indicated patients (scale bars, 50µM).
The combination of sodium butyrate and chloroquine is a potent cytotoxic agent for liver cancer cells
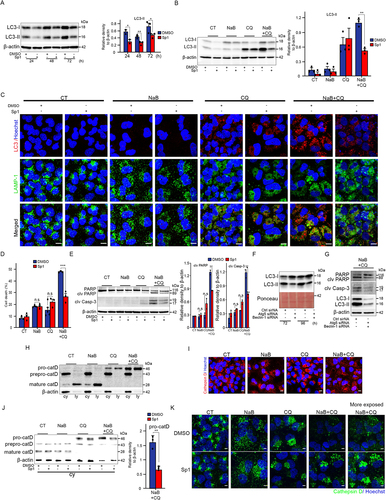
We assessed autophagy flux in a set of cell lines derived from human liver cancer. The relative accumulation of LC3-II protein after chloroquine (CQ) treatment is an indication of autophagy flux. All cell lines tested showed activated autophagy with lineage-dependent variation in the rate of autophagy flux (). We measured the cytotoxicity of sodium butyrate (NaB) and CQ as individual treatments on Huh-7 cells at concentrations within the range of previously reported studies [Citation23,Citation58]. As cancer cells become resistant to drugs by different mechanisms, we selected for each agent the concentration causing around 20% cell death at 72 hours and tested whether cytotoxicity increased when cells were treated with the combination of the two agents. The addition of 4 mM NaB alone to Huh7 cells caused 20% cell death and that of CQ at 10 μM and 20 μM 13% and 17% cell death, respectively, at 72h after stimulation, compared with 4-10% cell death in untreated cells (Figure S1A,S1B). The doses chosen for subsequent experiments were for NaB 4mM and for CQ 10 and 20µM. 4mM NaB alone reduced Huh7 cell viability to 76 ± 4% and 70 ± 11%, and 20µM CQ alone to 74 ± 5% and 71 ± 4% after 48h and 72h of stimulation, respectively. The cytotoxic effect was significantly enhanced in the presence of both agents combined, with cell viability reduced by 46 ± 3% and 31 ± 5% after 48h and 72h of stimulation, respectively (). Since the combination with 10µM CQ produced no significant change, we conducted further experiments with CQ 20µM. Measurements of cell death by propidium iodide uptake and flow cytometry confirmed the anticancer potential of the combination compared to the individual components (cell death: 4mM NaB = 19 ± 1%; 20µM CQ = 13 ± 2%; 4mM NaB + 20µM CQ = 52 ± 1%) (). FACS analysis after labeling cells with annexin V-FITC/propidium iodide (AV/PI) showed that the combination significantly increased cell death, as evidenced by the marked increase in the percentage of AV+/PI- (14±2.4%) and AV+/PI+ (26±2.2%) Huh7 cells compared with that induced by each agent separately (NaB: AV+/PI- = 4 ± 0.4%; AV+/PI+ = 12 ± 1%. CQ: AV+/PI- = 3.2 ± 0.5%; AV+/PI+ = 7 ± 0.8%) (). This is in line with the cleavage of the pro-apoptotic proteins caspase-3 and PARP by immunoblot (). We assessed the interaction between NaB and CQ by calculating the combination index (CI), which measures synergy (CI < 1), additive effect (CI = 1) or antagonism (CI > 1). We found that NaB and CQ given in combination were synergistic (CI = 0.7) in inducing HuH7 cell death. The cytotoxic capacity of the drugs was then tested on other liver cancer-derived lines, two cholangiocarcinoma lines, CC-SW-1 and CCLP-1 (), and three HCC lines, Hep3B, HepG2, and PLC/PRF/5 (), in the presence of NaB and CQ, alone or in combination for 72h. The sensitivity of each cell line to NaB and CQ was determined in a dose-response study. The combination had a large and significant cytotoxic effect on all the cell lines tested (around 40% cell death for Hep3B, 60% for all other lines), compared with that induced by the drugs incubated separately (around 25% cell death) (). The cytotoxic activity induced by the combination on cancer cell lines was not found on human hepatocytes in primary culture, whose viability was 85±1% compared with that of hepatocytes unstimulated or stimulated with a single drug (98±3%) (). These data demonstrate that the combination of NaB and CQ has a substantial synergistic cytotoxic effect on all the hepatic cancer cell lines tested, which have distinct genotypic profiles, with no deleterious effect on normal hepatocytes in culture.
Figure 2. Liver cancer cells are highly susceptible to death by the combined action of sodium butyrate and chloroquine. (A) Representative Western blotting analysis with the indicated antibodies on cell lysates from the indicated liver cancer cell lines, exposed or not to chloroquine (CQ; 5µM) for 48h. The bottom graph represents the mean ± SEM densitometric quantification of LC3-II versus the b-actin control in three independent experiments. (B-E) HuH-7 cells were exposed to sodium butyrate (NaB; 4mM), chloroquine (CQ; 10µM or 20µM) separately or in combination. From panel C onwards, the only CQ concentration used was 20µM. CT: unexposed control cells. (B) Top images: representative photographs of crystal violet-stained cells exposed to the indicated agents for 72h. Three independent experiments. Scale bars, 200µm. Graphs below: two representations (histograms on the left and curves on the right) of the percentage of live HuH-7 cells as a function of time. All conditions: a single histogram is shown, as viability is the same between CT cells and those exposed to NaB or CQ alone or in combination at 24h. Data are means ± SEM of three independent experiments. (C) Representative cytometric analysis of propidium iodide (PI)-stained cells. Graphs represent the mean ± SEM of five independent experiments. (D) Cytometric quantification of apoptosis by annexin V plus PI staining. AV+/PI-: early apoptotic cells (green). AV+/PI+: late apoptotic and necrotic cells (orange). Mean ± SEM of three independent experiments. P-value <0.01 for percentage cell death with NaB and CQ combination versus a single NaB or CQ agent. (E) Western blot analysis of PARP, cleaved PARP (clv PARP) and cleaved caspase 3 (clv Casp-3). Mean ± SEM of densitometry quantification from four independent experiments. (F,G) Quantification of cell death by propidium iodide staining and flow cytometry of cholangiocarcinoma (F) and HCC (G) cell lines exposed to sodium butyrate (NaB) and chloroquine (CQ) separately or in combination for 72h. Data are means ± SEM of three independent experiments. (H) Percentage of primary human hepatocytes alive after exposure to the indicated compounds for 72h versus control cells (CT), assessed by crystal violet absorbance. The graph shows the mean ± SEM of three independent experiments (corresponding to perfused liver pieces from three different surgical subjects). *denotes statistical comparison with untreated cells (CT), $ denotes statistical comparison with cells treated with [Bu 4mM+CQ 20µM]. Statistical comparisons were made using Student’s t-test (A) and Anova (B-C, E-H); *, $ p<0.05; **, $$ p<0.01; ***, $$$ p<0.001.
![Figure 2. Liver cancer cells are highly susceptible to death by the combined action of sodium butyrate and chloroquine. (A) Representative Western blotting analysis with the indicated antibodies on cell lysates from the indicated liver cancer cell lines, exposed or not to chloroquine (CQ; 5µM) for 48h. The bottom graph represents the mean ± SEM densitometric quantification of LC3-II versus the b-actin control in three independent experiments. (B-E) HuH-7 cells were exposed to sodium butyrate (NaB; 4mM), chloroquine (CQ; 10µM or 20µM) separately or in combination. From panel C onwards, the only CQ concentration used was 20µM. CT: unexposed control cells. (B) Top images: representative photographs of crystal violet-stained cells exposed to the indicated agents for 72h. Three independent experiments. Scale bars, 200µm. Graphs below: two representations (histograms on the left and curves on the right) of the percentage of live HuH-7 cells as a function of time. All conditions: a single histogram is shown, as viability is the same between CT cells and those exposed to NaB or CQ alone or in combination at 24h. Data are means ± SEM of three independent experiments. (C) Representative cytometric analysis of propidium iodide (PI)-stained cells. Graphs represent the mean ± SEM of five independent experiments. (D) Cytometric quantification of apoptosis by annexin V plus PI staining. AV+/PI-: early apoptotic cells (green). AV+/PI+: late apoptotic and necrotic cells (orange). Mean ± SEM of three independent experiments. P-value <0.01 for percentage cell death with NaB and CQ combination versus a single NaB or CQ agent. (E) Western blot analysis of PARP, cleaved PARP (clv PARP) and cleaved caspase 3 (clv Casp-3). Mean ± SEM of densitometry quantification from four independent experiments. (F,G) Quantification of cell death by propidium iodide staining and flow cytometry of cholangiocarcinoma (F) and HCC (G) cell lines exposed to sodium butyrate (NaB) and chloroquine (CQ) separately or in combination for 72h. Data are means ± SEM of three independent experiments. (H) Percentage of primary human hepatocytes alive after exposure to the indicated compounds for 72h versus control cells (CT), assessed by crystal violet absorbance. The graph shows the mean ± SEM of three independent experiments (corresponding to perfused liver pieces from three different surgical subjects). *denotes statistical comparison with untreated cells (CT), $ denotes statistical comparison with cells treated with [Bu 4mM+CQ 20µM]. Statistical comparisons were made using Student’s t-test (A) and Anova (B-C, E-H); *, $ p<0.05; **, $$ p<0.01; ***, $$$ p<0.001.](/cms/asset/c8df7630-86ac-497a-a637-aeb4d9a282f2/kauo_a_2326241_f0002_oc.jpg)
The NaB/CQ combination boosts the accumulation of autophagosomes
Exposure of Huh7 cells to NaB alone induced a remarkable increase in the protein level of the transcription factor EB (TFEB) known to induce autophagy by activating autophagy- and lysosome-related genes (). Consistently, NaB caused increased mRNA levels of a set of lysosomal genes and the autophagy-related gene LC3 (). A significant increase in the number of lysosome-associated membrane protein 1 (LAMP1) puncta per cell, reflecting a greater number of lysosomes (), as well as an increase in LC3 protein levels () support an NaB-mediated transcriptional regulatory effect. Autophagy flux is monitored in protein levels of autophagosomal or autolysosomal membrane-associated LC3-II and the autophagy substrate, p62, with or without a late-stage autophagy blocker, vitro by measuring such as CQ or bafilomycin A1 (Citation60). In this study, CQ was used in combination as an established late-stage autophagy blocker. As expected, CQ induced an increase in LC3-II and p62 compared with untreated cells, indicating late-stage autophagy blockade (). NaB induced a high autophagy flux, as shown by the significant decrease in LC3-II and p62 levels in NaB-treated cells compared to untreated cells, and finally cells exposed to the NaB/CQ combination showed a marked accumulation of LC3-II levels compared to those exposed to CQ alone (). Furthermore, p62 levels in cells subjected to the NaB/CQ combination compared with those treated with NaB alone returned to basal levels, indicating that CQ prevented NaB-mediated p62 degradation and that the combination simultaneously activated and blocked autophagy at late stages, leading to the accumulation of autophagic vesicles (). The increase in LC3-labeled autophagic vesicles, illustrated by an increase in the number of LC3-positive puncta in combination-treated cells, is consistent with biochemical data (). Impaired autophagosome-lysosome fusion, leading to autophagosome accumulation, and impaired autolysosome degradation, leading to autolysosome accumulation, have both been shown to occur in response to CQ [Citation61,Citation62]. We established a Huh-7 cell line stably expressing red fluorescent protein (RFP)-GFP tandem fluorescent-LC3 (RFP-GFP-LC3) to assess the different types of autophagy vesicles, then treated these cells with NaB, CQ or combination of both. We found that the accumulated autophagic vesicles were autophagosomes, as shown by the accumulation of vesicles double-stained by GFP and RFP in cells treated with CQ and the combination NaB/CQ (). Autophagosome accumulation in CQ-treated cells does not appear to have involved pH modification, since we did not observe in these cells an increase in the population of low lysosomal staining cells (L-LSR) representing pH-modified cells compared to untreated cells. We did observe an increase in the population of high lysosomal staining cells (H-LSR) in CQ-treated cells, indicating an increase in acidic compartments and confirming the accumulation of autophagosomes in CQ-treated cells (). In contrast, cells treated with the combination showed an increase in the cell population exhibiting L-LSR (33±2%) (), indicating a change in pH and suggesting the induction of lysosomal membrane permeabilization (LMP), a process that can lead to cell death (Citation56). We then examined the dysfunction of lysosomal enzymes in CQ-treated cells and found that CQ remarkably prevented maturation of the lysosomal enzyme cathepsin D (). Overall, these data show that NaB induces a high autophagy flux and that, at the same time, CQ inhibits lysosomal enzymatic activity, and prevents fusion between autophagosomes and lysosomes, leading to increased accumulation of autophagosomes.
Figure 3. Dramatic increase in LC3-positive vesicular structures in cancer cells exposed to NaB and CQ. (A) Anti-transcription factor EB (TFEB) Western blot of HuH-7 cell extracts, untreated (CT) or treated with sodium butyrate (NaB; 4mM). (B) mRNA expression levels of the indicated lysosomal gene markers and the autophagy-related LC3 gene in cells treated with sodium butyrate (NaB; 4mM) or untreated (CT). Mean ± SEM of three independent experiments. (C) Representative anti-LAMP1 immunofluorescence for late lysosomes and endosomes and Hoechst images of HuH-7 cells exposed or not to 4mM NaB. Mean ± SEM of the number of LAMP-1-positive puncta per cell from two independent experiments. Scale bars, 10µM. (D) Representative Western blotting analysis with indicated antibodies on HuH-7 cell lysates, exposed to sodium butyrate (NaB, 4mM) or chloroquine (CQ, 20µM) or both for 72h. Mean ± SEM densitometry quantification of LC3-I, LC3-II and p62 versus b-actin control in four independent experiments. CT: unexposed control cells. (E) Representative anti-LC3 immunofluorescence for autophagy and Hoechst images. Quantification of the mean number of LC3-positive puncta per cell from 3 independent experiments using the ImageJ quantification tool. Scale bars, 10µM. CTSB: Cathepsin B; CTSD: Cathepsin D; CTSF: Cathepsin F; GNS: N-acetylglucosamine-6-sulfatase; LIPA: Lysosomal acid lipase; SMPD1: Sphingomyelin phosphodiesterase 1; LAMP2: Lysosomal-associated membrane protein 2; SCARB2: Scavenger receptor class B member 2; MAP1LC3A: Microtubule associated protein 1 light chain 3 alpha. * denotes statistical comparison with untreated cells. $ denotes statistical comparison with [Bu+CQ]-treated cells. Statistical comparisons were made using Student’s t-test (A-C) and Anova (D, E). *, $ p<0.05; **, $$ p<0.01; ***, $$$ p<0.001.
![Figure 3. Dramatic increase in LC3-positive vesicular structures in cancer cells exposed to NaB and CQ. (A) Anti-transcription factor EB (TFEB) Western blot of HuH-7 cell extracts, untreated (CT) or treated with sodium butyrate (NaB; 4mM). (B) mRNA expression levels of the indicated lysosomal gene markers and the autophagy-related LC3 gene in cells treated with sodium butyrate (NaB; 4mM) or untreated (CT). Mean ± SEM of three independent experiments. (C) Representative anti-LAMP1 immunofluorescence for late lysosomes and endosomes and Hoechst images of HuH-7 cells exposed or not to 4mM NaB. Mean ± SEM of the number of LAMP-1-positive puncta per cell from two independent experiments. Scale bars, 10µM. (D) Representative Western blotting analysis with indicated antibodies on HuH-7 cell lysates, exposed to sodium butyrate (NaB, 4mM) or chloroquine (CQ, 20µM) or both for 72h. Mean ± SEM densitometry quantification of LC3-I, LC3-II and p62 versus b-actin control in four independent experiments. CT: unexposed control cells. (E) Representative anti-LC3 immunofluorescence for autophagy and Hoechst images. Quantification of the mean number of LC3-positive puncta per cell from 3 independent experiments using the ImageJ quantification tool. Scale bars, 10µM. CTSB: Cathepsin B; CTSD: Cathepsin D; CTSF: Cathepsin F; GNS: N-acetylglucosamine-6-sulfatase; LIPA: Lysosomal acid lipase; SMPD1: Sphingomyelin phosphodiesterase 1; LAMP2: Lysosomal-associated membrane protein 2; SCARB2: Scavenger receptor class B member 2; MAP1LC3A: Microtubule associated protein 1 light chain 3 alpha. * denotes statistical comparison with untreated cells. $ denotes statistical comparison with [Bu+CQ]-treated cells. Statistical comparisons were made using Student’s t-test (A-C) and Anova (D, E). *, $ p<0.05; **, $$ p<0.01; ***, $$$ p<0.001.](/cms/asset/44195e83-953d-4b94-b6d5-451f223cf15c/kauo_a_2326241_f0003_oc.jpg)
Figure 4. NaB combined with CQ causes autophagosomes to accumulate in cancer cells. (A) Representative immunofluorescence images showing RFP/GFP-LC3 and Hoechst (blue) in HuH-7 cells stably transfected with Lv-RFP/GFP-LC3 incubated with sodium butyrate (NaB, 4mM), chloroquine (CQ, 20µM), or both for 72h. CT: untreated control cells. Lv: lentivirus. Three independent experiments. Scale bars, 10µM. (B) Representative flow cytometric analysis of lysosomal compartments using the fluorescent probe Cytopainter Lysodeep red (lysosomal red staining reagent, LSR) for non-transfected Huh-7 cells treated with the indicated agents. Right: graphs showing the mean ± SEM of the percentage of cells showing high (top) and low (bottom) LSR fluorescence from two independent experiments. FSC: forward scatter. (C) Western blot analysis of the lysosomal enzyme cathepsin-D (CatD). * indicates statistical comparison with untreated cells. $ indicates statistical comparison with [Bu+CQ]-treated cells. Statistical comparisons were made using Anova. ***, $$$ p<0.001.
![Figure 4. NaB combined with CQ causes autophagosomes to accumulate in cancer cells. (A) Representative immunofluorescence images showing RFP/GFP-LC3 and Hoechst (blue) in HuH-7 cells stably transfected with Lv-RFP/GFP-LC3 incubated with sodium butyrate (NaB, 4mM), chloroquine (CQ, 20µM), or both for 72h. CT: untreated control cells. Lv: lentivirus. Three independent experiments. Scale bars, 10µM. (B) Representative flow cytometric analysis of lysosomal compartments using the fluorescent probe Cytopainter Lysodeep red (lysosomal red staining reagent, LSR) for non-transfected Huh-7 cells treated with the indicated agents. Right: graphs showing the mean ± SEM of the percentage of cells showing high (top) and low (bottom) LSR fluorescence from two independent experiments. FSC: forward scatter. (C) Western blot analysis of the lysosomal enzyme cathepsin-D (CatD). * indicates statistical comparison with untreated cells. $ indicates statistical comparison with [Bu+CQ]-treated cells. Statistical comparisons were made using Anova. ***, $$$ p<0.001.](/cms/asset/b523ca6f-e57e-482c-a1dd-579699b5555e/kauo_a_2326241_f0004_oc.jpg)
NaB/CQ-induced cell death involves autophagosome accumulation and LMP induction
To substantiate the link between modulation of autophagy and induction of cell death by the NaB/CQ combination, we examined the effect of spautin-1, a potent, early-stage-specific inhibitor of autophagy, on NaB/CQ-treated cells. We first confirmed the efficacy of spautin-1 in inhibiting autophagy, insofar as it reduced the accumulation of LC3-II protein representing autophagosomes (). Spautin-1 can inhibit autophagy in a Beclin-1-dependent or Beclin-1-independent manner. In our system, as shown in Supplementary Figure 2, the addition of Spautin-1 did not affect Beclin-1 levels. We demonstrated the efficacy of spautin-1 in reducing levels of autophagosome accumulation in NaB/CQ-treated cells, as evidenced by the decrease in LC3-II levels in the presence of spautin-1 in these cells (). The decrease in autophagosome accumulation was confirmed by the decrease in accumulation of LC3-positive structures but not Lamp-1-positive organelles in NaB/CQ and spautin-1-treated cells (). These results are consistent with those of the GFP-RFP-LC3 puncta assay in indicating an accumulation of autophagosomes. We found that the addition of spautin-1 significantly rescued NaB/CQ-treated cells from death, underscoring the cytotoxic role of accumulated autolysosomes (). This was associated with a significant reduction in caspase-3 and PARP cleavage in cells incubated with NaB/CQ and spautin-1 compared to those incubated with DMSO (). Subsequently, genetic suppression of autophagy provided strong evidence for the involvement of autophagosome accumulation in NaB/CQ-induced cell death. The efficacy of autophagy suppression was evidenced by the reduction in autophagosome accumulation 72h and 96h after transfection with Atg7 and Beclin-1 siRNAs (). We show that after inhibition of the Atg7 and Beclin-1 genes by siRNA, NaB/CQ-treated cells were significantly preserved from death, which is illustrated by a decrease in the levels of cleaved PARP and caspase3, and supports the cytotoxic role of accumulated autolysosomes following NaB/CQ treatment (). LC3-II levels decreased in NaB/CQ-treated cells following inhibition of Atg7 and Beclin-1 gene expression compared to NaB/CQ-treated cells with CTRL siRNA, confirming a role for downregulation of Atg7 and Beclin-1 in the decrease of autophagosome accumulation (). We then studied the effect of altered autophagic flux and autophagosome accumulation on the lysosomal compartment, as suggests an induction of LMP in cells treated with the NaB/CQ combination. LMP induction was estimated by the release of cathepsin D from the lysosomal fraction into the cytosolic fraction once the lysosomal membrane had been damaged. As CQ alters the maturation of procathepsin D into mature cathepsin D, the level of procathepsin released into the cytoplasm (and normally localized in lysosomes) was compared by Western blot analysis after sub-fractionation. Treatment of cells with the NaB/CQ combination markedly increased the level of procathepsin D in the cytoplasmic fraction, confirming the induction of LMP (). Levels of cathepsin D released from the lysosomal fraction into the cytosolic fraction were measured in the presence and absence of spautin-1 to reinforce the link between autophagosome accumulation and LMP induction in NaB/CQ-treated cells. Treatment of cells with NaB/CQ and spautin-1 significantly decreased the levels of procathepsin D released into the cytoplasmic fraction compared with those not treated with spautin-1, confirming the role of accumulated autophagosomes in LMP induction (). These results indicate that the accumulation of autophagosomes induced by the NaB/CQ combination contributed to Huh-7 cell death along with LMP induction.
Figure 5. Autophagosome accumulation and lysosomal membrane permeabilization are consistent with cell death triggered by the combination of NaB and CQ. (A) Anti-LC3 Western blot analysis of extracts from HuH-7 cells treated with the autophagy inhibitor spautin1 (Sp1, 5µM) or not (-; DMSO) for the times indicated. Right: Mean ± SEM densitometry quantification from 2-3 independent experiments. (B) Anti-LC3 Western blot analysis of HuH-7 extracts incubated with spautin1 (Sp1) or not (-; DMSO) exposed with sodium butyrate (NaB, 4mM), chloroquine (CQ, 20µM), or both for 72h. Right: Mean ± SEM densitometry quantification from 2-3 independent experiments. (C) Representative immunofluorescence images showing LC3 (red), LAMP-1 (green) and Hoechst (blue) in HuH-7 cells incubated with spautin1 (Sp1) or not (-; DMSO) exposed to sodium butyrate (NaB, 4mM), chloroquine (CQ, 20µM), or both for 72h. CT: untreated control cells. Three independent experiments. Scale bars, 10µM. (D) Cytometric quantification of cell death by propidium iodide staining 72h after exposure to NaB, CQ or both in the presence or absence of spautin. CT: control cells. Mean ± SEM of 3-4 independent experiments. (E) Western blot analysis of PARP, cleaved PARP (clv PARP) and cleaved caspase 3 (clv Casp-3). Mean ± SEM densitometry quantification from 2-3 independent experiments. (F) Anti-LC3 Western blot analysis on extracts from HuH-7 cells transfected with (Atg7+Beclin-1 siRNA, 2µM) or not (Ctrl siRNA; 2µM) for the indicated times. (G) Anti-PARP, -cleaved caspase 3 and -LC3 Western blot analysis on extracts from HuH-7 cells transfected with (Atg7+Beclin-1 siRNA, 2µM) or not (Ctrl siRNA; 2µM) for 96h and exposed to the combination NaB/CQ for 72h. (H) Western blot anti-cathepsin-D (CatD) on cytosolic (cy) and lysosomal (ly) fractions of HuH-7 cells exposed to NaB, CQ or both for 72h. Two independent experiments. (I) Representative images of anti-CathepsinD and Hoechst immunofluorescence. Scale bars, 10µM. Three independent experiments. (J) Anti-cathepsin D Western blot analysis on cytosolic (cy) fractions from HuH-7 cells incubated with spautin1 (Sp1) or not (-; DMSO) exposed with sodium butyrate (NaB, 4mM), chloroquine (CQ, 20µM), or both for 72h. Right: Mean ± SEM densitometry quantification from 3 independent experiments. (K) Representative images of anti-CathepsinD and Hoechst immunofluorescence. Scale bars, 10µM. Three independent experiments. Data are averages ± SEM. <, p < 0.05; <<, p<0.01; <<<, p<0.001 by Student’s t test. NS or no statistical indication, no significance.
The NaB/CQ combination promotes cell death by triggering oxidative stress
The production of reactive oxygen species (ROS) in response to chemotherapeutic drugs is a critical event in the induction of cancer cell death (Citation63). In addition, it has been shown that autophagosome accumulation causes an energy deficit and increase levels of ROS (Citation64) and that increased ROS levels are associated with the induction of LMP (Citation65). We quantified the level of ROS produced in Huh-7 cells incubated with the NaB/CQ combination and showed that it was significantly higher in these cells than in those incubated with NaB or CQ alone, both of which are well known to induce an increase in ROS levels (). This increase in ROS largely contributed to the cell death induced by the NaB/CQ combination, this effect on cell death being significantly reduced in the presence of the antioxidant reduced L-glutathione (). The addition of reduced L-glutathione also significantly decreased the level of caspase-3 and PARP cleavage in NaB/CQ-treated cells compared with untreated cells (). These results suggest that increased ROS production is an essential mediator in the induction of cell death by the NaB/CQ combination.
Figure 6. Oxidative stress-induced ROS generation induces death in cancer cells subjected to NaB and CQ. (A) Reactive oxygen species (ROS) levels in HuH-7 cells exposed to sodium butyrate (NaB, 4mM), chloroquine (CQ, 20µM), or both for 72h, measured by flow cytometry with the green fluorescent probe CellROX. Top: Representative flow cytometry curves. Cells with high CellROX content (HIGH): the 7% most strongly fluorescent cells in the unexposed CT control condition. Bottom: Percentage of cells in the high intensity range in 3 independent experiments. (B) Representative photographs of crystal violet-stained cells exposed to the indicated agents in the presence or absence of reduced L-glutathione (RLG, 5mM) for 72h. Three independent experiments. Scale bars, 200µm. (C) Cytometric quantification of cell death by propidium iodide staining. Three independent experiments. (D) Western blot analysis of PARP, cleaved PARP (clv PARP) and cleaved caspase 3 (clv Casp-3). Mean ± SEM densitometry quantification from 2-4 independent experiments. Statistical comparisons were made using Anova for A and Student’s t test for C and D. *, $ p<0.05; **, $$ p<0.01; ***, $$$ p<0.001. For panel 6A: < indicates statistical comparison with untreated cells (CT) and $ indicates statistical comparison with [Bu+CQ]-treated cells. NS or no statistical indication, no significance.
![Figure 6. Oxidative stress-induced ROS generation induces death in cancer cells subjected to NaB and CQ. (A) Reactive oxygen species (ROS) levels in HuH-7 cells exposed to sodium butyrate (NaB, 4mM), chloroquine (CQ, 20µM), or both for 72h, measured by flow cytometry with the green fluorescent probe CellROX. Top: Representative flow cytometry curves. Cells with high CellROX content (HIGH): the 7% most strongly fluorescent cells in the unexposed CT control condition. Bottom: Percentage of cells in the high intensity range in 3 independent experiments. (B) Representative photographs of crystal violet-stained cells exposed to the indicated agents in the presence or absence of reduced L-glutathione (RLG, 5mM) for 72h. Three independent experiments. Scale bars, 200µm. (C) Cytometric quantification of cell death by propidium iodide staining. Three independent experiments. (D) Western blot analysis of PARP, cleaved PARP (clv PARP) and cleaved caspase 3 (clv Casp-3). Mean ± SEM densitometry quantification from 2-4 independent experiments. Statistical comparisons were made using Anova for A and Student’s t test for C and D. *, $ p<0.05; **, $$ p<0.01; ***, $$$ p<0.001. For panel 6A: < indicates statistical comparison with untreated cells (CT) and $ indicates statistical comparison with [Bu+CQ]-treated cells. NS or no statistical indication, no significance.](/cms/asset/bb60e3f0-1dba-4072-88e9-be6758bc8123/kauo_a_2326241_f0006_oc.jpg)
Discussion
In this study, the combined activation and blockade of autophagy by NaB/CQ provides an effective means of triggering liver cancer cell death without harming normal liver cells. We show that the autophagy inducer NaB induces an early activation of autophagy leading to the biogenesis of autophagosomes, after which the autophagy blocker CQ blocks the fusion between autophagosomes and lysosomes, resulting in the accumulation of autophagosomes in the cell cytoplasm. Ultimately, these altered autophagic fluxes lead to lysosomal membrane permeabilization and, together, increased levels of ROS cause significant toxicity in liver cancer cells.
Manipulating autophagy as a therapeutic option has become an area of interest in liver disease research, including HCC [Citation66]. As previously mentioned, autophagy has been shown to have a dual role in cancer. The tumor suppressor role was demonstrated by the development of benign liver adenomas in mice with a systemic mosaic deletion of Atg5 and in mice with a specific deletion of Atg7-/- in the liver. This anti-cancer role has been linked in part to the role of autophagy in p62 digestion, in relation to p62’s involvement in NRF2 stabilization and persistent activation of the antioxidant pathway. In this model, only benign tumors develop, suggesting that activation of autophagy may be required to progress to a malignant state [Citation67].
The P62 protein has been shown to be necessary and sufficient to induce HCC [Citation18]. Other experimental models of specific deletion of autophagy genes in the liver have confirmed their crucial role in liver homeostasis and hepatic carcinogenesis [Citation20,Citation68,Citation69]. Using the N-diethylnitrosamine (DEN)-induced rat model of HCC, autophagy was shown to have a pro-tumor effect during the tumor formation phase, illustrated by the induction of tumor destruction following autophagy inhibition [Citation22]. In addition, autophagy plays a role in treatment resistance by reducing chemotherapy-induced ROS levels [Citation30].
At present, there is no standardized, well-established method for measuring autophagic flux in humans, which hinders dynamic studies during disease progression and in response to treatment, and prevents personalized care by targeting autophagy. In the case of HCC, the difficulty is even greater, since it is a cancer that develops mainly on a chronic liver disease, namely cirrhosis, the autophagic flux of which is poorly understood. It is therefore not known whether the autophagy flux reported as being impaired in HCC is similar (i.e. at the same stage) in malignant tissue and cirrhotic tissue adjacent to HCC, as pairwise studies are very rare. We also lack information on whether we should expect different responses to different autophagy manipulation strategies depending on the current autophagy flux in the tissues of HCC patients. Here, we show that autophagy flux is a heterogeneous component in the liver of HCC patients, based on differences in p62 and LC3-II expression levels between tumor parts of different patients studied as well as between tumor and non-tumor parts of the same patient, raising the question of the applicability of autophagy-based therapeutic interventions in HCC. Approaches based on the concomitant induction of autophagy and inhibition of autophagic flux can promote cell death, opening up promising therapeutic prospects [Citation52,Citation62,Citation70]. We applied this method to several human liver cancer lines of different cancer genotypes and found a pronounced cytotoxic effect. Sodium butyrate NaB induced early activation of autophagy, autophagosome biogenesis, and chloroquine CQ, by blocking their fusion with lysosomes, allowed accumulation of autophagosomes, LMP, oxidative stress and cell death.
To our knowledge, this is the first study on human tissue comparing the expression of the two autophagy markers p62 and LC3 in HCC tumors and paired adjacent non-tumor tissues (mainly cirrhotic). In a previous study of autophagy-related markers as predictors of postoperative HCC recurrence, quantification of tissue immunohistochemistry showed that p62 and LC3 levels varied from patient to patient [Citation19]. In another study investigating p62 levels and Nrf2 pathway activation in hepatocellular carcinoma cells, the authors found by immunohistochemistry that p62 accumulated in 25% and 21% of HCC and HCC-adjacent tissue respectively, suggesting that autophagy is blocked (Citation16). Others have shown, by focusing on p62 expression, that its level was heterogeneous among the HCC patients studied [Citation20]. These results and other studies suggest a variable autophagy flux between HCC tumors, although the picture is not really established due to the absence of possible measurement of the autophagy markers p62 and LC3-II under the effect or not of lysosomotrophic agents in patients, which alone would provide an accurate reading of autophagy flux, and the often incomplete analysis provided by the analysis of a single autophagy marker, or the lack of comparison between the different sections of the diseased liver that form the tumor ecosystem of HCC. Although the cohort of HCC patients examined in this study was limited, we found differences in p62 and LC3-II levels between tumors from different patients and between non-tumor and tumor parts of the same patient, suggesting diversity and variability in autophagy flux in HCC.
Implementing a therapy based on autophagy modulation in a cohort of cancer patients with such heterogeneous autophagic flux can be considered challenging, not to mention the likely adverse effects of autophagy modulators given the physiological role of autophagy in all organs [Citation66] and in immune responses [Citation71,Citation72]. Cancer cells are associated with changes in the lysosomal compartment, such as changes in lysosomal membrane stability and an increased repertoire of hydrolases, making them more susceptible to LMP-induced cell death [Citation73–77]. This could explain the greater sensitivity of liver cancer cell lines to cell death induced by combined activation and blockade of autophagy in late stages, compared with the lack of sensitivity of normal human hepatocytes, as treated cancer cells have been shown to undergo LMP. The accumulation of autophagy vacuoles, which in our case are autolysosomes, associated with death induction in cells treated with the NaB/CQ combination, has been shown to occur during chemotherapeutic treatments or spontaneously in degenerative neurological diseases that lead neurons with autophagosome accumulation to cell death [Citation78]. It has been suggested that deficient autophagy and the accumulation of autophagy vacuoles over a long period led to an energy crisis in the cells, which in turn triggered positive feedback with increased autophagosome biosynthesis, amplified autophagosome accumulation and cell death [Citation64]. Our hypothesis that the combination could have an antitumor effect in a significant number of patients, irrespective of the type of autophagy flux, is based on the assumption that the combination could ultimately lead to the accumulation of autophagic vesicles in many cases. In a tumor with normal autophagy flux, NaB will increase autophagosome formation, after which CQ will block fusion between autophagosomes and lysosomes, leading to the accumulation of autophagic vesicles. In a tumor where autophagy flux is activated, CQ blocks fusion between autophagosomes and lysosomes, leading to their accumulation. In a tumor where autophagy is blocked at the stage of fusion between autophagosomes and lysosomes or at the stage of autolysosome degradation, NaB will further activate autophagy amplifying the levels of accumulated autophagosomes/autolysosomes. As for HCC tumors where the fux is completely inhibited during initiation, to our knowledge there is no evidence in the context of HCC of alterations in the mutational landscape of autophagy genes, or of mutation or loss of the BECN1 gene in humans, which would allow such a physiopathological situation to be envisaged.
The rationale for testing NaB/CQ against HCC is safety and selectivity. Chloroquine is a lysosomotrophic antimalarial that has been repurposed for cancer treatment alone or in combination with anticancer therapies [Citation79]. The anti-tumor effect of chloroquine is mainly linked to its autophagy-inhibiting activity and induction of lysosomal membrane permeability [Citation35,Citation80]. Among the short-chain fatty acids (SCFAs), butyrate has several biological functions, including being a source of energy, inducing autophagy in several cell lines, including hepatocellular carcinoma cells, being an HDAC inhibitor and having antitumor activity [Citation81].The gut microbiota or its products (including SCFAs, naturally present in our bodies) can pass from the intestine to the liver under pathological conditions and, to a lesser extent, under normal conditions, via the hepatic portal vein [Citation82], making it possible to target liver diseases, including cancer, by modulating the dysbiotic gut microbiota of cancer patients using SCFA-producing probiotics and special diets. The idea is to exploit butyrate, a product derived from the microbiota, as an autophagy activator (not to mention the other functional benefits it could bring) to increase the sensitivity of hepatocellular cancer cells to treatment with chloroquine, an autophagy inhibitor. Further studies will need to assess the safety and anti-tumor response of this combinatorial approach in preclinical studies on vivo models of HCC before moving on to the clinical stage.
The question of whether CQ blocks autophagy by preventing fusion between autophagosomes and lysosomes, and hence autophagosome accumulation, or by preventing the final stage of cargo digestion, and hence autolysosome accumulation, remains unresolved as results differ between studies [Citation61,Citation62]. In our study, CQ acts by inhibiting fusion between autophagosomes and lysosomes, leading to autophagosome accumulation, as shown by the colocalization of RFP and GFP signals in liver cancer cells stably expressing RGP/GFP-LC3 reporter and the absence of colocalization of the autophagosomal marker LC3 and the lysosomal marker LAMP-1 in cells treated with CQ or NaB/CQ. With regard to the effect of CQ on lysosomal pH, which varies from study to study [Citation80,Citation83], our results suggest that CQ blocks autophagy without increasing lysosomal pH.
In conclusion, we report here a method with a dual effect on autophagy initiation and degradation to preferentially and efficiently destroy HCC cancer cells. Given that HCC is an aggressive cancer with limited effective therapeutic options, our results suggest an additional promising avenue for pharmacological development against HCC.
Materials and methods
Tissue sample, cell culture and reagents
HCC tissue samples were collected from patients with hepatocellular carcinoma (HCC) operated on at the hepatobiliary centre, Paul-Brousse University Hospital. They were obtained after surgical resection or from liver explants during transplantation. All patients provided signed informed consent. The study was reviewed and approved by the Institutional Review Board (IRB) of the French Institute for Medical Research and Health INSERM (IRB number 11-047). The tissue biobank of the AP-HP Paris-Saclay Biological Resources Centre (BB-0033-00089) supplied all fresh, frozen, formalin-fixed and paraffin-embedded liver samples. Normal primary human hepatocytes were obtained from fresh hepatic resection specimens of patients operated on for liver metastases of colorectal cancer managed at the Paul-Brousse Hospital, Hepatobiliary Center, Villejuif. Cells were cultured in William E + GlutaMax medium (Gibco, ThermoFisher scientific, 32551-020/32551-087) supplemented with 10% fetal bovine serum (FBS) (Serana, S-FBSP-EU-015). Huh-7, PLC/PRF/5 and CCLP-1 human cell lines derived from primary liver cancer were cultured in Dulbecco’s modified eagle medium (DMEM)-Glutamax (4.5g/L glucose) (Gibco, ThermoFisher scientific, 61965-026/61965-059) supplemented with 10% FBS. HepG2 cells were cultured in DMEM (Gibco, ThermoFisher scientific, 11966-025) supplemented with 10% FBS and 1% sodium pyruvate. Hep3B and CCSW-1 cells were cultured in DMEM-Glutamax (4.5g/L glucose) supplemented with 10% FBS, 1% sodium pyruvate and 1% non-essential amino acids. All cells were grown at 37°C in an atmosphere containing 5% CO2. Sodium butyrate (NaB) (#303410), chloroquine diphosphate (CQ) salt (#C6628), spautin-1 (#SML0440) and reduced left glutathione (#G4251) were purchased from Sigma Aldrich.
Cell treatment and dose-response
Cells were seeded in 6-well plates (175,000 cells/well in 2.5 mL medium) or 24-well plates (35,000 cells/well in 500µL medium). Concentrations of 4mM NaB and 10 or 20µM CQ were chosen on the basis of the results of cell death induction time and dose-response experiments. Concentrations inducing around 20% cell death were selected. The NaB and CQ concentrations we used were 2mM and 5µM for Hep3B, 1mM and 20µM for HepG2, 2mM and 10µM for CC-SW-1, 2mM and 20µM for PLC/PRF/5 and CCLP-1. NaB and CQ were dissolved in DMEM prior to use. The 5mM concentration of Spautin-1 was chosen after evaluation of time- and concentration-dependent cytotoxicity. Spautin-1 was dissolved in DMSO (Sigma Aldrich, D8418) and the working solution was prepared in DMEM medium and added twice, the first time with treatment and the second time 3h after treatment. The 5mM concentration of reduced left glutathione was chosen after evaluation of time- and concentration-dependent cytotoxicity. Reduced left glutathione was dissolved in sterile water before use and added 3 times, 1h before treatment, 24h and 48h after treatment. For cell lines other than Huh-7 cells, NaB and CQ concentrations were chosen according to cell sensitivity to single treatment, so that when single treatment induced a high percentage of cell death, the concentration was decreased by ½ or ¼ with a threshold of less than 40% cell death in single treatment.
Combination index
The combination index (CI) was calculated according to the following formula: CI= (D)1/(Dx)1+ (D)2/(Dx) where (D)1 and (D)2 are the concentrations of the combination that kill x% of cells, and (Dx)1 and (Dx)2 are the concentrations of each product alone that kill x% of cells. In our study, we measured the CI at 50% cell death. The effect of the products is defined as synergistic when CI < 1, an additive effect when CI = 1 and an antagonistic effect when CI >1 [Citation12]. The concentration of each product alone that induced 50% cell death was calculated using concentration- percentage cell death curves. The concentrations of the combination of products that induce 50% cell death are the concentrations used in our study.
Cell viability assessment
After the various treatment, cells were washed with PBS, then fixed and stained with crystal violet solution (0.5% crystal violet, 30% ethanol and 3% of paraformaldehyde) for 5 min at room temperature. The cells were then washed with water and left overnight to evaporate. Next, crystal violet was resolved in 1% SDS and absorbance measured at 560nm using a microplate reader. The stained cells were then photographed under an optical microscope using a camera.
Cell death assessment
After the cells had been exposed or not to the various drugs, they were collected and stained with propidium iodide (PI) (Sigma Aldrich, P4864) then analyzed by flow cytometry via the FL3 channel detector, followed by data processing using BD Accuri C6 software. The cell population to be analyzed was delimited after removing cell debris and aggregates in the forward side scatter (FSC) and side scatter (SSC) light plots. PI-positive cells were defined as those representing 5-10% of Huh-7 cells, 9-14% of Hep 3B cells, 8-15% of Hep G2 cells, 7-13% of PLC/PRF/5 cells, 7-16% of CC-SW-1 cells and 7-10.5% of CCLP-1 cells under untreated conditions. Cell apoptosis was analyzed using a PI/Annexin V kit (Invitrogen Thermofisher Scientific, V13242). Once labeled with propidium iodide and Annexin V, they were analyzed by flow cytometry via the FL-1 and FL3 channel detector. Dead HuH7 cells were defined as those representing 5% in untreated conditions.
Establishment of a Huh-7 cell line with stable expression of the RFP/GFP-LC3 reporter protein
Huh-7 cells and viral particles were mixed with equivalent volume (500µL+500µL for one well of a 6-well plate) to obtain a cell suspension containing 50,000 cells/mL and 500,000 viral particles. Polybrene was added at a final concentration of 10µg/mL. After serial passages and cell number expansion, the transfected cells were used for the experiments. The lv-RFP/GFP-LC3 construct was donated by Dr Jean-Emmanuel Sarry’s lab /CRCT in Toulouse and the recombinant virus was produced by the Pôle Technologique du Centre de Recherche en Cancérologie in Toulouse.
Reactive oxygen species quantification
Cells were stained with 500nM CellROX® Green reagent (Invitrogen ThermoFisher Scientific, C10492) for 1h at 37°C, 5% CO2 followed by flow cytometry analysis via the FL-1 channel detector, then data were processed using BD Accuri C6 software. The population of cells of interest to be analyzed was selected after removing cell debris and cell aggregates from the FSC and SSC light plots. From the selected cell population, another gate named HIGH was set to the 7% of cells most strongly fluorescing in the FL1 channel under untreated conditions for Huh-7 cells.
Lysosomal pH
Cells were stained with 50nM lysosomal staining reagent red (LSR) (Abcam, ab112137) for 10 min at 37°C, 5% CO2. Cells were then collected and analyzed by flow cytometry using an FL-2 channel detector, and data processed using BD Accuri C6 software. LSR fluorescence intensity was decomposed into low (L-LSR), moderate (M-LSR) and high (H-LSR). The LSR fluorescence intensity of the majority (94.3%) of untreated control cells was graded as moderate.
Western blot
Whole-cell lysates were made in ice-cold lysis buffer supplemented with phosphatase and protease inhibitors (50mM Tris-Cl pH7.4, 150 mM NaCl, 1% NP40, 0.25% sodium deoxycholate, 1 mmoL/L Na3VO4, 20 mmoL/L NaF, 1 μg/mL aprotinin, 10 μg/mL pepstatin, 10 μg/mL leupeptin, 1 μM phenylmethylsulfonyl fluoride). Protein extracts from HCC patient tissues were prepared from frozen tumor and non-tumor samples. After addition of the same lysis buffer as that used for the cell lines, the tissues were mechanically homogenized using a Tissuelyser II (Qiagen®). Protein quantification was performed using the Bio-Rad protein assay kit and bovine serum albumin. 30-60µg of protein was resolved in a 7%-12%-15% polyacrylamide gel in Tris-Glycine SDS buffer (Invitrogen), before being electrotransferred onto nitrocellulose membranes (Whatman, Dominique Dutscher). Membranes were blocked in 5% non-fat milk in 0.1% Tween 20 Tris-buffered saline for 1h and probed with primary antibodies [LC3 (rabbit, Sigma-Aldrich, L7543); p62 (guinea pig, Progen, GP62); β-actin (Cell Signaling Technology, D6A8); PARP (rabbit, Cell Signaling Technology, #9542); cleaved caspase-3 (Asp175) (rabbit, Cell Signaling Technology, #9661); cathepsin D (mouse, Abcam, ab6313); TFEB (rabbit, Abcam, ab245350)] either for 1h or overnight, followed by a secondary antibody, bound to horseradish peroxidase, for 1h after washing. Immunoreactive bands were detected with ECL plus chemiluminescence reagent (ThermoFisher Scientific, 32432). Densitometric analysis was performed using ImageJ software.
Immunofluorescence
Cells were fixed/permeabilized in a solution of methanol 50% (v/v) and acetone 50% (v/v) previously cooled for 10 min at -20°C. Slides were then washed with PBS and incubated overnight at 4°C with the primary antibody [LC3 (rabbit, Sigma-Aldrich, L7543); LAMP-1(mouse, Cell Signaling Technology, D4O1S); cathepsin D (mouse, Abcam, ab6313) diluted in PBS. Slides were then washed in PBS and incubated with secondary antibody (goat anti-rabbit Alexa Fluor 555, Invitrogen, A32732; goat anti-mouse Alexa 488, Invitrogen molecular probes, A11029; donkey anti-mouse Alexa 555, Invitrogen ThermoFisher, A31570) diluted in PBS for 1h at 37°C. Slides were washed with PBS and stained with Hoechst 33342 (Invitrogen ThermoFisher, H3570) diluted in fluoromount-G (Southern Biotech, #H0120-V110). Slides were imaged under a confocal microscope using Leica software. Quantitative analysis was performed using ImageJ software.
Immunohistochemistry
Formalin-fixed, paraffin-embedded liver sections (4 µm) were dewaxed in xylene and rehydrated through graded alcohols. Tissue sections were pressure cooked in 10 mM citrate buffer pH 6 for 10 min, incubated with 3% H2O2 for 20 min to block endogenous peroxidase, and then incubated with an anti-p62 antibody (Abcam, ab56416). Secondary anti-mouse immunoglobulin G–horseradish peroxidase (HRP) was used according to the manufacturer’s instructions (DAKO, Glostrup, Denmark). Sections were counterstained with haematoxylin (Sigma) before mounting on coverslips.
Small RNA interference
Cells were cultured for 24 hours and then transfected with CTRL siRNA or the combination of Atg7 and Beclin-1 siRNA at a concentration of 2µM using the VIROMER® BLUE kit (Viromer Transfection). Cells were then treated with the combination of NaB and CQ 24 hours after transfection.
Cell fractionation
Cells were collected and washed twice in ice-cold extraction buffer (210 mM mannitol, 70 mM sucrose, 1 mM EDTA, 20 mM Hepes, pH 7.5) supplemented with 100 mM PMSF and protease inhibitors (Roche Diagnostics). Cells were then disrupted in extraction buffer by passing the sample 10 times through a G27 needle. After centrifugation at 1,000 g for 5 min at 4 °C, supernatants were collected and centrifuged at 20,800 g for 1h at 4 °C. The supernatant (cytosolic fraction) was collected and the pellet (lysosomal fraction) lysed in the same lysis buffer as for the Western blot procedure.
Quantitative real-time PCR
Total RNA was isolated following the TRIZOL-Chloroform RNA extraction protocol and purified using the TURBO DNA-free kit (Invitrogen ThermoFisher Scientific, AM1907) by DNase treatment. RNA was quantified using the NanoDrop instrument (Thermo Scientific). cDNA was synthesized using the RevertAid RT kit (Thermo Scientific, K1691) in accordance with the manufacturer’s instructions. cDNA was amplified by PCR using Faststart Essential DNA Green Master (Roche) according to the manufacturer’s instructions. Reactions were performed on a LightCycler 96 machine (Roche) and transcript levels were quantified using the delta delta Ct method using GAPDH as an internal control. The fold change was calculated relative to independent control untreated cells. The fold change was calculated relative to the untreated cells of the independent control. The primer sets used for PCR amplification are listed in Table S1.
Statistical analysis
Results are presented as means ± SEM. Differences between two sample groups were tested using Student’s one-tailed t-test or the Wilcoxon test. Differences between more than two sample groups were tested by ANOVA followed by Tukey’s test after comparison when conditions of normality were met.P values < 0.05 were statistically significant
Supplemental Material
Download Zip (10.8 KB)Suppl Fig 3.tif
Download TIFF Image (22.9 KB)Suppl Fig 1.tif
Download TIFF Image (23.9 KB)Suppl Fig 2.tif
Download TIFF Image (23.3 KB)Acknowledgements
The authors warmly thank Patrice Codogno for his valuable comments and fruitful discussions.
Disclosure statement
The authors declare no conflict of interest was reported by the author(s).
Supplementary Material
Supplemental data for this article can be accessed online at https://doi.org/10.1080/27694127.2024.2326241
Additional information
Funding
References
- Sung H, Ferlay J, Siegel RL, et al. Global cancer statistics 2020: globocan estimates of incidence and mortality worldwide for 36 cancers in 185 countries. CA: A Cancer Journal for Clinicians. 2021;71(3):209–29.
- Yang JD, Hainaut P, Gores GJ, et al A global view of hepatocellular carcinoma: trends, risk, prevention and management. NRGH. 2019 Oct;16(10):589–604.
- Wertheim JA, Petrowsky H, Saab S, Kupiec-Weglinski JW, Busuttil RW. Major Challenges Limiting Liver Transplantation in the United States. Am J Transplant. 2011 Sep;11(9):1773–84.
- Llovet JM, Montal R, Sia D, Finn RS. Molecular therapies and precision medicine for hepatocellular carcinoma. Nature Reviews Clinical Oncology. 2018 Oct;15(10):599–616.
- Calderaro J, Ziol M, Paradis V, et al. Molecular and histological correlations in liver cancer. J Hepatol. 2019 Sep;71(3):616–30.
- Uchiyama Y, Shibata M, Koike M, et al. Autophagy–physiology and pathophysiology. Histochem Cell Biol. 2008 Apr;129(4):407–20.
- Hamaï A, Codogno P. New Targets for Acetylation in Autophagy. Sci Signal. 2012 Jul 3;5(231):pe29–pe29.
- Lee YJ, Jang BK. The Role of Autophagy in Hepatocellular Carcinoma. Int J Mol Sci. 2015 Nov 6;16(11):26629–43.
- Yazdani HO, Huang H, Tsung A. Autophagy: Dual Response in the Development of Hepatocellular Carcinoma. Cells. 2019 Jan 28;8(2):91.
- Liu L, Liao JZ, He XX, et al. The role of autophagy in hepatocellular carcinoma: friend or foe. Oncotarget. 2017 Apr 18;8(34):57707–22.
- Aunan JR, Cho WC, Søreide K. The Biology of Aging and Cancer: A Brief Overview of Shared and Divergent Molecular Hallmarks. Aging Dis. 2017 Oct;8(5):628–42.
- Singh SS, Vats S, Chia AYQ, et al. Dual role of autophagy in hallmarks of cancer. Oncogene. 2018 Mar;37(9):1142–58.
- Yun CW, Lee SH. The Roles of Autophagy in Cancer. Int J Mol Sci. 2018 Nov 5;19(11):3466.
- Nazio F, Bordi M, Cianfanelli V, et al. F. Autophagy and cancer stem cells: molecular mechanisms and therapeutic applications. Cell Death Differ. 2019 Mar;26(4):690–702.
- Ueno T, Komatsu M. Autophagy in the liver: functions in health and disease. Nat Rev Gastroenterol Hepatol. 2017 Mar;14(3):170–84.
- Inami Y, Waguri S, Sakamoto A, et al. Persistent activation of Nrf2 through p62 in hepatocellular carcinoma cells. J Cell Biol. 2011 Apr 18;193(2):275–84.
- Denk H, Stumptner C, Fuchsbichler A, et al. Are the Mallory bodies and intracellular hyaline bodies in neoplastic and non-neoplastic hepatocytes related? J Pathol. 2006 Apr;208(5):653–61.
- Umemura A, He F, Taniguchi K, et al. p62, Upregulated during Preneoplasia, Induces Hepatocellular Carcinogenesis by Maintaining Survival of Stressed HCC-Initiating Cells. Cancer Cell. 2016 13;29(6):935–48.
- Lin CW, Chen YS, Lin CC, et al. Autophagy-related gene LC3 expression in tumor and liver microenvironments significantly predicts recurrence of hepatocellular carcinoma after surgical resection. CTG. 2018 Jun;9(6):e166.
- Chao X, Wang S, Fulte S, et al. Hepatocytic p62 suppresses ductular reaction and tumorigenesis in mouse livers with mTORC1 activation and defective autophagy. J Hepatol. 2022 Mar;76(3):639–51.
- Chang Y, Yan W, He X, et al. miR-375 Inhibits Autophagy and Reduces Viability of Hepatocellular Carcinoma Cells Under Hypoxic Conditions. Gastroenterology. 2012 Jul 1;143(1):177–187.e8.
- Sun K, Guo X l, Zhao Q D et al. Paradoxical role of autophagy in the dysplastic and tumor-forming stages of hepatocarcinoma development in rats. Cell Death Dis. 2013 Feb;4(2):e501.
- Hu T, Li P, Luo Z, et al. Chloroquine inhibits hepatocellular carcinoma cell growth in vitro and in vivo. Oncol Rep. 2016 Jan;35(1):43–9.
- Ding ZB, Hui B, Shi YH, Zhou J, Peng YF, Gu CY, et al. Autophagy Activation in Hepatocellular Carcinoma Contributes to the Tolerance of Oxaliplatin via Reactive Oxygen Species Modulation. Clin Cancer Res. 2011 Oct 1;17(19):6229–38.
- Chen LH, Loong CC, Su TL, et al. Autophagy inhibition enhances apoptosis triggered by BO-1051, an N-mustard derivative, and involves the ATM signaling pathway. Biochem Pharmacol. 2011 Mar 1;81(5):594–605.
- Hui B, Shi YH, Ding ZB, et al. Proteasome inhibitor interacts synergistically with autophagy inhibitor to suppress proliferation and induce apoptosis in hepatocellular carcinoma. Cancer. 2012;118(22):5560–71.
- Du H, Yang W, Chen L, et al. Role of autophagy in resistance to oxaliplatin in hepatocellular carcinoma cells. Oncol Rep. 2012 Jan;27(1):143–50.
- Shimizu S, Takehara T, Hikita H, et al. Inhibition of autophagy potentiates the antitumor effect of the multikinase inhibitor sorafenib in hepatocellular carcinoma. IJC. 2012;131(3):548–57.
- Guo X L, Li D, Hu F, et al. Targeting autophagy potentiates chemotherapy-induced apoptosis and proliferation inhibition in hepatocarcinoma cells. CL. 2012 Jul 28;320(2):171–9.
- Guo X L, Li D, Sun K, et al. Inhibition of autophagy enhances anticancer effects of bevacizumab in hepatocarcinoma. J Mol Med (Berl). 2013 Apr;91(4):473–83.
- Gao L, Song J R, Zhang J W, et al. Chloroquine Promotes the Anticancer Effect of TACE in a Rabbit VX2 Liver Tumor Model. Int J Biol Sci. 2013 Mar 28;9(4):322–30.
- Chang Z, Shi G, Jin J, et al. Dual PI3K/mTOR inhibitor NVP-BEZ235-induced apoptosis of hepatocellular carcinoma cell lines is enhanced by inhibitors of autophagy. Int J Mol Med. 2013 Jun;31(6):1449–56.
- Yuan H, Li AJ, Ma SL, et al. Inhibition of autophagy significantly enhances combination therapy with sorafenib and HDAC inhibitors for human hepatoma cells. World J Gastroenterol. 2014 May 7;20(17):4953–62.
- Tong Y, Huang H, Pan H. Inhibition of MEK/ERK activation attenuates autophagy and potentiates pemetrexed-induced activity against HepG2 hepatocellular carcinoma cells. Biochem Biophys Res Commun. 2015 Jan 2;456(1):86–91.
- Zhang N, Xie H, Lu W, et.al Chloroquine sensitizes hepatocellular carcinoma cells to chemotherapy via blocking autophagy and promoting mitochondrial dysfunction. Int J Clin Exp Pathol. 2017 Sep 1;10(9):10056–65.
- Pérez-Hernández M, Arias A, Martínez-García D, et.al Targeting Autophagy for Cancer Treatment and Tumor Chemosensitization. Cancers (Basel). 2019 Oct 19;11(10):1599.
- Gao M, Yeh PY, Lu YS, et al. OSU-03012, a novel celecoxib derivative, induces reactive oxygen species-related autophagy in hepatocellular carcinoma. Cancer Res. 2008 Nov 15;68(22):9348–57.
- Liu YL, Yang PM, Shun CT, et al. Autophagy potentiates the anti-cancer effects of the histone deacetylase inhibitors in hepatocellular carcinoma. Autophagy. 2010 Nov;6(8):1057–65.
- Wang N, Pan W, Zhu M, et al. Fangchinoline induces autophagic cell death via p53/sestrin2/AMPK signalling in human hepatocellular carcinoma cells. Br J Pharmacol. 2011 Sep;164(2b):731–42.
- Li P, Du Q, Cao Z, et al. Interferon-gamma induces autophagy with growth inhibition and cell death in human hepatocellular carcinoma (HCC) cells through interferon-regulatory factor-1 (IRF-1). Cancer Lett. 2012 Jan 28;314(2):213–22.
- Yu HC, Lin CS, Tai WT, et al. Nilotinib Induces Autophagy in Hepatocellular Carcinoma through AMPK Activation. J Biol Chem. 2013 Jun 21;288(25):18249–59.
- Hu M, Huang H, Zhao R, et al. AZD8055 induces cell death associated with autophagy and activation of AMPK in hepatocellular carcinoma. Oncol Rep. 2014 Feb;31(2):649–56.
- Chen YJ, Chi CW, Su WC, et al. Lapatinib induces autophagic cell death and inhibits growth of human hepatocellular carcinoma. Oncotarget. 2014 Jul 15;5(13):4845–54.
- Shi Y, Song Q, Hu D, et al. Oleanolic acid induced autophagic cell death in hepatocellular carcinoma cells via PI3K/Akt/mTOR and ROS-dependent pathway. Korean J Physiol Pharmacol. 2016 May;20(3):237–43.
- Han B, Yu YQ, Yang QL, et al. Kaempferol induces autophagic cell death of hepatocellular carcinoma cells via activating AMPK signaling. Oncotarget. 2017 Sep 16;8(49):86227–39.
- Leu YS, Chen YJ, Chen CC, et al. Induction of Autophagic Death of Human Hepatocellular Carcinoma Cells by Armillaridin from Armillaria mellea. Am J Chin Med. 2019;47(6):1365–80.
- Kim SY, Hwangbo H, Kim MY, et al. Coptisine induces autophagic cell death through down-regulation of PI3K/Akt/mTOR signaling pathway and up-regulation of ROS-mediated mitochondrial dysfunction in hepatocellular carcinoma Hep3B cells. Arch Biochem Biophys. 2021 Jan 15;697:108688.
- Chen CL, Tseng YW, Wu JC, et al. Suppression of hepatocellular carcinoma by baculovirus-mediated expression of long non-coding RNA PTENP1 and MicroRNA regulation. Biomaterials. 2015 Mar 1;44:71–81.
- Go DH, Lee YG, Lee DH, et al. 3-Decylcatechol induces autophagy-mediated cell death through the IRE1α/JNK/p62 in hepatocellular carcinoma cells. Oncotarget. 2017 May 9;8(35):58790–800.
- Yao C, Liu BB, Qian XD, et al. Crocin induces autophagic apoptosis in hepatocellular carcinoma by inhibiting Akt/mTOR activity. Onco Targets Ther. 2018;11:2017–28.
- Hu P, Cheng B, He Y, et al. Autophagy suppresses proliferation of HepG2 cells via inhibiting glypican-3/wnt/β-catenin signaling. Onco Targets Ther. 2018 Jan 4;11:193–200.
- Pan H, Wang Y, Na K, et al. Autophagic flux disruption contributes to Ganoderma lucidum polysaccharide-induced apoptosis in human colorectal cancer cells via MAPK/ERK activation. Cell Death Dis. 2019 Jun 11;10(6):456.
- Degtyarev M, De Mazière A, Orr C, et al. Akt inhibition promotes autophagy and sensitizes PTEN-null tumors to lysosomotropic agents. J Cell Biol. 2008 Oct 6;183(1):101–16.
- Boya P, González-Polo RA, Casares N, et al. Inhibition of Macroautophagy Triggers Apoptosis. Mol Cell Biol. 2005 Feb;25(3):1025–40.
- Kanzawa T, Germano IM, Komata T, Ito H, Kondo Y, Kondo S. Role of autophagy in temozolomide-induced cytotoxicity for malignant glioma cells. Cell Death Differ. 2004 Apr;11(4):448–57.
- Gonzalez P, Mader I, Tchoghandjian A, et al. Impairment of lysosomal integrity by B10, a glycosylated derivative of betulinic acid, leads to lysosomal cell death and converts autophagy into a detrimental process. Cell Death Differ. 2012 Aug;19(8):1337–46.
- Humbert M, Morán M, de la Cruz-Ojeda P, et al. Assessing Autophagy in Archived Tissue or How to Capture Autophagic Flux from a Tissue Snapshot. Biology (Basel). 2020 Mar 21;9(3):59.
- Pant K, Saraya A, Venugopal SK. Oxidative stress plays a key role in butyrate-mediated autophagy via Akt/mTOR pathway in hepatoma cells. CBI. 2017 Aug 1;273:99–106.
- Ren Z, Li A, Jiang J, et al. Gut microbiome analysis as a tool towards targeted non-invasive biomarkers for early hepatocellular carcinoma. Gut. 2019 Jun;68(6):1014–23.
- Barth S, Glick D, Macleod KF. Autophagy: assays and artifacts. J Pathol. 2010 Jun;221(2):117–24.
- Mauthe M, Orhon I, Rocchi C, et al. Chloroquine inhibits autophagic flux by decreasing autophagosome-lysosome fusion. Autophagy. 2018 Jul 20;14(8):1435–55.
- Kucharewicz K, Dudkowska M, Zawadzka A, et al. Simultaneous induction and blockade of autophagy by a single agent. CCD. 2018 Mar 2;9(3):1–15.
- Mei L, Chen Y, Wang Z, et al. Synergistic anti-tumour effects of tetrandrine and chloroquine combination therapy in human cancer: a potential antagonistic role for p21. Br J Pharmacol. 2015 May;172(9):2232–45.
- Button RW, Roberts SL, Willis TL, et al. Accumulation of autophagosomes confers cytotoxicity. J Biol Chem. 2017 Aug 18;292(33):13599–614.
- Wang F, Gómez‐Sintes R, Boya P. Lysosomal membrane permeabilization and cell death. Traffic. 2018;19(12):918–31.
- Allaire M, Rautou PE, Codogno P, et al. Autophagy in liver diseases: Time for translation? JOH. 2019 May 1;70(5):985–98.
- Takamura A, Komatsu M, Hara T, et al. Autophagy-deficient mice develop multiple liver tumors. Genes Dev. 2011 Apr 15;25(8):795–800.
- Ni HM, Woolbright BL, Williams J, et al. Nrf2 Promotes the Development of Fibrosis and Tumorigenesis in Mice with Defective Hepatic Autophagy. J Hepatol. 2014 Sep;61(3):617–25.
- Chao X, Ni HM, Ding WX. An unexpected tumor suppressor role of SQSTM1/p62 in liver tumorigenesis. Autophagy. 18(2):459–61.
- Yang Y, Wang Q, Song D, et al. Lysosomal dysfunction and autophagy blockade contribute to autophagy-related cancer suppressing peptide-induced cytotoxic death of cervical cancer cells through the AMPK/mTOR pathway. JECCR. 2020 Sep 22;39(1):197.
- Jang YJ, Kim JH, Byun S. Modulation of Autophagy for Controlling Immunity. Cells. 2019 Feb 9;8(2):138.
- Li X, Wang ZG, Zhu H, et al. Inducing Autophagy and Blocking Autophagic Flux via a Virus-Mimicking Nanodrug for Cancer Therapy. Nano Lett. 2022 Nov 23;22(22):9163–73.
- Appelqvist H, Wäster P, Kågedal K, et al. The lysosome: from waste bag to potential therapeutic target. J Mol Cell Biol. 2013 Aug 1;5(4):214–26.
- Ono K, Kim SO, Han J. Susceptibility of Lysosomes to Rupture Is a Determinant for Plasma Membrane Disruption in Tumor Necrosis Factor Alpha-Induced Cell Death. Mol Cell Biol. 2003 Jan;23(2):665–76.
- Domagala A, Fidyt K, Bobrowicz M, et al. Typical and Atypical Inducers of Lysosomal Cell Death: A Promising Anticancer Strategy. IJMS. 2018 Aug;19(8):2256.
- Fehrenbacher N, Gyrd-Hansen M, Poulsen B, et al. Sensitization to the Lysosomal Cell Death Pathway upon Immortalization and Transformation. Cancer Res. 2004 Aug 1;64(15):5301–10.
- Circu M, Cardelli J, Barr M, et al. Modulating lysosomal function through lysosome membrane permeabilization or autophagy suppression restores sensitivity to cisplatin in refractory non-small-cell lung cancer cells. Plos One. 2017 Sep 25;12(9):e0184922.
- Mora R, Abschuetz A, Kees T, et al. TNF-alpha- and TRAIL-resistant glioma cells undergo autophagy-dependent cell death induced by activated microglia. Glia. 2009 Apr 1;57(5):561–81.
- Solomon VR, Lee H. Chloroquine and its analogs: a new promise of an old drug for effective and safe cancer therapies. Eur J Pharmacol. 2009 Dec 25;625(1–3):220–33.
- Chen HE, Lin JF, Tsai TF, et al. Chloroquine induces lysosomal membrane permeability mediated apoptotic cell death in bladder cancer cells. US. 2016 Jun 1;27(2, Supplement 1):S5.
- Jan G, Belzacq AS, Haouzi D, et al. Propionibacteria induce apoptosis of colorectal carcinoma cells via short-chain fatty acids acting on mitochondria. CDD. 2002 Feb;9(2):179–88.
- Chassaing B, Etienne-Mesmin L, Gewirtz AT. Microbiota-Liver Axis in Hepatic Disease. Hepatology. 2014 Jan;59(1):328–39.
- Iwai-Kanai E, Yuan H, Huang C, et al. A Method to Measure Cardiac Autophagic Flux in vivo. Autophagy. 2008 Apr;4(3):322–9.