
 ?Mathematical formulae have been encoded as MathML and are displayed in this HTML version using MathJax in order to improve their display. Uncheck the box to turn MathJax off. This feature requires Javascript. Click on a formula to zoom.
Abstract
Brain-computer interface (BCI) has received attention from researchers in many research fields as an emerging control technology that translates human thoughts into actions. Existing motor imagery (MI)-based BCI systems can only decode a limited number of neural intentions, thus limiting the scope of BCI applications. We propose a speed imagery (SI)-BCI paradigm, which aims to decode spontaneous SI intentions. Thus, the number of decodable intentions is increased by using the natural continuity of the physical quantity of speed. We further build a synchronous bimodal acquisition system of spontaneous SI intentions, which is capable of acquiring EEG signals and functional near-infrared spectroscopy (fNIRS) signals simultaneously. Specifically, an interpretable bimodal signal registration and attention algorithm, called STformer, is proposed for SI classification, which consists of two parts: 1) a bimodal registration algorithm for signal fusion that improves the tightness of spatio-temporal coupling of EEG and fNIRS signals. 2) a dual-path spatio-temporal feature extraction and global attention network that makes full use of bimodal spatio-temporal features for SI intention classification. Experimental results on two datasets show that the proposed SI-BCI system outperforms state-of-the-art methods in terms of data reliability, classification performance and interpretability.
1. Introduction
Brain-computer interface (BCI) is a modern control technology that allows control of a robotic arm, wheelchair, prosthesis, speller or any other external device by decoding the neural intentions of the human brain into control commands [Citation1–3]. The quality of life of many patients who have lost the ability to communicate or interact with environments has been enhanced through the use of BCI technology [Citation4–7]. Motor imagery (MI)-based BCI, as a typical BCI paradigm, has received widespread attention from researchers because of its advantages of low stimulation to the human body, ease of use and good control quality [Citation8–13]. However, most MI-BCI systems can only decode a limited number of motor imagery intentions such as hand movements and foot movements [Citation14–18], thus have limitations in decoding multiple limb motion and cannot generate complex control commands. How to increase the variety of motion recognition remains a major challenge in the MI-BCI research field.
Speed is a naturally continuous physical quantity, by decoding speed imagery (SI) intentions and thus generate more control commands is a potential way to construct continuous BCI systems [Citation19]. Yin et al. initially verified the feasibility of the SI-BCI paradigm by decoding SI intentions using traditional machine learning methods [Citation20]. Fu et al. further explored the state of the brain arousal during the classification of SI intentions [Citation21]. Although researchers have made initial explorations in the field of SI-BCI, these studies are still in the early stage. Moreover, due to the single modality signal acquisition equipment and low decoding accuracy, it cannot meet the requirements of practical BCI applications [Citation22,Citation23]. Therefore, there is an urgent need to study multimodality neural signal acquisition methods and high-accuracy neural decoding algorithms for SI-BCI.
Studies have shown that many modalities of signals can be used to control BCI systems [Citation24–26], among which electroencephalography (EEG) is the most widely used signal modality because of its high temporal resolution and fast response. However, limited by the non-smoothness, poor spatial resolution and low signal-to-noise ratio of EEG signals, EEG-based BCI systems are not very accurate in decoding continuous neural intentions [Citation27–31]. Recently, functional near-infrared spectroscopy (fNIRS) has been shown to be very compatible and complementary to EEG signals because of its high spatial resolution and high tolerance to motion artifacts [Citation32–34]. By simultaneously acquiring EEG and fNIRS signals, the EEG-fNIRS bimodal BCI system has been shown to be a potential solution to the current problem of decoding SI intentions [Citation35,Citation36].
Studies have shown a close correlation between EEG and fNIRS due to neurovascular coupling [Citation37–39]. However, mixing the signals of the two modalities remains a challenge due to the asynchronous temporal response of the bimodal signals and the different recording locations. Most existing work simply combines the signals of the two modalities on the data side or on the feature side [Citation40–42]. For the data side fusion, Chiarelli et al. directly concatenated EEG and fNIRS data and used deep artificial neural networks (DNN) to extract high-level feature representations, obtaining higher classification accuracy than conventional algorithms [Citation43]. For the feature side fusion, features of the EEG and fNIRS signals were extracted separately, and signal features of both modalities were directly concatenated for further decoding. Yin et al. performed score fusion on the extracted handcrafted features, and the fused features were used as the input of support vector machine (SVM) for classification [Citation20]. Shin et al. extracted handcrafted features of EEG and fNIRS signals separately, and adopted linear discriminant analysis (LDA) as a combined classifier for class prediction [Citation35]. Sun et al. proposed a high order polynomial fusion method to concatenate bimodal feature vectors, which improved the classification accuracy of bimodal signals on a public dataset [Citation44].
Recently, a few methods have been proposed to effectively utilize the information of spatio-temporal features carried by EEG and fNIRS data. Nikola et al. proposed a spiking neural network architecture, which created connections between neurons from spatio-temporal feature information [Citation45]. Hosni et al. evaluated that making full use of the spatio-temporal information of BCI tasks can effectively improve the classification performance [Citation46]. Ghonchi et al. used deep learning methods to extract the spatio-temporal features of EEG-fNIRS signals and achieved excellent classification results [Citation47]. Although these simple fusion techniques and spatio-temporal feature extraction methods improve the decoding performance to some extent, they do not fully exploit the complementary advantages of the spatio-temporal features of the bimodal signals and lack sufficient interpretability [Citation48]. Therefore, it is crucial to extract the potential spatio-temporal correlation between the two modalities to maximize the performance of the EEG-fNIRS bimodal BCI system.
In this paper, we design a bimodal acquisition system to simultaneously acquire EEG and fNIRS signals during SI-BCI. Furthermore, we propose a deep learning framework called STformer for bimodal neural signal classification, in which a bimodal registration mechanism is developed to deeply fuse the spatio-temporal features and thus improve the classification performance. The main contributions of our work are as follows,
A bimodal signal registration method is proposed. The method uses the EEG signal as the reference signal and couples the fNIRS signal to the EEG signal by calculating the spatio-temporal correlation (registration matrix) between the two modalities. Compared with the traditional fusion methods, the proposed method can exploit the spatio-temporal structure of the signals and perform signal fusion at a deeper level.
A classification algorithm called STformer is proposed, which consists of a convolutional neural network and a self-attention module. STformer extracts the spatio-temporal features from the registration matrix, and uses trainable factors to dynamically fuse spatio-temporal features, thus improving the overall classification performance.
An EEG-fNIRS bimodal signal acquisition system for SI-BCI is constructed. Using this acquisition system, a SI paradigm with an infrared feedback mechanism is designed and an EEG-fNIRS bimodal dataset is constructed. Compared with existing paradigms, the proposed paradigm can capture spontaneous SI intentions, improve signal quality, and provide ideas for obtaining more complex neural activity signals. Finally, the dataset has been made publicly-available. By releasing the dataset and providing a repository for scientific discussion and collaboration, we aim to maximize its scientific return to the BCI community.
2. Experiment protocol
2.1 EEG-fNIRS bimodal acquisition system
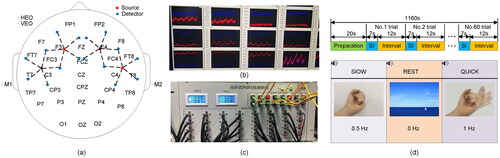
The Neuroscan commercial equipment is used for EEG signal acquisition, while a customized continuous wave fNIRS (CW-fNIRS) system is used for fNIRS signal acquisition. Considering the physical space configuration of EEG and fNIRS as shown in , we design an optoelectronic integrated detection cap to realize the joint synchronous acquisition of EEG-fNIRS signals. The system uses 34 EEG electrodes and 20 fNIRS channels and contains 4 light sources (red) and 16 detectors (blue), with the fNIRS channels located between the light sources and detectors. The fNIRS channels are distributed in the sensory motor area and auxiliary motor area of the scalp, and the EEG electrode arrangement conforms to the 10/20 system. For each sampling trial, a marking signal is generated and sent to the bimodal system to make the EEG and fNIRS signals sampled synchronously. To help subjects complete the assigned SI actions, a feedback interface is employed to supervise the effectiveness of SI, as shown in . The architecture of the CW-fNIRS system follows the commonly used technology [Citation49]. With the support of industrial stabilized power supply, data acquisition card (PXIE-6368) from National Instrument (Texas) is used to control the source, detector and data transmission. The light source and detector emit/receive photons through an optical fiber in contact with the human scalp. The light sources are laser diodes (LD) and two wavelengths (780 nm and 850 nm) are coupled as a group by a fiber splitter. LD light source, developed by QSI (QL78M8S-A), adopts sinusoidal modulation of different frequencies, and digital locking technology of upper computer can suppress noise in signal transmission to a large extent. The detector is an avalanche photodiode (APD) developed by Hamamatsu (C12703-01) with an amplifier gain of V/W, a bandwidth of 100 kHz, and an equivalent noise power of 0.02-0.04 pW. The sampling rate can be set from 1 Hz to 200 Hz. The appearance of the system was displayed in . The other parameters of the CW-fNIRS system can refer to our previous work [Citation50].
Figure 1. EEG-fNIRS bimodal acquisition system. (a) Distribution map of EEG electrodes and fNIRS channels. 34 EEG electrodes are contained. The reference electrodes are represented as M1 and M2. The ophthalmic electrodes are represented as HEO and VEO. There are 20 fNIRS channels, the source is represented in red while the detector is represented in blue, and the dashed line between the detector and the source represents the fNIRS channel. (b) The feedback interface shows the change in blood oxygen levels at each fNIRS channel during the SI tasks, which is used to detect the effectiveness of the SI. (c) The appearance of the CW-fNIRS system. (d) Experimental process. The data of each subject includes 15 blocks, each block has 60 trials, which contains 20 trials of 0.5 Hz left hand clenching, 20 trials of 1 Hz left hand clenching and 20 trials of rest.
2.2. Speed imagery paradigm
The proposed SI-BCI paradigm is shown in . The SI task included three different frequencies of left-hand clenching at 0 Hz, 0.5 Hz and 1 Hz. The experiment consists of a training phase and a testing phase. During the training phase, a subject uses a metronome to practice different frequencies of hand clenching for 15 min. After that, whether the subject is able to master the SI process is assessed by the feedback of the fNIRS signal. We set the threshold value in the acquisition program, and the amplitude exceeding the threshold value at the time of acquisition is considered a significant response. When the fNIRS signal has an obvious hemodynamic response, the subject is confirmed for successful training. Otherwise, the subject is asked to repeat the practice for another 15 min. During the test phase, the subject wears the bimodal signal acquisition cap and sits on a chair in front of the screen to reduce eye and muscle movements. During the whole acquisition process, the subject sits in a dark environment and keeps eyes closed naturally, and completes the corresponding SI under voice commands. The data of each subject includes 15 blocks, and the data composition of each block is shown in . Each block has 60 trials, which contains 20 trials of 0.5 Hz left hand clenching, 20 trials of 1 Hz left hand clenching and 20 trials of rest. Each trial consists of 7 s of SI and 12 s of rest. When the experiment starts, there will be a 0.5 s of voice prompt (three commands of slow, rest and quick appear randomly), and a small white dot will appear in the lower right corner of the screen for time synchronization. After 7 s of SI, the small dot in the lower right corner of the screen disappears, and the subject rests for 12 s.
The pre-processing of the EEG signals includes baseline correction, artifact rejection, filtering, and epoch. These operations are performed using Python MNE package [Citation51]. Specifically, in order to make the subsequent data analysis convenient and reduce the computational cost, the EEG data is downsampled to 256 Hz. Referring to [Citation52], we tried several parameters and found that 0-4 s is optimal in terms of performance and ease of operation. Therefore, we crop out the 0-4 s EEG segments for subsequent analysis. Artifacts such as pulse, heartbeat and 50 Hz power frequency interference are filtered out. Eye movement artifacts are removed using independent component analysis (ICA) [Citation53]. Since the EEG signal information of SI is mainly contained in the -band and
-band [Citation54], we adopt a band-pass filter to extract the signals in the 6-45 Hz frequency band. For the fNIRS signals, we use median filtering and bandpass filtering to remove artifacts such as breathing and heartbeat. Then, the light intensity is converted into blood oxygen concentration based on the modified Lambert-Beer law [Citation55],
(1)
(1)
where
is the extinction coefficient which represents the degree of light absorption by the substance,
represents the corresponding molar concentration of oxyhemoglobin (HbO2) and deoxyhemoglobin (Hb),
is the interoptode distance. The DPF is the differential path length factors at the wavelengths of
The optical densities (OD) are computed as
where
is the incident light intensity and
is the outgoing light intensity. Then the changes of HbO2 and Hb are calculated as
where
is the concentration during SI and
is the base concentration.
In order to reflect the spatio-temporal information of EEG and fNIRS signals more comprehensively, EEG signals and HbO2 concentration will be used for subsequent analysis. The data dimension is where
is the number of trials,
is the number of channels, and
is the number of time points.
3. Methods
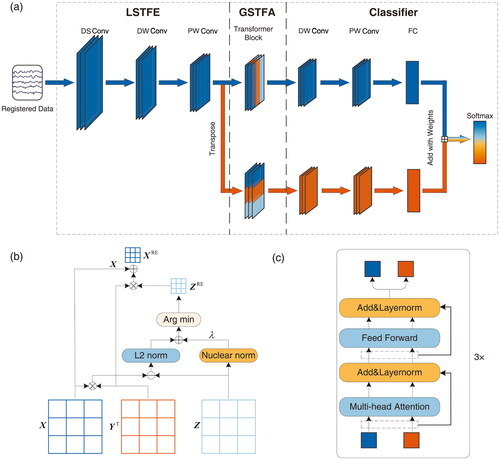
The workflow of the proposed STformer method is shown in . First, we propose a bimodal signal registration algorithm to fuse the EEG and fNIRS signals, as shown in . Then a dual-path spatio-temporal feature extractor is designed to perform convolutional feature extraction in both temporal and spatial dimensions on the three-dimensional registered data. Moreover, the extracted spatio-temporal features are used for global feature attention by an improved Transformer module, as shown in . Finally, these features are fed into an adaptive spatio-temporal feature fusion classifier for SI classification.
Figure 2. A deep learning model for improving classification performance from bimodal data. (a) Architecture of the STformer with spatio-temporal attention modules. The STformer contains a local spatio-temporal feature extraction (LSTFE) module, a global spatio-temporal feature attention (GSTFA) module, and an adaptive spatio-temporal feature fusion classifier. In detail, the LSTFE module contains three convolution blocks (a downsample convolution block termed DS Conv, a deep-wise convolution block termed DW Conv and a pointwise convolution block termed PW Conv). the GSTFA module contains three transformer blocks to get the spatial and temporal features. The classifier consists of a DW Conv, a PW Conv, a fully connected layer (FC) and a softmax, which fuses the spatio-temporal features for classification. The STformer is a dual-path spatio-temporal feature extraction and global attention deep neural network. The upper part shown in blue is called Tformer, which is used to extract temporal features. The lower part shown in red is called Sformer, which is used to extract spatial features and it is obtained by transposing the dimension of the LSTFE output features. (b) Structure of proposed bimodal signal registration algorithm. The algorithm builds a correlation matrix ZRE of the bimodal signals, and the registered data XRE is obtained by coupling EEG (X) and fNIRS (Y) signals according to the spatial channel information reflected by ZRE. (c) Architecture of the GSTFA module in STformer.
3.1 Bimodal signal registration
Information theoretic-based research shows that in multimodal image registration applications, the joint entropy of two images can be used to effectively align image pairs [Citation56,Citation57]. Inspired by these methods, we propose a correlation optimization algorithm to build the correlation matrix of the bimodal signals, and then couple them according to the spatial channel information reflected by the correlation matrix, as shown in .
Let and
represent the EEG data and fNIRS data, respectively,
and
denote their number of channels,
denotes the number of time points. Firstly, the bimodal data are normalized as
(2)
(2)
(3)
(3)
To align the EEG signal and the fNIRS signal in spatial domain, we introduce a registration matrix to describe the channel correlation between the two signals. The registration matrix can be estimated using an L2-norm minimization as
(4)
(4)
where
indicates the L2-norm. To ensure sparse correlation on local channels without affecting continuity on global spatial structure, the nuclear norm is introduced as a regularization term to achieve local correlation and spatial smoothing
(5)
(5)
where
represents the nuclear norm. By constraining the registration matrix to be sparse, it is ensured that the EEG channels and fNIRS channels are locally correlated with each other. In a given registration matrix, the nonzero regions indicate the brain activated area, while the values of non-activated region are nearly zero. The optimization problem in (5) can be solved using the alternating direction method of multipliers (ADMM) algorithm, and more detailed iteration information can be found in [Citation58].
After obtaining the registration matrix we choose the EEG signal as baseline, and couple the fNIRS signal on it using a weighted summation, where the weights are selected according to
as
(6)
(6)
where
and
denote the
-th channel of the EEG and fNIRS signals, respectively.
denote the entry of the
-th row and
-th column of
represents the
-th channel of the EEG signals after registration. It is worth noting that we normalize the columns of
so that the contributions of all fNIRS channels are equal. Moreover, since
is sparse, most values of
in (6) are nearly zero. Therefore, the terms with small correlations can be ignored to boost the registration speed.
3.2 Dual-path spatio-temporal feature extraction and global attention
Previous studies have shown that the simultaneous utilization of spatial and temporal features can effectively improve the classification performance of 2D and 3D images [Citation59]. Inspired by these works, we design STformer, which has two modules, the local spatio-temporal feature extraction (LSTFE) module and the global spatio-temporal feature attention (GSTFA) module. The LSTFE module consists of a downsample convolution block (DS Conv), a deep-wise convolution block (DW Conv) and a point-wise convolution block (PW Conv). The DS Conv only operates in the temporal dimension and does not downsample the channels. It consists of a one-dimensional convolution layer, a batch normalization layer, an ELU activation function, a max pooling layer and a dropout layer. The DW Conv operates in the temporal dimension as well, which consists of a one-dimensional convolution layer, a batch normalization layer, an ELU activation function, a max pooling layer and a dropout layer. The PW Conv operates in the spatial (channel) dimension, which consists of a one-dimensional convolution layer, a batch normalization layer, an ELU activation function and a dropout layer. The parameters of each module are shown in .
Table 1. The parameters of the STformer model.
The input data of the LSTFE module is a two-dimensional registered tensor with size where
represents the number of registration channels, and
represents the number of sampling points. The input data are convolved to obtain local spatio-temporal features, and then the features are output using nonlinear activation functions. Please refer [Citation60] for more details of the convolution operation in the DW Conv and PW Conv. In addition, the convolution operation of the DS Conv is defined as
(7)
(7)
where
is the input of the convolution layer,
is the output of the convolution layer,
represents the weight matrix,
represents the bias matrix, and
represents the nonlinear ELU activation function defined as
(8)
(8)
After extracting the spatio-temporal features, the GSTFA module splits the network into two parallel paths and performs global attention operations on each of these two paths, as shown in . The input of the top path is the extracted feature map, which is the output of the LSTFE module. The input of the bottom path is the transpose of the extracted feature map. Thus, the top path performs global attention operations along the temporal dimension, while the bottom path performs global attention operations along the spatial dimension. For each path, the GSTFA module stacks three transformer blocks [Citation61] to obtain the output features, where each transformer block contains a normalization layer, a multi-head self-attention (MHSA) layer and a feed-forward layer, as shown in .
A MHSA layer uses self-attention mechanism to quantify the inter-dependence within spatio-temporal features. Position encoding is performed using a trainable vector to ensure that the sequence of each input feature has temporal or spatial information to be adaptively aware of neighbouring elements. Multiple heads are used to jointly focus on different information from subspaces at different positions. The output of these heads are concatenated and linearly projected, resulting in the final output. Concretely, the input of the GSTFA module, denoted by is projected to
heads. For each head, three proxies are calculated as
where
and
denote the transformation matrices of the
-th head. After that, each head calculates the attention as
(9)
(9)
Then, representations of all heads are concatenated together and linearly projected to produce the output of the MHSA layer,
(10)
(10)
where
denotes the output projection matrix. The outputs of the MHSA layer are fed into an Add&Norm layer, which adds the input of the multi-head attention layer and then performs layer normalization. After that, the outputs are fed into a feed forward layer with another Add&Norm layer to obtain the final output of the transformer block.
Since the GSTFA module has two paths, the output of the top path is the temporal feature map, denoted by while the output of the bottom path is the spatial feature map, denoted by
3.3 Adaptive spatio-temporal feature fusion classifier
The classifier includes a DW Conv, a PW Conv, and a fully connected (FC) layer. Additionally, the DW Conv and the PW Conv consist of a one-dimensional convolution layer and a dropout layer, respectively. Note that the two blocks have no max pooling layers. The temporal feature map and the spatial feature map are fused as
(11)
(11)
where
and
are trainable variables. Finally, the fused feature
is fed into the Softmax function for classification. The cross-entropy loss function and the Adam optimizer are used for training, and the batch size is 50.
4. Results
4.1 Datasets
In order to assess the effectiveness of the proposed methodology, we performed experiments on two datasets: the first, referred to as the TJU dataset, was constructed using our proposed bimodal acquisition system; and the second, referred to as the BIT dataset, was obtained from a publicly available source.
The subjects in the TJU dataset are 11 right-handed students from Tianjin University (5 males and 6 females, mean age: 24.4 years, standard deviation: 3.1 years, range: 21–30 years). They are in good health and have no history of nervous system diseases. All EEG and fNIRS recording procedures are approved by the China Rehabilitation Research Center Ethics Committee (No. CRRC-IEC-RF-SC-005-01). The SI task includes three different frequencies of 0 Hz, 0.5 Hz and 1 Hz from left-hand clenching. Please refer to the experiment protocol section for detailed description.
The BIT dataset contains 28 right-handed and one left-handed subjects (14 males and 15 females, mean age: 28.5 years, standard deviation: 3.7 years). EEG signals were recorded with a sampling frequency of 1000 Hz from 30 channels, and fNIRS signals were recorded with a sampling frequency of 12.5 Hz from 36 channels (14 sources, 16 detectors). The EEG and fNIRS signals were downsampled to 200 Hz and 10 Hz, respectively. Subjects were required to perform 30 trials for each task: rest, left-hand motor imagery, and right-hand motor imagery. Trials started with a 2-s visual cue task, followed by a 10-second task and a 10-second rest period. A detailed description of the data is provided in [Citation35].
4.2 Comparison criteria
All the experiments in this work were evaluated in a Python 3.8 environment on an Intel(R) Xeon(R) W-3223 3.50-GHz CPU with 64 GB of RAM and a Nvidia GTX 3080Ti GPU. PyTorch was used for designing and testing the proposed network. During the experiments, model training was performed using 10-fold cross-validation for each subject’s data. Specifically, the dataset is split into 10 sets. The model was trained on 9 of the sets, and performance was tested on the rest one set. This was done 10 times so that each set was tested once. The performance on all test sets was generally averaged together to determine the overall performance. The performance of the proposed method was evaluated on accuracy (), true positive rate (
), false positive rate (
), and area under curve (
) metrics. Given the true positives (
), false positives (
), true negatives (
) and false negatives (
), the
and
are defined as,
(12)
(12)
(13)
(13)
(14)
(14)
For classification performance evaluation, the following 4 methods were selected for comparison on the two datasets:
The proposed STformer. The frequency band range is 6–45 Hz and the time range is 0–4 s for analysis. We adopt the mini-batch training approach with a batch size of 50 for 500 epochs.
EEGNet, which is a network with excellent performance in the field of EEG signals analysis [Citation62]. The network uses depth separable convolution to classify EEG data and achieved convincing results.
Deep neural network (DNN) is another widely used deep learning framework in the field of bimodal MI classification [Citation43]. The method uses a multi-layer fully connected network for classification.
fNIRS-guided attention network (FGANet) is a recently proposed bimodal signals classification network [Citation63], which uses fNIRS as a guide to help EEG signals for classification in bimodal MI and mental arithmetic tasks.
4.3 Experimental results
In order to evaluate the quality of TJU dataset and the classification performance of the proposed method, we first compare STformer, EEGNet, DNN and FGANet on the TJU dataset. For EEGNet and DNN, we use both concatenated data and registered data as the input. For STformer, we use the registered data as the input. For FGANet, we use the fNIRS-guided EEG data as the input as proposed in [Citation63]. The TJU dataset has 34 EEG channels and 20 fNIRS channel. For the concatenated data, the number of channels is 54. For the registered data, the number of channels is 34 since we choose EEG as the baseline.
The experimental results are shown in . We observe that the classification performance of STformer is significantly better than the other three methods thanks to its accurate registration method and powerful spatio-temporal feature attention mechanism. The average classification accuracy of STformer provides a 4.7% improvement with respect to FGANet, a 5.8% improvement with respect to EEGNet, and a 13.9% improvement with respect to DNN. Moreover, statistical significance is assessed by Wilcoxon signed-rank test for each algorithm with STformer, as shown in .Notably, the results indicate that STformer has a significant advantage over other methods on the TJU dataset. To evaluate the generalization capability of STformer, we test the model on the BIT dataset running the MI task. The BIT dataset has 30 EEG channels and 36 fNIRS channels. For the concatenated data, the number of channels is 66. For the registered data, the number of channels is 30 since we choose EEG as the baseline. The average classification accuracy of STformer provides a 5.0% improvement with respect to FGANet, a 3.4% improvement with respect to EEGNet, and a 10.8% improvement with respect to DNN. The results show that the TJU dataset has a good reliability. Moreover, the proposed STformer has stable performance and generalizability, which can be easily extended to other tasks.
Figure 3. Comparison of the classification accuracy among DNN, EEGNet, FGANet and STformer. ***, **, and * above certain lines denote that the performance of STformer is significantly better than that of the corresponding algorithm at the 0.005, 0.05, and 0.1 level. The registered data was used as the input for DNN, EEGNet and STformer.
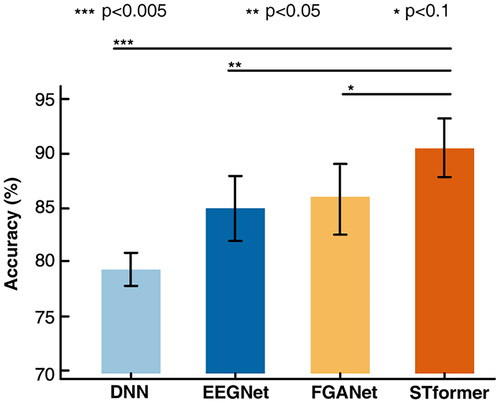
Table 2. Classification accuracy (%) results for DNN, EEGNet, FGANet, and STformer on the TJU dataset and BIT dataset. Con: concatenated data as input. Re: registered data as input. TJU-Avg: average accuracy across all subjects in TJU dataset. BIT-Ave: average accuracy across all subjects in BIT dataset.
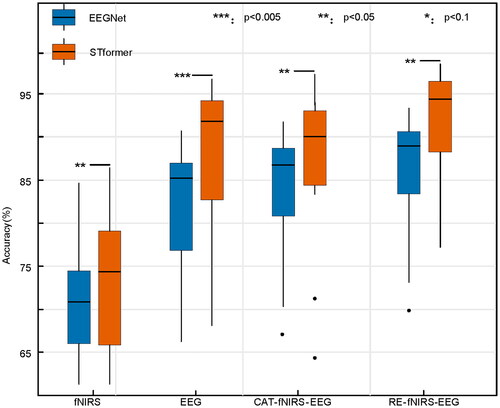
To evaluate the importance of the bimodal signal registration method, we conduct experiments on EEGNet and STformer using only EEG, only fNIRS, CAT-fNIRS-EEG (concatenate EEG and fNIRS in the channel dimension) and RE-fNIRS-EEG (registered bimodal signal), respectively. The experimental results on the TJU dataset are shown in . From the single modal classification results, we observe that the classification accuracy of EEG signal increases by 10.4% and 14.1% compared to that of fNIRS on EEGNet and STformer, respectively. The results inspire our method for bimodal signal registration using EEG as the baseline signal. In addition, when the EEG and fNIRS signals are simply concatenated, the classification accuracy decreases compared to the single-modal EEG signal, implying that the fNIRS signal reduces the classification performance of the EEG signal. Finally, when using the registered bimodal signal, we obtain the best classification accuracy, indicating that the bimodal signal registration method can effectively use both modalities for classification.
Figure 4. Boxplot of accuracy comparison of fNIRS, EEG, CAT-fNIRS-EEG, and RE-fNIRS-EEG on the TJU dataset. The central mark on each box corresponds to the median, the edges of the box correspond to the 25-th and 75-th percentiles, the whiskers extend to the most extreme data points not considered outliers, and outliers are plotted individually as black dots. ***, **, and * above certain lines denote that the performance of STformer is significantly better than that of the corresponding algorithm at the 0.005, 0.05, and 0.1 level.
We further conduct a module and a feature ablation study on the TJU dataset, retaining the spatial feature (Sformer), temporal feature (Tformer), the local spatio-temporal feature extractor (LSTFE) and the global spatio-temporal feature attention (GSTFA), respectively. As shown in , we observe that the classification accuracy and are more affected by spatial feature than temporal feature due to the enhanced spatial information of fNIRS. As expected, preserving global features (GSTFA) has less impact on classification accuracy and
compared to local features (LSTFE). Hence, we can draw the conclusion that GSTFA has a stronger ability to capture feature information.
Table 3. Classification accuracy (%) and AUC (%) results for STformer, CAT-STformer, Sformer, Tformer, GSTFA and LSTFE on the TJU dataset.
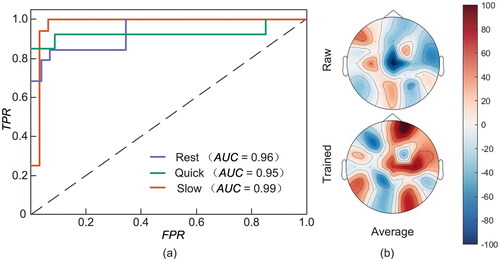
To deeply look into the neural intention capture capability of the designed system, the receiver operating characteristic curve (ROC) for the three SI tasks with different clenching speeds is shown in . We observe that the TJU dataset can accurately identify different speeds of SI, and has an excellent ability to capture spontaneous neural intentions. The of the three classes are Slow = 0.99, Rest = 0.96, and Quick = 0.95, respectively. In addition, from the average activation shown in , the brain activation is more obvious than the raw data. The activation of sensorimotor area and auxiliary motor area is more obvious. Importantly, it implies that the spatio-temporal information acquired by the designed system significantly improve the number of instructions recognized by BCI system and the ability to capture neural activities.
Figure 5. (a) Receiver operating characteristic curves (ROC) for classifying SI by STformer. The x-axis represents the false positive rate (FPR) and the y-axis represents the true positive rate (TPR). (b) Average brain activation maps for raw EEG data and trained registration data.
5. Discussion
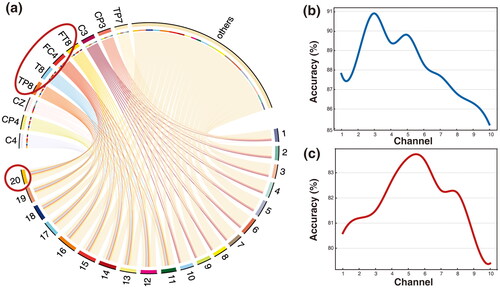
The acceptance of deep learning models in a practical BCI scenario depends on whether the models are capable of interpretability. The important challenge is that the inner workings and decision-making processes of machine-learning models remain opaque, making subjects wary of unexpected results generated by black-box systems. The proposed method improves the interpretability in two aspects. For one thing, the experimental results in and show that the registration algorithm significantly improves the classification performance of the model. Unlike the existing fusion methods, this paper proposes a registration method based on the correlation matrix. The registration algorithm combines the physical characteristics of the two modalities and performs bimodal signal fusion based on spatio-temporal information, which not only can effectively visualize the inter-modal correlation, but also enhances the interpretability of the model from the mathematical theory perspective. It can be seen from that the correlation between the right brain EEG channel and the fNIRS channel (1–10 channels) corresponding to the left-hand SI is more obvious, which proves the effectiveness of our registration method. For another, we further perform feature fusion in both time and spatial domain dimensions, thus enhancing the interpretability of the model from an information-theoretic perspective. It is found from that the spatio-temporal feature weight factor we proposed can effectively improve the classification accuracy, and enhance the activation state of the brain area during the SI process.
Figure 6. (a) Registration correlation visualization. The correlation between the EEG channel (labels in the top) and the fNIRS channel (labels in the bottom) are plotted according to the ZRE. The curved lines show the correlations of EEG and fNIRS to each channel. The edge width represents relative correlation density from ZRE. Taking the red circle as an example, this means that channel 20 of fNIRS has a high correlation with EEG channels TP8, T8, FC4, and FT8, and little correlation with the other EEG channels. This is consistent with the EEG electrode and fNIRS channel distribution maps in . (b) Performance curves of different registration channels on the TJU dataset (blue). (c) performance curves of different registration channels on the BIT dataset (red). the curves reflect the effect of registration with different numbers of fNIRS channels on the classification performance of the two datasets.
In this paper, the EEG signal is chosen as the baseline and the fNIRS signal as the auxiliary signal for three main reasons. First, from , we observe that using EEG alone has higher classification accuracy than using fNIRS alone, suggesting that EEG has an advantage in SI classification. We also compare the classification performance of bimodal signals with EEG as the baseline and with fNIRS as the baseline, and find that the former is superior to the latter. Second, previous work has shown that EEG has high temporal resolution while fNIRS has high spatial resolution. Given the highly time-dependent nature of SI tasks, it is intuitive to employ the high temporal resolution advantage of EEG for classification. Third, from the channel arrangement in , if fNIRS is used as the baseline signal, the EEG nodes surrounding the fNIRS channel are at different distances, making it difficult to quantify the effect of the channel on fNIRS. On the contrary, if EEG is used as the baseline signal, the fNIRS channels around the EEG channel are in the form of a bracket, and the distances of each fNIRS channel are similar, so it is easy to quantify the effect of each fNIRS channel and optimize the correlation matrix. Combining these three reasons, we chose EEG signals as the baseline.
The computational complexity of STformer is slightly higher than that of EEGNet and FGANet, especially because its MHSA layer has more matrix multiplication operations than the convolution-based networks. However, since the network runs on a compute server or desktop computer, the complexity does not seriously degrade real-time performance, and STformer runs in almost the same time as EEGNet and FGANet. If STformer is to be run on edge computing devices such as microcontrollers and FPGAs, there are many ways to reduce the computational complexity such as pruning, quantization, multiplication-free networks [Citation64], etc. Therefore, computational complexity will not be a hindrance to porting to mobile platforms.
The number of registered channels refers to how many fNIRS channels are aligned to a single EEG channel. The number of registered channels versus the classification performance is shown in and . Obviously, it can be found that the TJU dataset has the best classification performance with 3-channel registration, and the BIT dataset has the best performance with 5-channel registration. The optimal number of registered channels reflects the spatial dependence of different SI or MI tasks and the redundancy of information. We observe that the model performance first improves and then decreases as the number of registered channels increases. This phenomenon can be explained from a hemodynamic point of view. When the number of registered channels is insufficient, the fNIRS channels cannot provide sufficient hemodynamic information to obtain the highest classification accuracy. On the contrary, once the number of registered channels is larger than the optimal value, the excess hemodynamic information is detrimental to the expression of feature, which leads to a decrease in classification performance.
Disclosure statement
The authors report there are no competing interests to declare.
Additional information
Funding
Notes on contributors
Zhengkun Liu
Zhengkun Liu received the B.Eng. degree in automation from the School of Electrical and Information Engineering, Tianjin University, Tianjin, China, in 2021. He is currently working toward the master’s degree with the School of Electrical and Information Engineering, Tianjin University, Tianjin, China. His research interests include brain computer interface, spiking neural network and neural architecture search.
Xiaoqian Hao
Xiaoqian Hao received the B.Eng. degree in Yanshan University, Qinhuangdao, China, in 2020. She is currently working toward the master’s degree with the School of Electrical and Information Engineering, Tianjin University, Tianjin, China. Her research interests include brain-computer interface and deep learning.
Tengyu Wu
Tengyu Wu is currently an undergraduate student at the School of Electrical and Information Engineering, Tianjin University, Tianjin, China. His research focuses on the design of fNIRS systems and deep learning.
Guchuan Wang
Guchuan Wang is currently an undergraduate student at the School of Electrical and Information Engineering, Tianjin University, Tianjin, China. His research interests lie in the realm of circuit and systems design.
Yong Li
Yong Li, born in Tianjin in 1981, is currently a Deputy Chief Physician and Master’s Supervisor in the Department of Interventional Oncology at Tianjin Medical University Cancer Hospital, Tianjin, China. His main research interests include oncology, interventional oncology, and automation of minimally invasive cancer treatments.
Biao Sun
Biao Sun received the Diploma degree in electrical information science and technology from Central South University, Changsha, China, in 2004, and the Ph.D. degree in electrical science and technology from Huazhong University of Science and Technology, Wuhan, China, in 2013.From 2015 to 2016, he was a Visiting Research Fellow with the Department of Ophthalmology, Yong Loo Lin School of Medicine, National University of Singapore, Singapore. He is currently an Associate Professor with the School of Electrical and Information Engineering, Tianjin University, Tianjin, China. His research interests include compressed sensing, machine learning, and brain–computer interface.
References
- Chaudhary U, Birbaumer N, Ramos-Murguialday A. Brain–computer interfaces for communication and rehabilitation. Nat Rev Neurol. 2016;12(9):513–525. doi: 10.1038/nrneurol.2016.113.
- Lebedev MA, Nicolelis MA. Brain-machine interfaces: from basic science to neuro-prostheses and neurorehabilitation. Physiol Rev. 2017;97(2):767–837. doi: 10.1152/physrev.00027.2016.
- Velliste M, Perel S, Spalding MC, et al. Cortical control of a prosthetic arm for self-feeding. Nature. 2008;453(7198):1098–1101. doi: 10.1038/nature06996.
- Pichiorri F, Morone G, Petti M, et al. Brain–computer interface boosts motor imagery practice during stroke recovery. Ann Neurol. 2015;77(5):851–865. doi: 10.1002/ana.24390.
- Al-Qaysi Z, Zaidan B, Zaidan A, et al. A review of disability eeg based wheelchair control system: coherent taxonomy, open challenges and recommendations. Comput Methods Programs Biomed. 2018;164:221–237. doi: 10.1016/j.cmpb.2018.06.012.
- Holz EM, Botrel L, Kaufmann T, et al. Long-term independent brain-computer interface home use improves quality of life of a patient in the locked-in state: a case study. Arch Phys Med Rehabil. 2015;96(3 Suppl):S16–S26. doi: 10.1016/j.apmr.2014.03.035.
- Scherer R, Muller G, Neuper C, et al. An asynchronously controlled eeg-based virtual keyboard: improvement of the spelling rate. IEEE Trans Biomed Eng. 2004;51(6):979–984. doi: 10.1109/TBME.2004.827062.
- Bang J-S, Lee M-H, Fazli S, et al. Spatio spectral feature representation for motor imagery classification using convolutional neural networks. IEEE Trans Neural Netw Learn Syst. 2022;33(7):3038–3049. doi: 10.1109/TNNLS.2020.3048385.
- Sun B, Zhao X, Zhang H, et al. Eeg motor imagery classification with sparse spectro-temporal decomposition and deep learning. IEEE Trans. Automat. Sci. Eng. 2021;18(2):541–551. doi: 10.1109/TASE.2020.3021456.
- Sun B, Zhang H, Wu Z, et al. Adaptive spatiotemporal graph convolutional networks for motor imagery classification. IEEE Signal Process. Lett. 2021;28:219–223. doi: 10.1109/LSP.2021.3049683.
- Sun B, Wu Z, Hu Y, et al. Golden subject is everyone: a subject transfer neural network for motor imagery-based brain computer interfaces. Neural Netw. 2022;151:111–120. doi: 10.1016/j.neunet.2022.03.025.
- Qi F, Li Y, Wu W. Rstfc: a novel algorithm for spatio-temporal filtering and classification of single-trial eeg. IEEE Trans Neural Netw Learn Syst. 2015;26(12):3070–3082. doi: 10.1109/TNNLS.2015.2402694.
- Hou Y, Jia S, Lun X, et al. Gcns-net: a graph convolutional neural network approach for decoding time-resolved eeg motor imagery signals. IEEE Trans Neural Netw Learn Syst. 2022;pp:1–12. doi: 10.1109/TNNLS.2022.3202569.
- Ofner P, Schwarz A, Pereira J, et al. Attempted arm and hand movements can be decoded from low-frequency eeg from persons with spinal cord injury. Sci Rep. 2019;9(1):7134. doi: 10.1038/s41598-019-43594-9.
- Shajil N, Mohan S, Srinivasan P, et al. Multiclass classification of spatially filtered motor imagery eeg signals using convolutional neural network for bci based applications. J. Med. Biol. Eng. 2020;40(5):663–672. doi: 10.1007/s40846-020-00538-3.
- Ai Q, Chen A, Chen K, et al. Feature extraction of four-class motor imagery eeg signals based on functional brain network. J Neural Eng. 2019;16(2):026032. doi: 10.1088/1741-2552/ab0328.
- Zhang H, Zhao X, Wu Z, et al. Motor imagery recognition with automatic eeg channel selection and deep learning. J Neural Eng. 2021;18(1):016004. doi: 10.1088/1741-2552/abca16.
- Edelman BJ, Baxter B, He B. Eeg source imaging enhances the decoding of complex right-hand motor imagery tasks. IEEE Trans Biomed Eng. 2015;63(1):4–14. doi: 10.1109/TBME.2015.2467312.
- Yuan H, Perdoni C, He B. Relationship between speed and eeg activity during imagined and executed hand movements. J Neural Eng. 2010;7(2):26001. doi: 10.1088/1741-2560/7/2/026001.
- Yin X, Xu B, Jiang C, et al. A hybrid bci based on eeg and fnirs signals improves the performance of decoding motor imagery of both force and speed of hand clenching. J Neural Eng. 2015;12(3):036004. doi: 10.1088/1741-2560/12/3/036004.
- Fu Y, Xiong X, Jiang C, et al. Imagined hand clenching force and speed modulate brain activity and are classified by nirs combined with eeg. IEEE Trans Neural Syst Rehabil Eng. 2016;25(9):1641–1652. doi: 10.1109/TNSRE.2016.2627809.
- Edelman BJ, Meng J, Suma D, et al. Noninvasive neuroimaging enhances continuous neural tracking for robotic device control. Sci Robot. 2019;4(31):peaaw6844 doi: 10.1126/scirobotics.aaw6844.
- Saha S, Baumert M. Intra-and inter-subject variability in eeg-based sensorimotor brain computer interface: a review. Front Comput Neurosci. 2019;13:87. doi: 10.3389/fncom.2019.00087.
- Ma T, Wang S, Xia Y, et al. Cnn-based classification of fnirs signals in motor imagery bci system. J Neural Eng. 2021;18(5):056019. doi: 10.1088/1741-2552/abf187.
- Weiskopf N, Mathiak K, Bock SW, et al. Principles of a brain-computer interface (bci) based on real-time functional magnetic resonance imaging (fmri). IEEE Trans Biomed Eng. 2004;51(6):966–970. doi: 10.1109/TBME.2004.827063.
- Lee M-H, Kwon O-Y, Kim Y-J, et al. Eeg dataset and openbmi toolbox for three bci paradigms: an investigation into bci illiteracy. GigaScience. 2019;8(5):giz002. doi: 10.1093/gigascience/giz002.
- Lotte F, Bougrain L, Cichocki A, et al. A review of classification algorithms for eeg-based brain–computer interfaces: a 10 year update. J Neural Eng. 2018;15(3):031005. doi: 10.1088/1741-2552/aab2f2.
- Zhao H, Zheng Q, Ma K, et al. Deep representation-based domain adaptation for nonstationary eeg classification. IEEE Trans Neural Netw Learn Syst. 2021;32(2):535–545. doi: 10.1109/TNNLS.2020.3010780.
- Abiri R, Borhani S, Sellers EW, et al. A comprehensive review of eeg-based brain–computer interface paradigms. J Neural Eng. 2019;16(1):011001. doi: 10.1088/1741-2552/aaf12e.
- Tariq M, Trivailo PM, Simic M. Eeg-based bci control schemes for lower-limb assistive-robots. Front Hum Neurosci. 2018;12:312. doi: 10.3389/fnhum.2018.00312.
- Ju C, Guan C. Tensor-cspnet: a novel geometric deep learning framework for motor imagery classification. IEEE Trans Neural Netw Learn Syst. 2022;pp:1–15. doi: 10.1109/TNNLS.2022.3172108.
- Naseer N, Hong K-S. Fnirs-based brain-computer interfaces: a review. Front Hum Neurosci. 2015;9:3. doi: 10.3389/fnhum.2015.00003.
- Khan MJ, Ghafoor U, Hong K-S. Early detection of hemodynamic responses using eeg: a hybrid eeg-fnirs study. Front Hum Neurosci. 2018;12:479. doi: 10.3389/fnhum.2018.00479.
- Liu Z, Shore J, Wang M, et al. A systematic review on hybrid eeg/fnirs in brain-computer interface. Biomed Signal Process Control. 2021;68:102595. doi: 10.1016/j.bspc.2021.102595.
- Shin J, von L¨uhmann A, Blankertz B, et al. Open access dataset for eeg + nirs single-trial classification. IEEE Trans Neural Syst Rehabil Eng. 2016;25(10):1735–1745. doi: 10.1109/TNSRE.2016.2628057.
- Shin J, Kwon J, Im C-H. A ternary hybrid eeg-nirs brain-computer interface for the classification of brain activation patterns during mental arithmetic, motor imagery, and idle state. Front Neuroinform. 2018;12:5. doi: 10.3389/fninf.2018.00005.
- Morioka H, Kanemura A, Morimoto S, et al. Decoding spatial attention by using cortical currents estimated from electroencephalography with near-infrared spectroscopy prior information. Neuroimage. 2014;90:128–139. doi: 10.1016/j.neuroimage.2013.12.035.
- Liu S, Cai W, Liu S, et al. Multimodal neuroimaging computing: a review of the applications in neuropsychiatric disorders. Brain Inform. 2015;2(3):167–180. doi: 10.1007/s40708-015-0019-x.
- Ahn S, Nguyen T, Jang H, et al. Exploring neuro-physiological correlates of drivers’ mental fatigue caused by sleep deprivation using simultaneous eeg, ecg, and fnirs data. Front Hum Neurosci. 2016;10:219. doi: 10.3389/fnhum.2016.00219.
- Ko L-W, Lu Y-C, Bustince H, et al. Multimodal fuzzy fusion for enhancing the motor-imagery-based brain computer interface. IEEE Comput. Intell. Mag. 2019;14(1):96–106. doi: 10.1109/MCI.2018.2881647.
- Fazli S, Mehnert J, Steinbrink J, et al. “Using nirs as a predictor for eeg-based bci performance,” in. Annu Int Conf IEEE Eng Med Biol Soc. 2012;2012:4911–4914. doi: 10.1109/EMBC.2012.6347095.
- Han C-H, M¨uller K-R, Hwang H-J. Enhanced performance of a brain switch by simultaneous use of eeg and nirs data for asynchronous brain-computer interface. IEEE Trans Neural Syst Rehabil Eng. 2020;28(10):2102–2112. doi: 10.1109/TNSRE.2020.3017167.
- Chiarelli AM, Croce P, Merla A, et al. Deep learning for hybrid eeg-fnirs brain–computer interface: application to motor imagery classification. J Neural Eng. 2018;15(3):036028. doi: 10.1088/1741-2552/aaaf82.
- Sun Z, Huang Z, Duan F, et al. A novel multimodal approach for hybrid brain–computer interface. IEEE Access. 2020;8:89909–89918. doi: 10.1109/ACCESS.2020.2994226.
- Kasabov NK. Neucube: a spiking neural network architecture for mapping, learning and understanding of spatio-temporal brain data. Neural Netw. 2014;52:62–76. doi: 10.1016/j.neunet.2014.01.006.
- Hosni SM, Borgheai SB, McLinden J, et al. An fnirs-based motor imagery bci for als: a subject-specific data-driven approach. IEEE Trans Neural Syst Rehabil Eng. 2020;28(12):3063–3073. doi: 10.1109/TNSRE.2020.3038717.
- Ghonchi H, Fateh M, Abolghasemi V, et al. Spatio-temporal deep learning for eeg-fnirs brain computer interface in 2020 42nd Annual International Conference of the IEEE Engineering in Medicine and Biology Society (EMBC), 2020, p. 124–127.
- Snoek CG, Worring M, Smeulders AW. Early versus late fusion in semantic video analysis,” in proceedings of the. 13th annual ACM international conference on Multimedia, 2005, pp. 399–402. doi: 10.1145/1101149.1101236.
- Kamrani E, Sawan M. Fully integrated cmos avalanche photodiode and distributed-gain tia for cw-fnirs,” in. 2011 IEEE Biomedical Circuits and Systems Conference (BioCAS). IEEE, 2011, pp. 317–320. doi: 10.1109/BioCAS.2011.6107791.
- Zhang Z, Sun B, Gong H, et al. A fast neuronal signal-sensitive continuous-wave near-infrared imaging system. Rev Sci Instrum. 2012;83(9):094301. doi: 10.1063/1.4752021.
- Gramfort A, Luessi M, Larson E, et al. Mne software for processing meg and eeg data. Neuroimage. 2014;86:446–460. doi: 10.1016/j.neuroimage.2013.10.027.
- Szachewicz P. Classification of motor imagery for brain-computer interfaces. Poznan university of technology, institute of computing science., Poznán, Poland, 2013. [online] Available: http://www.cs.put.poznan.pl/wjaskowski/pub/theses/pszachewicz_msc.pdf
- Comon P. Independent component analysis, a new concept? Signal Process. 1994;36(3):287–314. doi: 10.1016/0165-1684(94)90029-9.
- McFarland DJ, Wolpaw JR. Sensorimotor rhythm-based brain-computer interface (bci): feature selection by regression improves performance. IEEE Trans Neural Syst Rehabil Eng. 2005;13(3):372–379. doi: 10.1109/TNSRE.2005.848627.
- Scholkmann F, Kleiser S, Metz AJ, et al. A review on continuous wave functional near-infrared spectroscopy and imaging instrumentation and methodology. Neuroimage. 2014;85 Pt 1:6–27. doi: 10.1016/j.neuroimage.2013.05.004.
- Cao S-Y, Shen H-L, Chen S-J, et al. Boosting structure consistency for multispectral and multimodal image registration. IEEE Trans. on Image Process. 2020;29:5147–5162. doi: 10.1109/TIP.2020.2980972.
- Gholipour A, Kehtarnavaz N, Briggs R, et al. Brain functional localization: a survey of image registration techniques. IEEE Trans Med Imaging. 2007;26(4):427–451. doi: 10.1109/TMI.2007.892508.
- Boyd S, Parikh N, Chu E, et al. Distributed optimization and statistical learning via the alternating direction method of multipliers. FNT in Machine Learning. 2010;3(1):1–122. doi: 10.1561/2200000016.
- Lu Z, Liu Y, Jin M, et al. Virtual-scanning light-field microscopy for robust snapshot high-resolution volumetric imaging. Nat Methods. 2023;20(5):735–746. doi: 10.1038/s41592-023-01839-6.
- Howard AG, Zhu M, Chen B, et al. “Mobilenets: Efficient convolutional neural networks for mobile vision applications,” arXiv preprint arXiv:1704.04861, 2017.
- Vaswani A, Shazeer N, Parmar N, et al. Attention is all you need. AdvNeural Inf Processing Syst. 2017;30:5998–6008.
- Lawhern VJ, Solon AJ, Waytowich NR, et al. Eegnet: a compact convolutional neural network for eeg-based brain–computer interfaces. J Neural Eng. 2018;15(5):056013. doi: 10.1088/1741-2552/aace8c.
- Kwak Y, Song W-J, Kim S-E. Fganet: fnirs-guided attention network for hybrid eeg-fnirs brain-computer interfaces. IEEE Trans Neural Syst Rehabil Eng. 2022;30:329–339. doi: 10.1109/TNSRE.2022.3149899.
- Zhang Y, Sun B, Jiang W, et al. WSQ-AdderNet: efficient weight standardization based quantized AdderNet FPGA accelerator design with high-density INT8 DSP-LUT Co-Packing optimization Proceedings of the 41st IEEE/ACM international conference on computer-aided Design, pp. p. 1–9. 2022.