
Abstract
Bus rapid transit systems (BRT) research has focused on suitability for implementation and operational factors while disregarding publics’ perceptions and acceptability. This research addresses this gap by investigating changes in perception towards the Pie-IX BRT, a new line in Montréal, Quebec, Canada, over time and across space. We examine attitudinal statements and open-ended survey questions from before and after its opening. At both times, respondents were divided into two groups, those living within one km of the BRT and those who did not. We analyze four attitudinal statements finding statistically significant changes in perception over time, especially among those residing close to the BRT. For the open-ended questions, we apply thematic analyses. Themes concerning the everyday impacts on the neighborhood and the BRT operations were more prevalent among those living close to the project indicating impacts on livability. Those living farther from the BRT focused on city-wide impacts, such as the financial aspects. Our analyses show that to increase acceptance of BRT, different policy directions are needed for the citywide population compared to those residing nearby. The findings can be of interest to practitioners and policymakers as they shed light on public needs and concerns towards new BRT infrastructure.
1. Introduction
Bus rapid transit systems have gained popularity worldwide given their ability to provide high levels of service at a low cost especially when compared to other transit technologies (e.g. metro and heavy rail) (Ingvardson & Nielsen, Citation2017). Currently, BRT corridors can be found in over 180 cities across the globe, including 22 in North America (BRT Data, Citation2023). New BRT systems are expected to improve operational performance compared to regular bus service as they are found to increase ridership (Deng & Nelson, Citation2011), reduce travel times (Deng & Nelson, Citation2011; Venter, Jennings, Hidalgo, & Valderrama-Pineda, Citation2017), increase on-time performance and service frequency (Deng & Nelson, Citation2011), and improve accessibility (i.e. ease of reaching destinations) (Pereira, Citation2019; Singh, Javanmard, Lee, Kim, & Diab, Citation2022). These outcomes can result in improved social equity (Wirasinghe et al., Citation2013) and have the potential to enhance livability for local communities (Miller, Witlox, & Tribby, Citation2013).
Livable communities are places where a person can rely on safe and affordable transportation options with the goal of improving well-being and quality of life. They also promote health, reduce car dependency and greenhouse gas emissions, improve air quality, and enhance the unique characteristics of a given community (Vavrova & Chang, Citation2019). In this sense, transit corridors can also improve livability by providing more transportation choices, enhancing economic competitiveness, and adding value to communities and neighborhoods especially when mixed with the provision of affordable housing (Appleyard, Ferrell, & Taecker, Citation2016).
When assessing the potential suitability of new BRT infrastructures, most practice and research focuses only on its operational aspects, such as ridership forecasting (Baker & Linovski, Citation2022; Ingvardson & Nielsen, Citation2017; Stewart, Moudon, & Saelens, Citation2017; Umlauf, Galicia, Cheu, & Horak, Citation2016) and travel time and accessibility gains (Pereira, Citation2019; Singh et al., Citation2022). While improvements in operational performance are important measures of the viability of a transportation project, alone they do not account for the socio-cultural factors influencing the acceptability of new transit infrastructures (Cairns, Harmer, Hopkin, & Skippon, Citation2014), including public perceptions. Perceptions have been previously identified as a main driver of political action towards increased sustainable transport (Banister, Pucher, & Lee-Gosselin, Citation2007). Even so, there is a limited literature looking at social perceptions of the acceptability of new BRT infrastructures (Calvo-Poyo, Medialdea, & Ferri-García, Citation2019; Calvo-Poyo, Freiria, Medialdea, & Antunes, Citation2018; Wijaya, Imran, & McNeill, Citation2017), especially on how perceptions change over the implementation of the project and depending on proximity to the infrastructure.
This research gap warrants attention for three main reasons. First, public perception influences the acceptability and success of large infrastructure investments (Loong, van Lierop, & El-Geneidy, Citation2017). Increased local support towards public transit projects can reduce resistance to their funding and implementation (Loong et al., Citation2017), thus increasing their odds of success. Second, perceived reality tends to differ from the objective measures used for the assessment of transit projects (Bhattacharya, Brown, Jaroszynski, & Batuhan, Citation2014; Chowdhury, Hadas, Gonzalez, & Schot, Citation2018). Especially, as perceptions are influenced by a variety of political-economic forces and social-cultural dynamics, such as car culture (Mattioli, Roberts, Steinberger, & Brown, Citation2020). Finally, previous research shows that understanding the heterogenous needs of the population is key to retaining and increasing ridership (Abenoza, Cats, & Susilo, Citation2017; Beirão & Cabral, Citation2007; Brown et al., Citation2016) as those who have positive attitudes and are satisfied with transit are more likely to reuse and recommend the service to others (Allen, Eboli, Forciniti, Mazzulla, & Ortuzar, Citation2019; Fu & Juan, Citation2017; van Lierop & El-Geneidy, Citation2017a). On the other hand, negative perceptions towards transit tend to be more lasting and easier to remember (Allen et al., Citation2019; Allen, Eboli, Mazzulla, & Ortuzar, Citation2020). Similarly, assessing how different population groups perceive a new transit infrastructure can aid in identifying inequalities of access and service provision as well as construction impacts that can influence their quality of life and well-being.
This study explores the Pie-IX BRT on the East side of Montréal, Canada. The $523M CAD project currently spans over 13 km with 14 operational stations. It runs in the North-South direction connecting several commuter routes running East-West. The BRT serves neighborhoods with a high percentage of low-income residents relative to the rest of the region. This research will try to answer the following questions: (1) How do perceptions of a new BRT line change between before and after its opening? (2) What are the differences in perception between those living close to the infrastructure, many of whom are low-income residents and more likely to be impacted by the corridor, compared to those who do not? (3) How can these findings help inform policies aiming to increase project acceptability, livability, and equitable outcomes?
In conducting the research, we choose a combination of quantitative and qualitative techniques, as this allows for a more comprehensive understanding of our research problem (Creswell & Creswell, Citation2018). In this sense, by contrasting qualitative to quantitative findings, we expect to achieve a more nuanced understanding of the heterogeneity of perceptions and needs regarding the infrastructure over time and across space.
2. Literature review
Most of the literature on perceptions of transit service focuses on core constructs, such as perceived quality (Lai & Chen, Citation2011; Mugion, Toni, Raharjo, Di Pietro, & Sebathu, Citation2018; de Ona, Machado, & de Ona, Citation2015), satisfaction (Allen et al., Citation2019; Fu & Juan, Citation2017; Minser & Webb, Citation2010), and attitudes (de Ona et al., Citation2015; Fu & Juan, Citation2017). This research mostly targets current public transit users and aims to understand how different service attributes influence overall satisfaction (see van Lierop & El-Geneidy, Citation2017a) and the formation of loyal behaviors (see Carvalho, Romano, & Gadda, Citation2021; van Lierop & El-Geneidy, Citation2017a), such as willingness to reuse and to recommend, and involvement with public transit. Many studies use a market segmentation approach to account for heterogeneity in riders’ needs and behaviours (van Lierop & El-Geneidy, Citation2017b; Machado, de Ona, Diez-Mesa, & de Ona, Citation2018).
A subset of studies examined the perspective of the general population towards public transit, analyzing the image of transit services and transit providers (Schweitzer, Citation2014) and the factors that could influence switching from car to transit (Anable, Citation2005; Beirão & Cabral, Citation2007; Chen & Chao, Citation2011; Mahmoud & Hine, Citation2013). The public image of transit can directly influence how service quality and service value are perceived, thus also impacting satisfaction levels and loyalty to transit (Minser & Webb, Citation2010; Zhao, Webb, & Shah, Citation2014). In this sense, Schweitzer (Citation2014) highlights that people tend to be more negative towards transit compared to other public services on social media. Nonetheless, transit agencies can help counteract this trend by engaging positively with users online. In terms of factors influencing switching intentions from car to transit, studies have found that personal and lifestyle characteristics, perceived service level, convenience of transit, and trip purpose largely affect intentions to use transit (Beirão & Cabral, Citation2007; De Vos, Singleton, & Gärling, Citation2021; Şimşekoğlu, Nordfjærn, & Rundmo, Citation2015; Van, Choocharukul, & Fujii, Citation2014).
More recently, scholars have become interested in new transit infrastructures both in terms of (i) public engagement and (ii) factors influencing their support. The former focuses on developing methods and frameworks for optimizing public engagement in the design process of new services (Cascetta & Pagliara, Citation2013; de Luca, Citation2014; Ignaccolo, Inturri, Giuffrida, Pira, & Torrisi, Citation2019). The common goal among these studies is to account for the needs of the population and to increase project acceptability. The latter explored either stated preferences regarding transit investments (Hensher, Mulley, & Rose, Citation2015; Loong et al., Citation2017) or the perception and acceptability of newly implemented projects (Calvo-Poyo et al., Citation2019; Calvo-Poyo et al., Citation2018; Wijaya et al., Citation2017).
Within this last group, only a few studies have explored new BRT infrastructures. Calvo-Poyo et al. (Citation2018) studied the implementation of a new system in Coimbra, Portugal. They modelled the relationship between attitudes and support for the project observing that increased support was related to acceptance of construction timelines and cost estimations, believing that the BRT would help businesses and ridership potential. In another study, using data from a telephone-survey in Spain, Calvo-Poyo et al. (Citation2019) found that citizens were more likely to believe that new transit investments were adequate and sufficient if they were already satisfied with current public transit services. Finally, Wijaya et al. (Citation2017) report that negative local public opinion can severely limit the implementation of BRT projects as in the case of Bandung and Surabaya in Indonesia. In both cities, informal paratransit operators fearing for impacts of formalizing transit operations on their incomes were able to garner support from the population, thus obstructing the advancement of BRT projects.
Even though relevant contributions to the field, studies on public perception of new BRT infrastructures have not accounted for changes in perception both over time and across space, which are gaps that this study aims to fill. Moreover, by applying a combination of quantitative and qualitative approaches, we aim to capture a wide range of perspectives on perceptions around new BRT corridors as well as potential points of conflict in their implementation. By doing so, we aim to inform policy encouraging the acceptability of BRT infrastructures.
3. Case study area: the PIE-IX BRT
The Pie-IX boulevard is an arterial on the East side of the Montréal Island crossing several low-income neighbourhoods. The average income along the boulevard is 33% lower when compared to the average income on the island of Montreal (StatCan, Citation2022). Similarly, the studied region also presents a higher share of immigrant (+10.0%) and visible minority (+14.6%) populations when compared to the rest of the city (StatCan, Citation2023). Areas with over 50% of low-income households are predominant along the corridor as depicted in while the North of the corridor tends to accommodate higher shares of immigrants and visible minorities.
Figure 1. Status of construction of the Pie-IX BRT stations and their connection to Montréal’s metro lines.
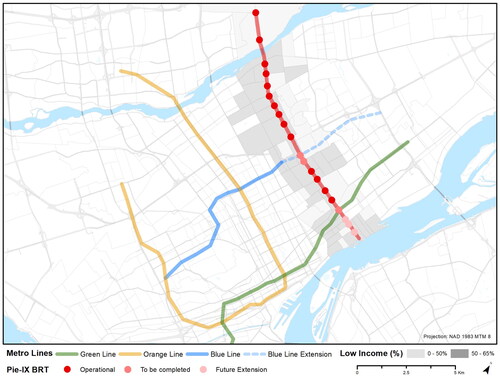
The arterial has been previously the home to the first BRT line in Montréal. The 505 R-BUS Pie-IX operated from 1989 to 2002 acting as a supplement to the still operational 139 Pie-IX route during rush hour. The previous BRT system had 10 dedicated stations located at the center of the boulevard with buses running in counterflow to traffic serving 8000 riders per day (Doyon, Citation2005). However, after four fatalities involving pedestrians and repeated cases of injuries from drivers conducting illegal left turns, service was suspended indefinitely in 2002 (TVA Nouvelles, Citation2002).
Given the forecasted demand for the corridor, the City of Montréal announced plans for a new BRT system in the same corridor with an estimated cost of $100M CAD in 2008 (Ville de Montréal, Citation2008). In the following year, the project was formally announced to the public with an updated cost of $150M CAD and an expected 2013 opening date (CTV Montreal, Citation2009). Nonetheless, the project ended up being postponed four times due to bureaucratic challenges (Corriveau, Citation2014) and only began construction in 2018 for a new estimated total of $393M CAD (Corriveau, Citation2018). Construction happened over three phases including fixing gas lines, building electrical infrastructure, and rebuilding the roadway. Moreover, the 139 Pie-IX route was redirected to parallel residential streets to avoid worsening the traffic conditions. In November 2022, 13 years after its announcement, 14 out of the 20 planned stations become operational () (STM, Citation2022). So far, the project has cost $523M CAD (Lacerte-Gauthier, Citation2022) spanning over 13 km (STM, Citation2022). Currently, two more stations are under construction and a call for tenders was announced for a third.
In summary, the rich background of the corridor makes the Pie-IX BRT an interesting case study for evaluating changes in perception. Some noticeable reasons are the challenges of implementation (i.e. timeline, costs, and nuisance of construction), the partial replacement of normal bus service, the pre-existing BRT in the region with a contentious road safety history, and the line running mostly along low-income areas in the city. All these factors can influence the perception and the acceptability of the line and impact livability in the corridor.
4. Methods
4.1. Montréal mobility survey
To understand changes in perception before and after the opening of the Pie-IX BRT, this research draws from the 2021 and 2022 waves of the Montréal Mobility Survey (MMS) collected by the Transportation Research at McGill (TRAM) group. For both waves, the research team implemented multiple recruitment methods to ensure a large and representative sample as proposed by Dillman, Smyth, and Christian (Citation2014). This included advertisement through a marketing company, social-media ads, flyer distribution, and personalized email invitations.
Our analysis concentrates on a subset of the survey samples from 2021 and 2022, those aware of the Pie-IX BRT. Respondents aware of the line were asked to answer a series of quantitative questions regarding their attitudes towards the project in both waves, measured by a 5-point Likert scale. The questions were “the Pie-IX BRT is a good thing for the greater Montréal area”, “the Pie-IX BRT is a good thing for my neighborhood”, “I am concerned about whether I will be able to remain in my neighborhood due to rising housing costs due to the Pie-IX BRT”, and “the Pie-IX BRT is good for the environment”. This series of questions was followed by an optional open-ended question: “Is there anything else you would like to share about the anticipated impacts of the Pie-IX BRT? If you do not have any suggestions, you do not need to respond to this question”.
4.2. Sample size
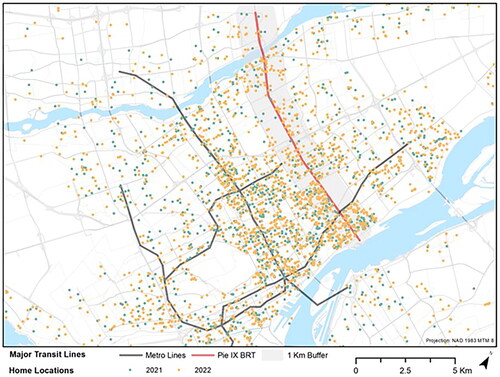
The same data-cleaning process was employed in both 2021 and 2022 data samples to ensure consistency. The exclusion criteria included a short completion time, incomplete responses, multiple responses from the same email address or IP address, and invalid age or height differences between the waves. Those who placed a pin representing their home, school, and/or work location outside of the Montreal metropolitan area were also excluded. In 2021, from the initial sample of 4058 valid responses (6987 pre-validation), 2332 indicated being aware of the Pie-IX BRT. Out of this subset, 200 open-ended responses were available to be analyzed after filtering for non-responses (i.e. answers that did not provide a comment regarding the project). Responses ranged from 1 to 204 words, while the average comment was 29 (s.d. = 28) words long. Similarly, for 2022, out of 4079 initial valid responses (6422 pre-validation), 2864 were aware of the new BRT infrastructure. From this sample, 251 open-ended responses were analyzed. Responses ranged from 1 to 213 words and the average comment was 30 (s.d. = 29) words long. shows the distribution of home locations of respondents from the two waves. At both points in time, respondents are mostly concentrated in the South of the corridor. It is important to note a small number of individuals answered both waves and were present in the two samples (N = 24), yet direct comparisons between the person’s response before and after the opening of the BRT were not carried out due to the small sample of the panel.
Figure 2. Distribution of home locations of those aware of the Pie-IX BRT project.
4.3. Analyses
In both quantitative and qualitative analyses, we compare results from before (2021 survey) to after (2022 survey) the opening of the Pie-IX BRT to measure changes in perception over time. Within the analyses, we incorporate a spatial element to investigate how living in the vicinity of the infrastructure impacted perception. To do so, we generated a 1-km buffer around the BRT stations in ArcGIS, which was used to classify respondents from both waves into two groups, (i) those living in the 1-km buffer and (ii) those who do not. Even though 800 m is usually defined as the catchment area of transit stations (Guerra, Cervero, & Tischler, Citation2012), a 1km-buffer was selected to reflect the maximum distances Montréal residents are willing to walk to similar high-frequency transit services (i.e. train and metro) (El-Geneidy, Grimsrud, Wasfi, Tétreault, & Surprenant-Legault, Citation2013).
For the quantitative data, we use a repeated cross-sectional design as the goal is to identify general trends in changes in perception towards the studied BRT corridor over time and not time-based relationships among a set of variables (Pan, Citation2019; Wang & Cheng, Citation2020). We provide frequency statistics for each wave and attitudinal variable by group (i.e. inside vs. outside the 1-km buffer). For analysis purposes, the answers to the attitudinal questions were re-coded from 5-point to 3-point Likert scale (disagree, neutral, and agree), followed by calculating a percentage point difference from 2022 to 2021 for each category. Then, we examine whether the frequency distributions have changed significantly over time by conducting a Pearson Chi-Square Test of Independence.
For the qualitative data, we use thematic analysis. Our goal was to find repeated patterns of meaning across the datasets for each wave of data collection at a semantic (explicit) level (Braun & Clarke, Citation2006), which were also split by group. We follow the approach laid out by Guest, MacQueen, and Namey (Citation2012) termed Applied Thematic Analysis (ATE). ATE is a systematic and rigorous technique that is well-suited to large data sets (Guest et al., Citation2012). Moreover, given its inductive nature, it fits well with the exploratory nature of our research. Data-familiarization was undertaken by the careful examination of responses from which preliminary themes were defined (Nowell, Norris, White, & Moules, Citation2017). To improve credibility, peer-debriefing was used to ensure the soundness of the patterns found in the raw data and their classification into themes (Nowell et al., Citation2017). On the same note, a codebook was kept across both datasets to systematically and consistently categorize the data (Guest et al., Citation2012). As recommended for larger datasets in ATE, we quantify themes based on their frequency, which allowed us to compare results between waves and groups. Finally, we interweave direct quotes while reporting the results of the analyses to illustrate themes and their prevalence (Guest et al., Citation2012). We also highlight theme frequency differences across different income groups to illustrate possible equity considerations for policy development.
5. Results
shows the socio-demographic distribution by gender and income over time and by proximity to the BRT. Both qualitative and quantitative samples included more men than women over time and for both groups. The only exception is for the 2022 data inside the 1-km buffer, which is more evenly split (quantitative) and has more women leaving comments regarding the project (qualitative). On the same note, the 2022 sample inside the 1-km buffer have higher shares of low-income respondents, which better represents the demographics along the corridor when compared to the 2021 census data obtained from Statistics Canada. In sum, our sample overrepresents men and high-income respondents. In both waves, those living inside the buffer on average left longer comments than those outside.
Table 1. Socio-demographic split over time and by proximity to the Pie-IX BRT line.
5.1. Attitudinal statements
displays the agreement of respondents to four statements concerning the BRT from questions drawn from the quantitative section of the MMS, the percentual change for each level of agreement (i.e. agree, neutral, disagree), and the results of a Pearson Chi-Square Test of Independence reflecting the similarity of the distribution of responses at both points in time. p-Values <0.05 indicate statistically significant changes in response patterns over time, indicating changes in perception.
Table 2. Distribution of agreement to statements regarding the Pie-IX BRT over time and by proximity to the Pie-IX BRT line.
Over 75% of those living inside and outside the 1-km buffer agree that the BRT is a good project for Montréal. No statistically significant changes are found over time for both groups. Those living within 1-km of the BRT stations became significantly less positive towards the project being a good addition to their neighborhood (neutral: 2021, 13%; 2022, 43%) and less concerned about their ability to remain in the area (gentrification concerns) (neutral: 2021, 30%; 2022, 42%). When assessing by income, low-income respondents in the region remained more positive about the corridor being good for the neighborhood when compared to high-income respondents (agree: 2022, 46%; 2022, 33%). High-income respondents displayed almost no concern with gentrification processes after the line was opened (agree: 2022, 2%) relative to low-income residents who were mostly neutral (agree: 2022, 15%, neutral: 2022, 44%). Comparatively, perceptions of those living outside the buffer did not change as much. The agreement with the BRT being good for their neighborhood increased (agree: 2021, 24%; 2022, 29%) while no statistically significant changes were found in terms of gentrification concerns. Over 65% of respondents inside and outside the 1-km buffer agree that the Pie-IX BRT is good for the environment. In the buffer, there was a significant decrease in disagreement with the statement over time with an increase in neutrality towards it. No statistically significant changes were found outside.
5.2. Thematic analyses
provides a summary of the most frequent themes found in the thematic analyses of the open-ended questions. As for the quantitative data, we report themes before and after the opening of the BRT and percent changes over time for both geographic groups. To be counted as a theme, at least 5% of respondents should have engaged with it at any point in time either inside or outside the buffer. The benchmark of 5% is arbitrary and used to restrict the number of themes to be analyzed given the broadness of the question. Directionality is also indicated by a (+) reflecting a positive perception, or (−) a negative perception. The following subsections report on themes found for each topic presented in .
Table 3. Summary of themes regarding the Pie-IX BRT over time and by proximity to the Pie-IX BRT line.
5.2.1. Perception of the project
Those who chose to answer the open-ended questions tended to be more critical of the project, especially before the opening of the route. In 2021, 42% of respondents across both groups indicated that the project was outdated, inefficient, or inadequate (84 out of 200 comments). After the opening, comments of this nature decreased within the 1-km buffer while remaining stable outside. Furthermore, inside the buffer, negative comments decreased more prominently among high-income respondents (decrease: −34%) when compared to low- (decrease: −8%) and middle-income (decrease: +12%) groups. Even if negative comments were the most prevalent in the before period, a sizable share of comments (5% inside the buffer and 20% outside the buffer) was positive and commented on the benefits of the project. They expressed that the BRT was meeting “a need in the area” benefiting “residents in the North of the city” and providing a “faster alternative between Laval and Montréal”. Nonetheless, this tone was mostly observed in responses from outside the buffer and its frequency decreased after the opening of the line. A small (5% in 2021, 7% in 2022) share of those living close to the BRT were supportive of the project over time sharing their excitement over potentially better transit service in the region.
5.2.2. Regional impacts
The regional impacts were dominated by negative statements towards the project. First, many would have preferred a tramway, a metro, or electric buses to be chosen as the solution for the Pie-IX corridor. A portion of respondents sees the BRT as “a temporary measure while waiting for a more efficient and permanent mode of transportation to be put in place”. This argument mostly comes from (i) a concern that the project would not have enough capacity for the demand in the area, (ii) understanding the BRT as simply a costly exclusive bus lane, (iii) perceiving no or insufficient environmental gains from the solution, and (iv) forecasting a negligible impact of the project on the quality of life and social inclusion of those living in the area. The prevalence of this type of comment declined within the 1-km buffer after the opening of the BRT while remaining stable outside the 1-km buffer.
Second, several respondents inside the 1-km buffer argued in the 2021 period that the project is going to fail stating that “this project was […] done in the past with many problems and injuries to users” and ask, “why repeat the same project with the same mistakes?” Therefore, illustrating that many did not see improvements in terms of safety design in the new line. The incidence of this type of comment declined after the opening of the BRT, however, road safety concerns remain (further explored in Section 5.2.3).
A third reason for discontentment with the BRT, which was more prominent among those living in the 1-km buffer, and especially low-income respondents, is the perceived lack of integration with other lines in the network. Some criticize that they “will still have to wait years before the blue line connects to the BRT”. The blue line is a metro line in Montréal, which when extended will increase the connection of the Pie-IX region to the West of Montréal Island (). The extension is expected to be finished by 2029. Others are unhappy that the route is not connected to the orange metro line or that people from the region will still have to take the green line under crowded conditions to get to downtown. Comments of this nature remained mostly stable over time and across both groups. Moreover, after the opening of the BRT, people who commute to Laval report not having “enough available options to come back to Montréal” as operations are limited on this end of the route.
A fourth and final reason spans across three themes relating to a perceived inefficiency of those in charge of the project (i.e. city, transport agencies, politicians) in terms of the allocation of resources (i.e. construction timeline and costs). These concerns are well illustrated by the following comment: “the fact that it took 10 years and had too many cost overruns makes me question the city’s ability to implement significant public transportation projects within the established criteria”. Comments of this nature were more frequent with respondents living outside the buffer. Moreover, their incidence increased over time, especially in relation to construction costs.
5.2.3. Local impacts
As all themes reflecting neighborhood level concerns are predominantly found within the 1-km buffer, this sub-section focuses only on this group of respondents. The nuisance of construction was the most prevalent theme at the neighborhood level. As the project took over ten years to be completed, many of those living around the Pie-IX BRT stations “have been considerably disturbed during the construction”. Residents complain about “dust, noise, bus routes passing through residential streets, blocked streets, [and] long detours to find the right way”. They also report “poor coordination of the work and no communication between the STM [Société de Transport de Montréal, local transit agency], the city, and the construction” generating “a lot of citizen dissatisfaction around the construction site”. Some state that communication in the later phases of construction was improved. The frequency of comments of this nature dropped significantly after the opening of the BRT, nonetheless, its occurrence remains noteworthy, especially among high-income respondents in the region.
Another concern from people in the area is the lack of connection to the neighborhood at the south of the Pie-IX boulevard. Respondents highlight that it “is a poor neighborhood where people need public transportation” and highlight that even though the BRT does not reach the area, the frequency of local buses has been cut there. The city plans to reach the neighborhood in the future by extending the line. There is currently a call for tenders for a station that will start their connection to the route (STM, Citation2022). Nonetheless, there are no announcements on when the remaining three stations planned for the neighborhood will be operational.
As previously mentioned, residents in the area worry about road safety given the history of the route. Several dislike the street design with stations being placed in the middle of the street and found it better when buses were running at the edge of the street. They argue that the design “makes life for pedestrians even more difficult and dangerous” and predict that “there will be more accidents involving pedestrians and […] motorists”. Some also complain about the “20th century” mentality in the project as no cycling infrastructure was provided even though the boulevard was reworked. Comments concerning road safety are more common among high-income respondents.
A final theme, which appeared after the opening of the line, is the worsening of driving conditions. Some report that driving has become more dangerous as (i) “the lanes where motorists can drive are narrower than before […] particularly in winter because of the snow”, (ii) “the black ‘fence grids’ delimiting […] the reserved middle lanes greatly reduce visibility for motorists”, (iii) “the places where you can turn left […] are very dangerous because you have to cut off the buses”, and (iv) “there is no room to maneuver [from obstacles]”. Drivers complained that with fewer lanes there will be an increase in total travel time. Some even argue that “all buses should use the BRT [corridor]” as to free up space for drivers. Comments regarding the worsening of driving conditions increased more prominently among low-income respondents.
5.2.4. Satisfaction with the BRT operations
This topic of analysis reflects a new amalgamation of themes that appeared after the opening of the line and that were mostly cited by those living in the 1-km buffer. As in the previous section, we focus only on those in the vicinity of the BRT. As shown in , the first two themes denote dissatisfaction with transit service in the region. They are either due to a poor perception of BRT operations or to cuts in service in other lines now that the BRT is operational. On this note, several respondents were disappointed that they did not experience reductions in travel time as illustrated by the following excerpt: “[…] how is it possible that the bus takes exactly the same amount of time as before they opened the BRT? Nothing changed. Nothing! […]”
Moreover, several complained about levels of crowding, which are “unpleasant” and lead to “chaotic” boarding and exiting conditions. The design of shelters received criticism as it was not deemed suitable for winter conditions as “the wind rushes in and it’s very cold inside”. The BRT has been labeled as “not very practical” due to its limited frequency, especially among low- and middle-income respondents. Additionally, it favors only one direction during rush hours and has a limited schedule on weekends. Those going to and from Laval outside of rush hour seem to be the most affected by the scheduling as the operators run several buses with short turns, ending the trips on the island of Montreal.
Although a feature of BRTs, the spacing of stations was criticized as it “requires a lot of walking for users who cannot get off near their home” which “[…] is not very pleasant in winter, especially when accompanied by a child or heavy bags”. Distances between stations were reasoned as a problem by seniors, which represent 15% of the population in the region. Moreover, most of these complaints come from respondents who suffered from cuts in service along the 139, a non-express bus line along the same route. Therefore, they now must walk longer distances to reach the BRT or wait longer for their usual bus service.
Finally, a small number of respondents commented on their satisfaction with the BRT. One respondent mentions that the “BRT system works efficiently because there are not too many stops” and that the “traffic lights are quite synchronized”. One other mention that the travel time of a family member has been “reduced by half with the BRT”. Thus, indicating that not all experiences with the line are negative.
5.2.5. Impacts to the environment
Those who answered the open-ended questions displayed a more negative tone when compared to the responses to the attitudinal statement “the Pie-IX BRT is good for the environment”. A common argument among those who did not believe that the BRT was favorable to the environment is that “buses are a less good solution for […] the environment than trams”. Similarly, others claimed that “the BRT is not really more environmentally friendly, since the buses are still not electric”. This environmental concern stems from a larger set of factors regarding the discontentment with the BRT as a solution for the corridor, which was reported in Section 5.2.2. Moreover, several disliked that century-old trees along the boulevard were cut down for the execution of the project. Overall, comments of this nature declined in frequency over time within the 1-km buffer while remaining stable outside.
6. Discussion and conclusions
This paper focused on how perceptions change over time towards new BRT infrastructures. Our case study is the Pie-IX BRT which serves a low-income neighborhood on the East side of Montréal Island. In this sense, we examine data from before and after the opening of the line using a combination of quantitative and qualitative techniques. We investigate how living in the vicinity of the infrastructure impacts perception. We accomplish that by splitting the sample into two groups, living within and beyond 1-km from stations. In this section, we discuss overall and group-specific trends in perception as well as their policy implications for increasing positive perception, acceptability, livability, and equitable outcomes of such projects.
Even though statistically significant changes in the attitudinal statements can be found over time for both groups, they are more pronounced for those living near the BRT. This is reasonable as the local population more closely experienced the positive and negative developments in the area as the project progressed. Over time, those living closer to the infrastructure became less positive and more neutral towards the BRT being a good thing for their neighborhood and less concerned about gentrification processes. Even though it may be argued that those who were concerned about the project impacts may have already left the region, it is an unlikely scenario as over 92% of respondents in both waves were living in the region for at least one year. Most in both groups agree that the project is good for Montréal and good for the environment at both points in time. This indicates that both general and local populations accept the project and see benefits from it.
The qualitative analyses further highlighted differences between both groups as the incidence of themes varied both spatially and over time. Themes concerning the everyday impacts on the neighborhood and the BRT operations were more prevalent among those living close to the project. Over time, those in the region, low-income residents especially, became increasingly concerned with cuts in service from pre-existing lines, the lack of connection to other low-income neighborhoods in the region, road safety, and worsened traffic conditions for drivers. All of which can impact the well-being and the livability conditions of those living close to the corridor. After the opening, residents of the region also reported discontentment with the BRT services. Those in the region also still carry perceptions regarding the previous BRT line that existed in the region that closed over 20 years ago. This demonstrates the lasting effect of negative incidents on perceptions as proposed by Allen et al. (Citation2019). On the other hand, themes among those living farther from the BRT were mostly stable over time and focused on city-wide impacts, especially in terms of the financial aspect of the project and the efficiency in the execution. Thus, our analyses reveal a spatial component to perceptions towards public transit infrastructure which could be further explored in research on public perception of transit infrastructure.
In conclusion, our study provides evidence that perceptions towards new BRT infrastructure change both over time and spatially. It is important to highlight that those who answered the open-ended questions tended to be more negative and critical of the project, which reflects a long-recognized negativity bias in open-ended responses (Poncheri, Lindberg, Thompson, & Surface, Citation2007). Therefore, the results from the qualitative data present a more skewed view of the acceptability of the project. Even so, in conjunction with the analysis of the attitudinal statements, it is possible to understand needs and concerns within the population which can be the target of policies aiming to improve positive perceptions towards a BRT project.
6.1. Policy implications
Our analyses show that to increase the acceptability of the BRT different policy directions are needed for those within and outside the buffer. First, at a city-wide level, there is a need for better communication of the benefits of BRTs when compared to other surface transit modes mentioned by commenters, especially in terms of costs, capacity, environmental benefits, and execution timeline. This would help justify the use of a BRT in a corridor and further increase the acceptability of future projects. Moreover, the project would have benefited from clearer communication to the population of the challenges faced during its execution leading to budget overruns and construction delays, which significantly affected the quality of life of those close to the BRT due to the nuisance of construction. Those living in the vicinity of the BRT can still benefit from clear communication on how road safety has improved relative to the design discontinued in 2002. Additionally, both cyclists and drivers have been vocal about their perceptions of worsening road safety conditions in the region which merit further investigation.
Finally, public transit users in the region point to several service attributes that could be improved given their feasibility. The most relevant relates to the increasing frequency of service in both directions to reduce crowding conditions and improve convenience, better-organizing boarding, and exiting at stations (e.g. by designating doors for each operation and by offering off-board fare collection), providing better sheltering for winter conditions, and rethinking the scheduling of pre-existing lines (i.e. 139) to better suit those with mobility difficulties. Also, the local population highly anticipates the expansion of the line to the south of Pie-IX. This extension would reach more low-income neighborhoods and connect to the blue metro line, improving transit accessibility across the island. These improvements can lead to more equitable outcomes in the region especially as these concerns appear most frequently among comments of low-income residents leading to improved well-being and livability along the Pie-IX BRT corridor.
6.2. Study limitations and future research
A limitation of the study is that, despite having large samples, they skewed towards a male and wealthy demographic, which is not representative of the Montréal population. The exception is for the 2022 data inside the buffer which tended to be more female and low-income as it is expected for the region. Nonetheless, to overcome these issues, we have also replicated the analyses in the paper by income and gender, finding that proximity to the line was the most significant factor explaining differences in perception. Moreover, we attempted to give more weight to comments from women and low-income residents while reporting the data. Future studies should investigate the evolution of perceptions towards new BRT infrastructures over longer periods of time. Examining whether perceptions become more stable over time and if the themes inside and outside the vicinities of the infrastructure continue to diverge. Moreover, future research could also consider the impacts of interventions in the form of soft or hard policies on the perception and acceptability of transit infrastructure.
Author contributions
The authors confirm their contribution to the paper as follows: study conception and design, data collection, analysis and interpretation of results, and draft manuscript preparation: Carvalho and El-Geneidy. All authors reviewed the results and approved the final version of the manuscript.
Acknowledgements
This paper was earlier presented in track F-4 (Liveability and Non-Motorized Transport) of the World Conference on Transport Research (WCTR-2023) held in Montreal, Canada, from 17th to 21st July 2023. The authors thank the track Chair for giving the opportunity to submit our paper to the partner journal TSTL, Taylor & Francis (T&F).
Disclosure statement
No potential conflict of interest was reported by the author(s).
Additional information
Funding
References
- Abenoza, R., Cats, O., & Susilo, Y. (2017). Travel satisfaction with public transport: Determinants, user classes, regional disparities and their evolution. Transportation Research Part A: Policy and Practice, 95, 1–23. https://doi.org/10.1016/j.tra.2016.11.011
- Allen, J., Eboli, L., Forciniti, C., Mazzulla, G., & Ortuzar, J. (2019). The role of critical incidents and involvement in transit satisfaction and loyalty. Transport Policy, 75, 57–69. https://doi.org/10.1016/j.tranpol.2019.01.005
- Allen, J., Eboli, L., Mazzulla, G., & Ortuzar, J. D. (2020). Effect of critical incidents on public transport satisfaction and loyalty: An ordinal probit SEM-MIMIC approach. Transportation, 47(2), 827–863. https://doi.org/10.1007/s11116-018-9921-4
- Anable, J. (2005). ‘Complacent car addicts’ or ‘aspiring environmentalists’? Identifying travel behaviour segments using attitude theory. Transport Policy, 12(1), 65–78. https://doi.org/10.1016/j.tranpol.2004.11.004
- Appleyard, B., Ferrell, C., & Taecker, M. (2016). Toward a typology of transit corridor livability. Transportation Research Record: Journal of the Transportation Research Board, 2543(1), 71–81. https://doi.org/10.3141/2543-08
- Baker, D., & Linovski, O. (2022). The impact of a single bus rapid transit corridor on transit ridership: The Winnipeg example. Transportation Research Record: Journal of the Transportation Research Board, 2676(9), 94–109. https://doi.org/10.1177/03611981221085531
- Banister, D., Pucher, J., & Lee-Gosselin, M. (2007). Making sustainable transport politically and publicly acceptable: Lessons from the EU, USA and Canada. In P. Rietveld & R. Stough (Eds.), Institutions and sustainable transport: Regulatory reform in advanced economies (pp. 17–50). Cheltenham: Edward Elgar Publishing.
- Beirão, G., & Cabral, J. (2007). Understanding attitudes towards public transport and private car: A qualitative study. Transport Policy, 14(6), 478–489. https://doi.org/10.1016/j.tranpol.2007.04.009
- Bhattacharya, T., Brown, J., Jaroszynski, M., & Batuhan, T. (2014). The effects of perception vs. “reality” on travel behavior after a major transit service change: The case of Tallahassee, Florida. Journal of Public Transportation, 17(2), 1–26. https://doi.org/10.5038/2375-0901.17.2.1
- Braun, V., & Clarke, V. (2006). Using thematic analysis in psychology. Qualitative Research in Psychology, 3(2), 77–101. https://doi.org/10.1191/1478088706qp063oa
- Brown, B., Werner, C., Smith, K., Tribby, C., Miller, H., Jensen, W., & Tharp, D. (2016). Environmental, behavioral, and psychological predictors of transit ridership: Evidence from a community intervention. J. Environ. Psychol. 46, 188–196. https://doi.org/10.1016/j.jenvp.2016.04.010
- BRT Data (2023). BRT Data. Retrieved October 5, 2023, from https://brtdata.org/
- Cairns, S., Harmer, C., Hopkin, J., & Skippon, S. (2014). Sociological perspectives on travel and mobilities: A review. Transportation Research Part A: Policy and Practice, 63, 107–117. https://doi.org/10.1016/j.tra.2014.01.010
- Calvo-Poyo, F., Freiria, S., Medialdea, A., & Antunes, A. (2018). Citizens’ survey for the implementation of a new means of transport. Transportation Research Procedia, 33, 251–258. https://doi.org/10.1016/j.trpro.2018.10.100
- Calvo-Poyo, F., Medialdea, A., & Ferri-García, R. (2019). Citizens’ opinion about investment in public transport projects in cities. International Journal of Sustainable Transportation, 14(10), 806–818. https://doi.org/10.1080/15568318.2019.1630529
- Carvalho, T., Romano, C., & Gadda, T. (2021). Loyalty and public transit: A quantitative systematic review of the literature. Transport Reviews, 42(3), 362–383. https://doi.org/10.1080/01441647.2021.1991032
- Cascetta, E., & Pagliara, F. (2013). Public engagement for planning and designing transportation systems. Procedia-Social and Behavioral Sciences, 87, 103–116. https://doi.org/10.1016/j.sbspro.2013.10.597
- Chen, C., & Chao, W. (2011). Habitual or reasoned? Using the theory of planned behavior, technology acceptance model, and habit to examine switching intentions toward public transit. Transportation Research Part F: Traffic Psychology and Behaviour, 14(2), 128–137. https://doi.org/10.1016/j.trf.2010.11.006
- Chowdhury, S., Hadas, Y., Gonzalez, V., & Schot, B. (2018). Public transport users’ and policy makers’ perceptions of integrated public transport systems. Transport Policy, 61, 75–83. https://doi.org/10.1016/j.tranpol.2017.10.001
- Corriveau, J. (2014). Pie-IX toujours sans SRB dix ans après l’annonce. Le Devoir.
- Corriveau, J. (2018). The beginning of the end of the SRB Pie-IX saga. Le Devoir.
- Creswell, J. W., & Creswell, J. D. (2018). Research design (5th ed.). Thousand Oaks, CA: Sage.
- CTV Montreal (2009). Reserved bus lane coming to Pie-IX Boulevard. CTV Montreal.
- de Luca, S. (2014). Public engagement in strategic transportation planning: An analytic hierarchy process based approach. Transport Policy, 33, 110–124. https://doi.org/10.1016/j.tranpol.2014.03.002
- de Ona, R., Machado, J., & de Ona, J. (2015). Perceived service quality, customer satisfaction, and behavioral intentions structural equation model for the metro of Seville, Spain. Transportation Research Record, 2538, 76–85. https://doi.org/10.3141/2538-09
- De Vos, J., Singleton, P., & Gärling, T. (2021). From attitude to satisfaction: Introducing the travel mode choice cycle. Transport Reviews, 42(2), 204–221. https://doi.org/10.1080/01441647.2021.1958952
- Deng, T., & Nelson, J. (2011). Recent developments in bus rapid transit: A review of the literature. Transport Reviews, 31(1), 69–96. https://doi.org/10.1080/01441647.2010.492455
- Dillman, D., Smyth, J., & Christian, L. (2014). Internet, phone, mail, and mixed-mode surveys: The tailored design method (4th ed.). Hoboken, NJ: Wiley.
- Doyon, F. (2005). Rapport du coroner - Feu vert à la réouverture de la voie réservée du boulevard Pie-IX. Montréal: Le Devoir.
- El-Geneidy, A., Grimsrud, M., Wasfi, R., Tétreault, P., & Surprenant-Legault, J. (2013). New evidence on walking distances to transit stops: Identifying redundancies and gaps using variable service areas. Transportation, 41(1), 193–210. https://doi.org/10.1007/s11116-013-9508-z
- Fu, X., & Juan, Z. (2017). Understanding public transit use behavior: Integration of the theory of planned behavior and the customer satisfaction theory. Transportation, 44(5), 1021–1042. https://doi.org/10.1007/s11116-016-9692-8
- Guerra, E., Cervero, R., & Tischler, D. (2012). Half-mile circle: Does it best represent transit station catchments? Transportation Research Record: Journal of the Transportation Research Board, 2276(1), 101–109. https://doi.org/10.3141/2276-12
- Guest, G., MacQueen, K., & Namey, E. (2012). Applied thematic analysis. Thousand Oaks, CA: Sage.
- Hensher, D., Mulley, C., & Rose, J. (2015). Understanding the relationship between voting preferences for public transport and perceptions and preferences for bus rapid transit versus light rail. Journal of Transport Economics and Policy, 49(2), 236–260. Retrieved from https://www.jstor.org/stable/jtranseconpoli.49.2.0236
- Ignaccolo, M., Inturri, G., Giuffrida, N., Pira, M., & Torrisi, V. (2019). Public engagement for designing new transport services: Investigating citizen preferences from a multiple criteria perspective. Transportation Research Procedia, 37, 91–98. https://doi.org/10.1016/j.trpro.2018.12.170
- Ingvardson, J., & Nielsen, O. (2017). Effects of new bus and rail rapid transit systems – An international review. Transport Reviews, 38(1), 96–116. https://doi.org/10.1080/01441647.2017.1301594
- Lacerte-Gauthier, F. (2022). 13 ans et 520 millions $ plus tard, le service rapide par bus Pie-IX inauguré. Actualité Transports.
- Lai, W., & Chen, C. (2011). Behavioral intentions of public transit passengers—The roles of service quality, perceived value, satisfaction and involvement. Transport Policy, 18(2), 318–325. https://doi.org/10.1016/j.tranpol.2010.09.003
- Loong, C., van Lierop, D., & El-Geneidy, A. (2017). The path of least resistance: Identifying supporters of public and active transportation projects. Transportation Research Record: Journal of the Transportation Research Board, 2666(1), 94–102. https://doi.org/10.3141/2666-11
- Machado, J., de Ona, R., Diez-Mesa, F., and de Ona, J. (2018). Finding service quality improvement opportunities across different typologies of public transit customers. Transportmetrica A Transport Science, 14(9), 761–783. https://doi.org/10.1080/23249935.2018.1434257
- Mahmoud, M., & Hine, J. (2013). Using AHP to measure the perception gap between current and potential users of bus services. Transportation Planning and Technology, 36(1), 4–23. https://doi.org/10.1080/03081060.2012.745316
- Mattioli, G., Roberts, C., Steinberger, J., & Brown, A. (2020). The political economy of car dependence: A systems of provision approach. Energy Research & Social Science, 66, 101486. https://doi.org/10.1016/j.erss.2020.101486
- Miller, H. J., Witlox, F., and Tribby, C. P. (2013). Developing context-sensitive livability indicators for transportation planning: A measurement framework. Journal of Transport Geography, 26, 51–64. https://doi.org/10.1016/j.jtrangeo.2012.08.007
- Minser, J., & Webb, V. (2010). Quantifying the benefits application of customer loyalty modeling in public transportation context. Transportation Research Record, 2144, 111–120. https://doi.org/10.3141/2144-13
- Mugion, R., Toni, M., Raharjo, H., Di Pietro, L., & Sebathu, S. (2018). Does the service quality of urban public transport enhance sustainable mobility? Journal of Cleaner Production, 174, 1566–1587. https://doi.org/10.1016/j.jclepro.2017.11.052
- Nowell, L., Norris, J., White, D., & Moules, N. (2017). Thematic analysis. International Journal of Qualitative Methods, 16(1), 1–13. https://doi.org/10.1177/1609406917733847
- Pan, X. (2019). Repeated cross-sectional design. In D. Gu & M. Dupre (Eds.), Encyclopedia of gerontology and population aging. Cham: Springer.
- Pereira, R. (2019). Future accessibility impacts of transport policy scenarios: Equity and sensitivity to travel time thresholds for bus rapid transit expansion in Rio de Janeiro. Journal of Transport Geography, 74, 321–332. https://doi.org/10.1016/j.jtrangeo.2018.12.005
- Poncheri, R., Lindberg, J., Thompson, L., & Surface, E. (2007). A comment on employee surveys. Organizational Research Methods, 11(3), 614–630. https://doi.org/10.1177/1094428106295504
- Schweitzer, L. (2014). Planning and social media: A case study of public transit and stigma on Twitter. Journal of the American Planning Association, 80(3), 218–238. https://doi.org/10.1080/01944363.2014.980439
- Şimşekoğlu, Ö., Nordfjærn, T., & Rundmo, T. (2015). The role of attitudes, transport priorities, and car use habit for travel mode use and intentions to use public transportation in an urban Norwegian public. Transport Policy, 42, 113–120. https://doi.org/10.1016/j.tranpol.2015.05.019
- Singh, S., Javanmard, R., Lee, J., Kim, J., & Diab, E. (2022). Evaluating the accessibility benefits of the new BRT system during the COVID-19 pandemic in Winnipeg, Canada. Journal of Urban Mobility, 2, 100016. https://doi.org/10.1016/j.urbmob.2022.100016
- StatCan (2022). Census profile, 2016 census: Montréal [Census metropolitan area], Quebec and Quebec [Province]. Retrieved November 23, 2022, from https://www12.statcan.gc.ca/census-recensement/2016/dp-pd/prof/details/page.cfm?Lang=E&Geo1=CMACA&Code1=462&Geo2=PR&Code2=24&Data=Count&SearchText=Montreal&SearchType=Begins&SearchPR=01&B1=Journey%20to%20work&TABID=1
- StatCan (2023). Census profile, 2021 census. Retrieved May 23, 2023, from https://www12.statcan.gc.ca/census-recensement/2021/dp-pd/prof/index.cfm?Lang=E
- Stewart, O., Moudon, A., & Saelens, B. (2017). The causal effect of bus rapid transit on changes in transit ridership. Journal of Public Transportation, 20(1), 91–103. https://doi.org/10.5038/2375-0901.20.1.5
- STM (2022). PIE-IX BRT. Retrieved October 21, 2022, from https://www.stm.info/en/about/major_projects/major-bus-projects/pie-ix-brt
- TVA Nouvelles (2002). Encore un décès sur la voie réservée du boulevard Pie-IX. TVA Nouvelles.
- Umlauf, T., Galicia, L., Cheu, R., & Horak, T. (2016). Ridership estimation procedure for a transit corridor with new bus rapid transit service. Journal of Advanced Transportation, 50(4), 473–488. https://doi.org/10.1002/atr.1355
- van Lierop, D., & El-Geneidy, A. (2017a). Enjoying loyalty: The relationship between service quality, customer satisfaction, and behavioral intentions in public transit. Research in Transportation Economics, 59, 50–59. https://doi.org/10.1016/j.retrec.2016.04.001
- van Lierop, D., & El-Geneidy, A. (2017b). A new market segmentation approach: Evidence from two Canadian cities. Journal of Public Transportation, 20(1), 20–43. https://doi.org/10.5038/2375-0901.20.1.2
- Van, H., Choocharukul, K., & Fujii, S. (2014). The effect of attitudes toward cars and public transportation on behavioral intention in commuting mode choice—A comparison across six Asian countries. Transportation Research Part A, 69, 36–44. https://doi.org/10.1016/j.tra.2014.08.008
- Vavrova, M., & Chang, C. M. (2019). Incorporating livability into transportation asset management practices through bikeway quality networks. Transportation Research Record: Journal of the Transportation Research Board, 2673(4), 407–414. https://doi.org/10.1177/0361198119840610
- Venter, C., Jennings, G., Hidalgo, D., & Valderrama-Pineda, A. (2017). The equity impacts of bus rapid transit: A review of the evidence and implications for sustainable transport. International Journal of Sustainable Transportation, 12(2), 140–152. https://doi.org/10.1080/15568318.2017.1340528
- Ville de Montréal (2008). Plan de Transport | 2008. Montréal: Ville de Montréal.
- Wang, X., & Cheng, Z. (2020). Cross-sectional studies: Strengths, weaknesses, and recommendations. Chest, 158(1S), S65–S71. https://doi.org/10.1016/j.chest.2020.03.012
- Wijaya, S., Imran, M., & McNeill, J. (2017). Multi-level policy tensions in bus rapid transit (BRT) development in low-income Asian cities. Transportation Research Procedia, 25, 5104–5120. https://doi.org/10.1016/j.trpro.2018.02.040
- Wirasinghe, S. C., Kattan, L., Rahman, M. M., Hubbell, J., Thilakaratne, R., & Anowar, S. (2013). Bus rapid transit – A review. International Journal of Urban Sciences, 17(1), 1–31. https://doi.org/10.1080/12265934.2013.777514
- Zhao, J., Webb, V., & Shah, P. (2014). Customer loyalty differences between captive and choice transit riders. Transportation Research Record: Journal of the Transportation Research Board, 2415(1), 80–88. https://doi.org/10.3141/2415-09