
 ?Mathematical formulae have been encoded as MathML and are displayed in this HTML version using MathJax in order to improve their display. Uncheck the box to turn MathJax off. This feature requires Javascript. Click on a formula to zoom.
Abstract
We analyse the relationship between various elements of walkability and real estate transaction price with a hedonic approach to understand which factor influences the real estate transaction price. We use detailed and directly measurable data of real-estate transaction price and walkability based on the City of Vienna government open data, which became recently available. With this large dataset, we analyse the relationship with several subsets of the samples, e.g. stratified by approved building height (low or high) and with certain land use types e.g. residential or industrial/commercial, to understand context-dependent importance of different walkability elements reflected in the real-estate transaction price. The valuation of walkability is potentially different in different urban contexts. The pedestrian-friendliness in a near proximity, such as the ratios of walkable pavement, greened pavement and beautified pavement, are more nuanced in low-rise and residential areas than high-rise and industrial or commercial areas when it comes to land transaction prices. A similar conclusion can be drawn for the trees, too. This may open up a potential for financing publicly funded walkability improvements if such additional value can be monetized as e.g. property taxation or property transaction taxation is introduced.
1. Introduction
Walking is the most fundamental form of human mobility. Ultimately, any trip starts and ends with walking, even when the vehicular part typically covers the longest stretch within it. In light of the recent diffusion of goal-oriented transport planning approach (e.g. Banister, Citation2008; Litman, Citation2013), and in particular of Sustainable Urban Mobility Planning (Rupprecht et al., Citation2019; Wefering et al., Citation2013), walking has gained much attention as a transport mode of no energy consumption (except for energy consumed within human body), no greenhouse gas emission and positive impacts on human health. Setting future modal share goals covering sustainable modes of transport is becoming widespread in the Sustainable Urban Mobility Planning context (e.g. Shibayama, Citation2020) and here walking is, besides cycling and public transport, an important element for the goal-oriented planning approach. For public transport, walking is the most important access and egress means of transport, and thus walking also plays an important role here, not only as a self-contained door-to-door means of transport, too (e.g. Daniels & Mulley, Citation2013).
Besides the contribution to the sustainability of transport, enhancement of walking environment – or walkability – contributes to the society as recognized explicitly or implicitly embedded in different contexts. For example, in urban planning, New Urbanism (e.g. Congress for the New Urbanism, Citation1996; Falconer Al-Hindi, Citation2001; Marshall, Citation2003) and Placemaking (e.g. Aravot, Citation2002; Strydom et al., Citation2018), as well as the emerging concept of Superblock (Cities4Forests, Citationn.d.) and 15-Minutes City (e.g. Allam et al., Citation2020), all emphasize the human-scale urban development: in these contexts, walking plays a central role as the most human-scale means of transport both in terms of distance covered by it and its speed of 4–6 km/h. It has recently become widely known that walking contributes greatly to human health through everyday activities of transport (e.g. Hanson & Jones, Citation2015; Maki et al., Citation2012) and eventually contributing to less healthcare costs to the society (e.g. Gössling et al., Citation2019; H. Zheng et al., Citation2010). In the context of transit-oriented development, quality of walking as well as urban density is much stressed recently as an important enabler of higher ridership and housing prices (e.g. Cervero & Dai, Citation2014; Cervero & Murakami, Citation2009) as well as a contributor to mixed land use (e.g. Chorus & Bertolini, Citation2016) and less car dependency (e.g. Newman & Kenworthy, Citation1996).
One of the characteristics of walking is that, unlike other modes of transport, it is essentially free of charge for users. Motorized modes of transport can be monetized thorough e.g. taxations and user charges as well as by means of the fuel, but such means are generally not available for active modes. In the context of New Mobility Services (e.g. Shibayama & Emberger, Citation2020), user charges can be implemented for other types of active modes e.g. shared bicycles and alike, but walking is out of the scope here, too. As discussed more in detail in Section 2, many reported impacts such as the increase of sales and health impacts are attributed to the better walkability. Under the competitive land market, better walkability is known to be capitalized onto the real estate prices.
The City of Vienna recently published a historical data of the transaction prices of plots of land registered in the city through the Austrian Open Government Data Platform (www.data.gv.at), as well as various data on urban infrastructure that walkability can be attributed to. This dataset is the primary data that is registered to and maintained by the city government and thus they seem to be highly reliable and (almost) complete, hence highly representative. In the research presented in this paper, we explore this dataset, combined with other relevant dataset obtained from other reliable sources available in Austria to understand to what extent the value of better walkability is captured in the real estate transaction price. As explained in Section 3 in detail, we aim to understand which infrastructural and other attributes associated to walkability contributes to the real estate transaction prices and to what extent they do.
The reminder of this paper is structured as follows. After a literature review in Section 2, we describe our methodology and data in Sections 3. In Section 4, we present our analysis results, and in Section 5 we discuss the analysis results. Section 6 draws a conclusion of this paper.
2. Literature review
As reviewed by Maghelal and Capp (Citation2011), various walkability indices are proposed from different perspectives, using various relevant variables such as sidewalks, carriageways, crossings, vehicles, comfort and safety. This is further reviewed and discussed by Baobeid et al. (Citation2021), identifying three types of walkability measure types i.e. objective ones (e.g. GIS-based and audit-based ones, mixed land use, sidewalk width and street connectivity, and built environment), subjective ones (e.g. self-reporting, interviews, GPS traces, and walking behaviour) and distinctive ones (e.g. observations and invisible correlations). Among the objective ones, besides the approaches focusing on various urban and infrastructural aspects, Labdaoui et al. (Citation2021) proposed what they call Comfort Walkability Index, which incorporates physiological equivalent temperature, in their research and case study in Algiers, Algeria.
Reflecting these developments of the walkability studies, in recent years, the value of walkability in cities have been estimated in frameworks using such walkability indices calculated from various factors of walkability such as access to amenities (e.g. stores), availability of sidewalk, etc., as the explanatory variable of interests in different types of cities (Li et al., Citation2015; Wang & Rasouli, Citation2022; Yin et al., Citation2020).
Impact of walkability to other related aspects have been empirically researched from various perspectives. Particularly well researched are the relationships between indexed walkability and human physical activities, such as the one by Frank et al. (Citation2005) focusing on Atlanta, the US, Sundquist et al. (Citation2011) on Sweden and McCormack et al. (Citation2012) in Canada. Gan et al. (Citation2021) analysed the relationship between walkability as well as built environment and access mode to public transport in Nanjing, China. Jun and Hur (Citation2015) analysed the relationships between social capital among residents and subjective as well as objective walkability indices in Ohio, the US.
In relation to the real estate valuations, Cortright (Citation2009) analysed the relationship between house transaction prices and the Walk Score, an index representing walkability, using more than 90,000 house transaction data in 15 cities in the US, concluding that the Walk Score has positive impacts on housing prices in 13 cities among them. Rauterkus and Miller (Citation2011) also analysed the relationship between the Walk Score and the real estate transaction prices in Alabama, US. Similarly, Pivo and Fisher (Citation2011) also analysed the relationship between the Walk Score and the real estate transaction prices using the data from National Council of Real Estate Investment Fiduciaries in the US.
More generally in an urban scale, Shamsuddin et al. (Citation2012) discussed the impact of walkability on urban liveability and further on economic activities. Focusing on the context of sustainable urban development, Blečić et al. (Citation2020) categorized the factors of walkability into four groups, namely Efficiency and Comfort, Safety, Security and Certainty, and Pleasantness and Attractiveness.
Walkability of urban streets constitutes the surroundings of real estate, and thus this may be reflected in the monetary valuation of real estates. To evaluate the consumers’ willingness to pay for goods and services that are not traded in markets as implicit price of the marketed goods, Hedonic Pricing Method has been widely applied since Rosen (Citation1974) proposed its theoretical framework and numerous studies including Blomquist and Worley (Citation1981) improved its applicability as a tool to evaluate housing amenities.
Following these methodological developments, the hedonic approach (HA) is one of the most frequently used approaches to estimate the impacts of specific environmental attributes on real estate price (Garrod & Willis, Citation1992; S. Zheng et al., Citation2014). It is often used to estimate quantitative values for the elements which may affect the market prices for homes. Generally, the real estate is monetarily valuated by the characteristics of the property itself (e.g. its size and location) and its surroundings (e.g. accessibility and amenities located around it).
In the contexts related to walkability and neighbourhood amenities, numerous studies assessed their impacts on property values: additional green spaces (Geoghegan, Citation2002) and the transformation of urban land use from highways to greenspace or surface roads (Cervero et al., Citation2009; Tajima, Citation2003) increase property values around them, and the impacts on residential property prices vary by different types of landscape and vegetation (Belcher & Chisholm, Citation2018; Chen & Jim, Citation2010).
These research, however, mostly focuses on a single or a few urban amenity/amenities and to the best of our knowledge, none has explored the valuation of real estates with many facets of walkability taken into consideration at once as of yet: this is somewhat surprising in light of the aforementioned growing body of scholarly literature on walkability. This also means that relative influences of the various elements of walkability on real estate price are largely unexplored. Furthermore, the variations in the impact of walkability on land transaction prices across different urban contexts, particularly in relation to land use regulations, remain largely unexplored, either. To what extent do the various facets of walkability influence on land transaction prices? Which walkability elements are strongly reflected in land transaction prices? Do they influence uniformly or differently, depending on different urban environments such as low and high density or in residential and commercial areas? With the advantage of the government open data that can be used to construct a variety of locational features, our research presented in this paper aims to address these research questions.
3. Methodology and data
3.1. Overview
In practice, as the hedonic approach (HA) is adopted, real estate transaction price is regressed by the indices of the characteristics of the property itself and its surroundings. In the walkability context, our study presented in this paper is a further development of the lines of the aforementioned researches by Cortright (Citation2009), Rauterkus and Miller (Citation2011) and Pivo and Fisher (Citation2011). However, instead of using an aggregated index like the Walk Score as they did, we use various factors of walkability form government open data published by the City of Vienna, which has become available recently, to understand which factor influences the real estate transaction price. The Walk Score is an aggregated score value on the distance to the nearby amenities (schools, hospitals, restaurants, etc.), while our study uses much detailed and directly measurable data about Neighbourhood Amenities and Ambient that affect Walkability (NAAW). As explained below in detail, such directly measurable NAAW data, like trees on public spaces and road surface materials well serves as a proxy of the urban parameters subject to policy intervention. Ultimately, we hope that our research help understand which walkability factors that can be directly intervened by urban or transport policy are important to be monetized to finance public investment on improvement of walkability indirectly through increased valuation of real estate, thus contributing to better strategic decision making for sustainable urban mobility planning.
In light of this, in our research, as a dependent variable, we used the real estate transaction price derived from the aforementioned government open data. One of the important novelty in our research is that we utilized the large number of geolocated real estate transaction records, and we spatially joined them to the NAAW attributes. This enables us to understand if the impacts of walkability indices differ by different subgroups of samples. This is explained more in detail in Section 3.2.
Another important novelty of this study is to incorporate various NAAW data to explore and understand which element of walkability is influential to real estate transaction price. To analyse different extent of the influence of NAAW, we focused on the objective factors of walkability (c.f. Baobeid et al., Citation2021) that can be derived from the available open data. We collected four types of data: real estate transaction price, sociodemographic, geolocational and walkability data. To construct the dataset, we geocoded the real estate transaction price data and spatially joined it with sociodemographic, geolocational and walkability indices as explanatory variables.
To control the characteristics of accessibility to public transport, we used Public Transport Service Quality Level (PTSQL) data as explained in section 3.5.2 in detail. This is a standardized definition of service quality of public transport given to any point in Austria, depending on the service level at each station/stop and on the distance. Furthermore, we incorporated a number of NAAW indicators obtained from the Austrian government’s open data platform and other online sources into a GIS as explained more in detail in the following sections. Combined with the geocoded transaction data, we calculated various NAAW indicators for each point of transaction. This is further explained in Sections 3.3 and 3.4.
3.2. Real estate transaction price data (dependent variable)
The City of Vienna collects real estate transaction price data and publishes on the Austrian Open Government Data Platform (www.data.gv.at). This dataset (Kaufpreissammlung Liegenschaften Wien - Collection of purchasing prices of real estate transactions in Vienna) includes the transaction price of real-estate transactions across Vienna registered in the City’s land register between 1973 and 2021 (57,912 records in total) at the time of our research. The dataset includes attributes to each of the transacted lots, such as street address, area size, transaction date, land type at the time of transaction (e.g. unbuilt land, land with house for rent and land with two-family house), land purchaser type (private sector, public sector, etc.), land-use regulation (Widmung in German: residential building, commercial building, etc.), building restrictions (if available) and transaction price.
First, using the street address, we geocoded each of the transaction data using the City of Vienna Geocoding API (Stadt Wien, Citation2021). This API returns the precise decimal coordinates of the main entrance point to the building or to the plot. This enables to join the transaction data on other attributes that can be obtained on a geolocation basis using GIS. Of note, in case the place of transaction has had no building up until the time of the transaction and thus no street address is assigned, the street address field in the transaction datasets contains the nearby existing street address as a proxy such as an object next to it or on the opposite side of the street. This feature, combined with the Geocoding API, enables relatively precise geocoding even if the object has no street address.
In addition, for our analysis, we filtered the data to unbuilt land (unbebaut), following Wieser (Citation2006). This is because the dataset only contains the total transaction price, and thus it is impossible to split the value of building and land itself if the transaction is made with building. Furthermore, to enable the stratification with the building restrictions in a later phase, we filtered the datasets to the records containing the attribute of building restriction information. This excluded the data in the outside of constructable areas, while such areas are generally for non-urban use such as farmland and forest, and thus these are out of the scope of this analysis. We further limited to the transaction data from 2010 or later, because the NAAW and other variables that are joined on this dataset are mostly as of between 2018 and 2021 and using too old data as dependent variables may reduce the reliability of the estimation results.
After these filtering process, the transaction prices are deflated by monthly consumer price index (data from Austrian National Statistics Bureau; reference month being January 2005). Then, we calculated transaction price per square metre for each transaction to be used as our dependent variable. 213 transaction records do not contain land area information, and thus we omitted them from our dataset. These resulted in 3,453 records to be used in the further steps.
shows the locations of the transaction dataset. The figure shows that many transactions in the dataset took place in the suburban areas with the building restrictions I or II, which are for the single-family houses and row-rise apartments. Besides, shows annual average price of transactions per square metre in the dataset. It shows that Vienna’s real estate market has been stimulated around 2015 and average transaction prices has been gradually increasing since then.
Figure 1. Locations of the land plots in the transaction price dataset, subdivided by building restriction types (see Appendix for building codes).
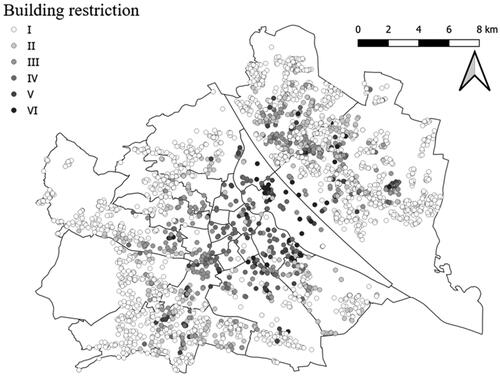
Table 1. Yearly average transaction price per square metre.
3.3. Additional variables derived from transaction dataset
As mentioned above, the transaction data itself contains various attributes of the plots. We used seven of them: transaction year, transaction month, actual land use label (32 classifications), land use code according to the spatial planning (“Widmung”: uniform land use only (residential/business) or mixed use possible), building restriction and District.
The District variable is used to subdivide Vienna into the following four areas:
Area 1: 1st District (within the Ring; historical centre)
Area 2: 2nd to 9th and 20th Districts (within the Gürtel, the second ring road; areas urbanized by the end of 19th Century)
Area 3: 10th to 19th and 23rd Districts (outside the outer ring and south of the Danube)
Area 4: 21st and 22nd Districts (northeast i.e. the left bank of the Danube; urbanization started in the early 20th century but rapid development took place since the 1970s).
Besides, the interaction term between PTSQL and area dummy was introduced as we hypothesized the accessibility impact (in terms of public transport) may differ from areas to areas.
3.4. Neighbourhood amenities and Ambient that affect walkability (NAAW) data
Five NAAW indicators were collected and calculated from the City of Vienna open data portal and data published by Austrian Chamber of Commerce (Wirtschaftskammer Österreich, WKO) as summarized below.
3.4.1. Total, walkable, green and beautified pavement
On the Austrian open data portal, the City of Vienna provides the data of road surface types. This data is a Shapefile (polygon) of the entire road surface within the boundary of the City of Vienna classified into 22 different surface types containing more than 700,000 fractions. Using this data, the ratio of Walkable, Green and Beautified Pavement Areas within the 300 m buffer polygons was calculated for each of transaction data. We defined Walkable Areas as tactile paving, entranceway, footpath, pedestrian zone, sidewalk, entrance to the apartment houses (part of the sidewalk where vehicles entering to adjacent land plot crosses), traffic islands, cycling road, stairs and unpaved roads: these are where people are allowed to or likely to walk on. Green Areas are defined as flower bed and shrubbery. Beautified Pavement Areas are defined as granite, small stone pavement, large stone pavement with joint grouting and natural stones pavement. These materials are often used on a mixed street surface both for pedestrians and vehicles, while vehicle speed is typically low. Of note, when calculating the ratio of Walkable Pavement, we excluded areas on arterial roads. In Vienna, the traffic speed limit is set to 30 km/h on most of the roads, while that for arterial roads are set to 50 km/h. For walkable pavement, we only included the areas where the car speed is limited to 30 km/h using another open-government dataset (“Tempo-30-Zonen”) to prevent the impact of such wide and traffic-intensive roads. Green and Beautified Pavement areas are not limited to 30 km/h zones. In addition, the entire road surface areas which consist of 22 different surface types (differentiated by materials) within the 300 m buffer polygons are calculated as area of pavement nearby. This is intended to serve as an indicator for the choice of walking routes near the properties’ surroundings.
In relation to the previous research, the surface of (walkable) pavements results can be considered as an alternative to the intersection density index (IDI: see Shashank & Schuurman, Citation2019). In addition, as larger areas of pavement nearby indicates that there are abundant access roads for urban amenities nearby on foot, it may serve as a proxy of Pedestrian Route Directness Index (PRD: see Stangl, Citation2012). However, these two indices on the road network itself rather than the quality of the urban street. The surface of the pavement as a whole or in the aforementioned categories represent the quality of the urban infrastructure in a more direct manner than these indices. As additional street for the sake of better walkability is rather unthinkable in the real-world policy-making context, these are more directly relevant when it comes to policy-making to enhance walkability.
3.4.2. Land use diversity index
Land use mix is considered as an important element of the walkability (Baobeid et al., Citation2021) and Herfindahl-Herschman Index (HHI), which initially was developed to describe market monopoly, has been applied to calculate land use diversity (Clifton et al., Citation2009). HHI is the sum of the squares of the percentages of each land use in an area of concern. The higher HHI is, the lower level of land use mix is. When only one land use type exists in the area (land-use “monopoly”), the value of the HHI equals to 10,000.
We calculated HHI using the land use data within network-based 300 m buffer polygons (see ) for each point of transaction. The network-based 300 m buffer is an isochron (contour) on the street network that is reachable within approximately 5 min on foot. We used QGIS QNEAT3 plugin to calculate it for each transaction record.
Figure 2. Example of network-based 300 m buffer and the location of urban amenities nearby.
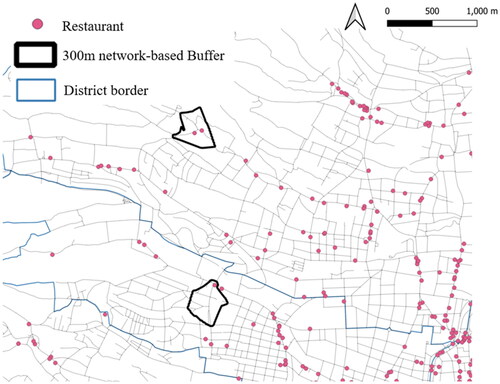
3.4.3. Urban amenities
Urban amenity data was calculated using the network-based 300 m buffer. The NAAW indices include the area of parks (sq. m), the number of trees, the number of restaurants and the number of streetlights within the buffer. The area of parks and the number of trees correlate with the greenery and playable areas to go out during the leisure time. The number of restaurants nearby may serve as a proxy for urban amenities nearby (e.g. Glaeser et al., Citation2001). The number of restaurants represents the number of attractive destinations within the walking distance, and the number of streetlights shows the sense of community safety. Park, tree and streetlight data is derived from the City of Vienna open data portal, and the number of restaurants data is derived from the WKO website. In Austria, almost all merchants join WKO, and thus the data can be considered comprehensive.
3.4.4. Plots directly on arterial roads
From the road network data published by the City of Vienna, attributes about the nearest road from each of the transaction points are extracted, whether the road is maintained by the City of Vienna directly (arterial roads) or by the Districts (secondary road). As the geocoding service derives the coordinates of the main entrance (see above), this adds the information about the type of the road that each land plot primarily faces (1: arterial road, 0: secondary road).
3.4.5. Sidewalk width
Similarly, sidewalk width classification data (binary classification of 1: width > 2 m, 0: otherwise) is extracted from the City of Vienna open data portal. The classification of the nearest road from each of the transaction points are joined on. This represents whether the road in front of the main entrance possesses a sidewalk that corresponds to the required width according to the current Austrian technical standard (Österreichische Forschungsgesellschaft Straße–Schiene–Verkehr, Citation2015).
3.5. Other explanatory indices and variables
3.5.1. Population density and land use
From previous research, it is known that population density positively correlates walkability (C. Lee & Moudon, Citation2006; McCormack et al., Citation2012) through a sense of community and safety from crime and through attracting entertainment and recreational amenities (Baobeid et al., Citation2021). As such, population density is supposed to be significantly associated with walkability and potentially correlate with real estate transaction price. Considering this, as sociodemographic data, we used population density from the National Statistics Bureau of Austria (“Statistik Austria”). In Austria, population density data is calculable for statistical population counting areas (Zählsprengel, ZSP). This is one of the smallest statistical units and divides Austria into approximately 8,000 units. Population density of a ZSP where each transaction data is located is joined on.
As for the land use, the real land use information as of 2018, which is used to calculate HHI (c.f., Section 3.4.2) were spatially joined to the location information of real estate transaction data so that what type of actual land use has been realized at the traded real estate.
3.5.2. Accessibility to public transport
Accessibility to nearby public transport is an important determinant of the real estate price. For this, Public Transport Service Quality Level (PTSQL; ÖV-Güteklassen; Hiess, Citation2017) is used in our analysis. PTSQL is advantageous to conventional distance-based indices because it does not only consider the distance from stations and stops, but also the service frequency and the types of public transport services (e.g. intercity trains, suburban trains, underground, trams and buses). For Austria, the national coordinating institution for spatial planning (Österreichische Raumordnungskonferenz: ÖROK) defined the classifications, and it comprises of both the distance from public transport stops and the service level at the stops. It classifies areas into eight classes, from A (highest accessibility) to G (lowest accessibility) and the areas without classification label (realistically no accessible public transport is available). Vienna is mostly covered by the area classes A to D, but in the outskirts (e.g. outer green area), areas without label exist.
3.6. Final dataset for analysis
In the process summarized in Sections 3.2 to 3.3, 54 records had to be further omitted from analysis because we could not geocode the address information of transaction data correctly and thus could not spatially join the NAAW data. Furthermore, 23 transaction records in the outside of the PTSQL classifications are excluded: this is because, in the Viennese context, such area outside of the PTSQL classifications is likely to be a cropland or forest (Wienerwald, Vienna Woods) and thus they are deemed to be outliers. Of the 3,453 records from the real estate transaction data (c.f. Section 3.2), 3,376 are thus used in the further analysis. summarizes the descriptive statistics of this final dataset before standardization.
Table 2. Descriptive statistics of the dataset (before standardization).
4. Analysis
4.1. HA model
Following HA, the specification is defined as below:
(1)
(1)
where
is the transaction price (per sq. m.) at place i and year t;
is the covariate vector;
is a time (year and/or month) fixed effect;
is the error component following an independent normal distribution;
and
are unknown coefficients. As we analysed the distribution of the transaction prices in a simplified manner using histograms, the logarithm of our transaction price dataset is approximated to the normal distribution. Therefore, we used the logarithm of
in our model.
Besides the baseline regression with pooled dataset (Model 1), we conducted two stratifications, namely one with building restrictions (Model 2) and land use (Model 3). Building restrictions (Bauklasse) in Vienna is a municipal regulation for the maximum height of buildings determined by several variables and is classified into six classes from I to VI as summarized in the Appendix (). The lot with lower building restriction classes (I and II; following Wieser, Citation2006) is mainly for residential use (more likely one- to two-story residential buildings rather than multistory apartment buildings) and the lots with higher building restriction classes (III to VI) are for higher apartment buildings or commercial complexes. Therefore, we used building restrictions for stratification as we assumed that the mechanism for determining land price may differ between areas with lower and higher classes. The other stratification by land use assumes that the residential and industrial/commercial land use are likely to have different pricing mechanism. Furthermore, all variables except dummies are standardized (transformed so that they follow standardized normal distribution) so that we can compare the estimated coefficients.
4.2. Model 1: estimation with all data
First, the parameters of the model as formulated with EquationEquation (1)(1)
(1) is estimated with all data. shows the estimation results. Model 1-1 uses all available variables to estimate, while Model 1-2 drops some variables by stepwise regression. Both Models 1-1 and 1-2 have significant positive estimates for four NAAW indicators: the number of restaurants (REST_NUM), population density nearby (POPDEN), the area of paved road surface nearby (PAVEMENT) and the beautified pavement ratio nearby (PAVEMENT_BEA). Additionally, Model 1-2 has weakly positive and significant estimates for the greened pavement ratio nearby (PAVEMENT_GR_ratio). Both Models 1-1 and 1-2 have weakly significant negative estimates for the road class (ROADCLASS). If coefficients are focused, the area of pavement nearby (PAVEMENT) is much larger than those of other significant variables. For example, compared to REST_NUM and POPDEN, the estimated coefficient for PAVEMENT is approximately 1.5 to 2 times larger.
Table 3. Estimation results of Models 1-1 to 1-2.
The area of total paved road surface nearby, which is a proxy for the choice of the routes near the properties’ surroundings, is estimated to be positively significant. Further, the ratio of beautified pavement represents to what extent the surrounding environments make walking more pleasant. In addition, it is worth noting that the index of land use mix (LANDUSE_HHI) has insignificant estimates, which implies that among walkability indices, the land use diversity does not affect the land price.
4.3. Model 2: stratification by building restrictions
As a next step, inspired by the research by Shashank and Schuurman (Citation2019), we estimate the Model with stratified datasets by building restrictions. Model 2-1 only uses transaction records with building restrictions I or II, which indicates the land plot with lower height limitation and Model 2-2 applied stepwise regression to Model 2-1. Model 2-3 uses records with building restrictions III to VI, which indicates those with higher height limitation, and Model 2-4 applied stepwise regression to Model 2-3. The results are summarized in .
Table 4. Estimation results of Models 2-1 to 2-4 (stratification by the building restrictions).
Related to transport infrastructure, the area of pedestrian-friendly areas (PAVEMENT_W_tempo30) is positively estimated in the low-story areas (Models 2-1 and 2-2), while it is negatively significant in high-story areas (Models 2-3 and 2-4). The number of restaurants is (weakly) positively significant only in Model 2-4, and the land use mix (LANDUSE_HHI) is positively significant only in Models 2-1 and 2-2.
A result worth noting here is that the area of parks nearby (PARK_AREA) and the number of trees (TREE_NUM) have different signs between Models 2-1/2-2 and Models 2-3/2-4. As both indicates how much greenery exists in the neighbourhood, one possible explanation is that they may cancel each other out to some extent. Another observation is that, in the Model with low-height building restrictions (Models 2-1 and 2-2), the park area is estimated to have negative impact while the number of trees is estimated to have positive impact. This becomes opposite in case of high-height building restrictions (Models 2-3 and 2-4).
4.4. Model 3: further analysis with land use-based subgroups
Finally, we conduct another analysis using the subgroups of dataset, grouped by the land use. The results are shown in Models 3-1 to 3-4: Model 3-1 uses records with residential land use, and Model 3-2 applied stepwise regression to Model 3-1. Model 3-3 uses records with industrial/commercial land use, and Model 3-4 applied stepwise regression to Model 3-3. The results are shown in .
Table 5. Estimation results of Models 3-1 to 3-4 (stratification by the land use).
The estimated coefficients between Models 3-3 and 3-4 differs significantly. In industrial and commercial areas, fixed effect of PTSQL, area and the interaction term of PTSQL and area dummy is deleted during the stepwise regression. There is little difference in terms of accessibility in industrial/commercial areas, as the City of Vienna’s policy allows commercial and industrial land use only within the vicinity of public transportation (300 m). Furthermore, most of the public transport stops in Vienna have transportation services at least every 30-min interval, leading to relatively higher PTSQL classifications. Another potential reason is that the sample size of Models 3-3 and 3-4 might be insufficient in commercial and industrial areas.
We can observe clear differences in the NAAW estimates between the residential and industrial/commercial areas. First, the land use mix index (LANDUSE_HHI) is positively significant in the residential area but negatively significant in the industrial/commercial area. As the lower HHI means more diversity in land use (less “monopoly”), the positive estimate of coefficient indicates that the diverse land use leads to lower land transaction prices in residential areas. Oppositely, the result implies that the diverse land use in the industrial/commercial areas leads to positive effects in land transaction prices.
The number of restaurants nearby is positively significant only in the residential areas. It implies that the walkability impact through urban amenities may be considered important only in the residential areas. Furthermore, as is the same with the subgroups for building restrictions (Model 2), the area of parks nearby and the number of trees have different signs between Models 3-1/3-2 and Models 3-3/3-4, potentially because of the same mechanism as discussed in the previous section (Section 3.3).
5. Discussion
5.1. Transport and mobility NAAWs on land transaction price
In this study, we investigated the effect of Neighbourhood Amenities and Ambient that affect Walkability (NAAW), namely urban amenities, population density, total paved road surface, the ratio of walkable-friendly pavement nearby and land use diversity on land transaction price. Overall, such variables positively influenced the transaction price, while the results from model estimation with stratified datasets show different tendency depending on the context.
In terms of the general pedestrian-friendliness of the surroundings, the total paved road surface within a near proximity of the point of land transaction has overall positive impact on transaction price in the estimation with all data in the dataset (c.f. Model 1). This result is in line with our initial hypothesis in that larger area of road surface nearby indicates that there are more abundant options for place to walk. However, the level of significance differs when the data is stratified, and the model estimation with the land transaction data of commercial and industrial land use (Model 3-3 and 3-4) shows negative impacts of the paved road surface area. Overall, the positive effect of the area of the paved road surface area within near proximities on the land transaction price is more nuanced among residential type of plots, both in low- and high-density contexts.
The ratio of walkable areas (PAVEMENT_W_tempo30) is estimated to be insignificantly positive when estimated with all data in the dataset (Model 1), while this, as well as beautified pavement, becomes significantly positive in the estimation of low-story context (Model 2-1, as well as 2-2). Albeit not significant, this is also the case of residential land use (Model 3-1). The ratio of greened and beautified pavement nearby is estimated to influence on land transaction price positively and significantly when estimated with all data in the dataset (c.f. Model 1). The ratio of pedestrian-friendly pavement, greened pavement and beautified pavement is estimated to positively influence land transaction price in the low-story and residential areas (c.f., Models 2-1 and 3-1), but not in the high-density or commercial/industrial areas (c.f. Models 2-3 and 3-3, as well as elimination in the Models 2-4 and 3-4). These results implies that these three particular types of pavements, which can be interpreted as a more direct proxy of walkable pedestrian areas nearby, influence land transaction price positively as a “top-up” to the pedestrian area itself. As our model estimation is based on the land transaction prices, the result poses a question if different property buyers take walkability elements into consideration for land plots differently. For example, if the estimation results of Model 2-1 and Model 2-3 are compared, the former type is more likely bought by individuals or families, while the latter is more likely to be bought by institutionalized buyers like real estate agencies and land developers. This could be a potential future research topic.
As such, as for the overall tendency, the size of the paved road surface in a near proximity have positive impacts (larger modulus of estimated coefficients) than the other NAAW, but the stratified results bring about additional insights into the different effects depending on the contexts. The area of the paved road surface contributes to the higher land transaction price more strongly in high-density and commercial and industrial contexts and less in low-density and residential contexts. In a policymaking and financing context, this result implies that the improvement of walkability can be better monetized in such high-density and/or commercial and industrial contexts. At the same time, this result may also imply that what people valuates in terms of walkability may largely differ depending on different contexts within a city. This poses a further question of what elements are involved in walkability in different contexts: this may be a potential future research question.
The results around the other NAAWs on transport and mobility are in line with the intuitive directivity. In commercial and industrial contexts (Models 3-3 and 3-4), facing to the arterial roads have positive impacts to the land transaction price, but in the other context (Models 3-1 and 3-2), it is estimated to be negative. The results about sidewalk in front of the property’s main entrance estimated to be negative is somewhat contradictory to the intuition, but this may be because of the binary coding (wider than 2 m or not) which originates from the government open data we use in this research. In the residential context, this might correlate with the total width of the street itself, and thus further in-depth investigation is called for. To do so, application of more comprehensive method to incorporate accurate sidewalk width (c.f. Brezina et al., Citation2017) may be a potential development of this research.
5.2. Urban green NAAWs on land transaction price
We included a number of non-transport and non-mobility NAAWs in the model estimation. In this and next section, we discuss the results associated to them. These NAAWs are somewhat related to, for example, street design and thus still much relevant to the transport infrastructure of cities, but they are not a part of transport infrastructure in a strict sense.
Trees and urban greens are important elements often discussed in association to walkability (e.g. S. Lee, Citation2021, discussing relationship between tree canopies, neighbourhood walkability and street crime), but in our model, the number of trees and the area of parks nearby are estimated differently. Generally, the number of trees is estimated to have positive effects on the land transaction price, while the area of parks is estimated negatively. This is the case in Models 1-1 (all data), 2-1 (low-story building restriction) and 3-1 (residential land use). The opposite positivity and negativity are estimated for the models for the plots where high-story buildings are allowed (Model 2-3) and commercial and industrial land use (model 3-3).
There seems a different impact based on vegetation type; namely that of well-managed plantings (pruned, like street trees, etc.; proxied by the number of trees in this study) and of near-natural green spaces (such as conservation green spaces, etc.; proxied by the park area), as described in Belcher and Chisholm (Citation2018). They classified vegetations into conservation value vegetation, managed vegation and spontaneous vegetation and investigate the different impacts of each vegetation type. It has to be noted that, in this study, only nearby park areas (within only 300 m along the road network) are considered in the estimation. As there is a trade-off between the nearby park areas and other urban amenities (stores, etc.), this 300 m threshold, which corresponds to c.a. 5 min walking distance, brings about such trade-off effects more strongly into the estimation rather than the positive benefit of the parks. There may be a dividing effect of large-block and enclosed facilities bringing walkability lower, as discussed by C. Lee and Moudon (Citation2006), too. Of note, a potential negative valuation may additionally come from the fact that parks within the built-up areas become where teenagers hang out, leading to crimes or any unfavorable incidents, but this is deemed rather rare in Vienna’s context where social workers take much care of them, and parks are generally kept well managed and safe.
As such, as is the case of the walkable pavement ratio (c.f., the previous section), there might be different valuation of trees and parks in a near proximity on the land transaction price. This implication is especially the case when Models 2-1 (low-story building restriction) and 2-3 (high-story building allowed) are compared. In the low-rise areas, where each land plot tends to be small but typically have a surface for own (private) gardens, urban greeneries may be evaluated by the properties’ green themselves rather than the park nearby, and trees in a near proximity is valuated for walkability itself. In contrast, in the high-rise areas, where single land plot tends to be much larger and gardens and private greens are often shared among many people, the area of park has positive effect as greeneries while the number of trees in near proximities have a proxy effect of main streets with higher traffic volume. In Vienna’s centre, where high-rise buildings are allowed, trees are often lined with the main street with relatively high vehicular traffic volume, while trees on secondary streets with low traffic volume is rather rare.
The impact of trees on walkability and further on land transaction price may differ among tree species, but this is beyond our research scope while this is not yet known well. For example, Labdaoui et al. (Citation2021) implies that thermal environment and the green coverage rate may differ among tree types, but the impact of these elements on walkability is not clear according to them.
5.3. Further NAAWs on land transaction price
The number of urban amenities nearby (proxied by the number of restaurants in this study) positively correlates land transaction price, especially in the residential areas. Such urban amenities targeting nearby residents supposedly stimulate activities nearby within walking distances, resulting in higher land prices.
Population density has overall positively significant estimates, meaning denser areas tend to have higher land values. This variable is meant to capture the benefit of having more people in the area, which is not fully explained or captured by the number of restaurants, lightings and other explanatory variables employed in our model: the estimates imply the channel between walkability and land price through population density.
The effect of land use diversity on land transaction price is nuanced differently depending on the contexts. With stratified samples between residential and commercial land use (Model 3-1 and 3-3), the estimate result is positively significant in residential areas and negatively significant in the industrial/commercial areas. This implies that, in residential areas, the uniform land use (and thus in contrast to walkability provoked by mixed land-use) is deemed preferrable. It may contradict what the previous studies conclude: in the compact communities where land use is diverse and mixed, many of the living needs can be satisfied within walking distance, which increase residents’ walkability (Baobeid et al., Citation2021). One potential explanation would be that, for the residential areas, quiet neighbourhood may be preferrable, where nearby areas dominantly belong to residential use. In addition, negative externalities from different land use (such as noise from industrial/commercial activities) may reduce property values for residential use. For commercial land use, in contrast, mixed economic activities can yield agglomeration economies and proximity to consumers (residents) are often considered to be profitable.
Another potential explanation would be that, particularly in the Vienna’s environment, urban streets in the residential areas are more considered as what Gruber et al. (Citation2018) call “primary transportation space” for pedestrians and vehicles, rather than what they call “urban living space” where the activities provoked by higher walkability take places. The aspect of the streets as “urban living space” may be more associated to the commercial land use. This will, however, call for further investigation.
5.4. Policy implications
Our research results can be used to identify walkability factors that contribute to enhance land value, such as trees and quality pavements. In actual planning situations, planners have better access to the cost estimates, but the economic benefits of the walkability enhancement are hard to be quantified. Our estimates for different subgroups can be used to recommend effective means to enhance walkability in a cost-effective manner, depending on the area’s characteristics.
In reverse, our research results also imply that the improvement of walkability may have a risk of urban gentrification through land prices. Particular attention is called for if walkability improvement is made in low-income neighbourhood so that the improvement does not lead to unaffordability of housing and any other types of real-estate use. This would be an unwanted side effect of walkability improvement which could be mitigated by a gradual and city-wide improvement of walkability rather than implementing a few “lighthouse” or “showcase” urban streets in a limited number of places. To this end, a strategic masterplan focusing on walking would serve as a local guidance as has been done in some districts of Vienna.
Despite this caution, our research result will potentially provide a basis to monetize value created through walkability improvements. This could potentially be used as a public financial source for such walkability improvements if property ownership taxation, Business Improvement Districts (BIDs), or property transaction levy is introduced. This would eventually open up a novel possibility for municipalities to improve quality of life for its residents through better walkability on urban streets. However, for the real-world implementation, further research will have to make our results more precise and to address further operational questions such as how to institutionalize such levy.
5.5. Caveats
An important caveat is that the dataset we use in this research only covers the land transaction without any existing building which includes the transfer of ownership, and it does not cover the house rent. Thus, our dataset and results should be interpreted as how the buyers of empty land plots perceived the land potential itself in association to the walkability nearby. As for the transaction with buildings, it may be possible to incorporate them into our analysis in the future by determining the building height at each location using a 3D model of Vienna, but this has its own limitation as the height per floor is fairly different between the buildings before World War II (so-called “Altbau”) and after it (“Neubau”). As for the house rent, our methodology can also be applied to it but there is a lack of such data in the government open data. A different dataset from the private sector would be needed, which is more difficult to obtain compared to open government data.
Another caveat is that, as discussed previously, the number of records in the industrial/commercial areas may be insufficient and thus results may not be comprehensive enough. Expanding our dataset to land with building may be able to make the results for industrial/commercial areas more reliable, but it poses a complex question such as the discrepancy between the time of transaction and the time of the 3D model.
6. Conclusion
We carried out a data-driven analysis to investigate the impact of Neighbourhood Amenities and Ambient that affect Walkability (NAAW) on land transaction price, with the open government data from Vienna. Combining the open data sources from the City of Vienna and the GIS software, a comprehensive walkability dataset was compiled, which incorporates what has previously been described as “local environment” or “Walkability Score” but more directly related to the parameters that policy interventions could potentially target. Making use of the large size of the government dataset, we also conducted stratification by maximum building height (low-rise vs. high-rise) and land use (residential or industrial/commercial).
Despite the caveats, one of the most important takeaways from our research is that the valuation of walkability is potentially different depending on different urban contexts. The pedestrian-friendliness in a near proximity, the variables related to pavement area (paved surface area in total, walkable pavement ratio, greened pavement ratio and beautified pavement ratio) are more nuanced in low-rise and residential areas than high-rise and industrial or commercial areas in the context of land transaction prices. A similar conclusion can be drawn for the trees, too. Overall, our result implies that the improvement of such “classical” walkability elements are monetarily captured as a part of land transaction price more in low-density contexts such as low-rise residential areas rather than in high-density contexts as well as in commercial and industrial land use. The same applies to the effects of urban amenity (proxied by the number of restaurants in our study), too. Population density also has a positive effect but also in the latter types of areas.
Our research results bring about some implications in implementations of walking-related transport policy, such as better impact assessment and potential financial sources but also potential risk of gentrification through walkability improvement. Overall, the results are based on data from Vienna, where a rich data source is available, but similar analysis in other cities will be called for in the future as similar open data is becoming increasingly available in other cities, too.
Acknowledgements
This research was carried out as a part of a project financed by the International Association of Traffic and Safety Studies, with the project ID 2103B. This paper was earlier presented in track F-4 (Liveability and Non-Motorized Transport) of World Conference on Transport Research (WCTR-2023) held at Montreal, Canada, during 17th to 21st July 2023. Authors thank the track Chair for giving opportunity to submit our paper to the partner journal TSTL, Taylor & Francis (T&F). We are thankful to the insightful comments by Tomohiro Ichinose, Aya Kojima and Azusa Toriumi, as well as the other project members. We are also thankful to the members of the Research Unit Transport Planning and Traffic Engineering at TU Wien (Vienna University of Technology) for their comments.
Disclosure statement
No potential conflict of interest was reported by the author(s).
References
- Allam, Z., Moreno, C., Chabaud, D., & Pratlong, F. (2020). Proximity-based planning and the “15-minute city”: A sustainable model for the city of the future. In R. Brinkmann (Ed.), The Palgrave handbook of global sustainability. Springer International Publishing. https://doi.org/10.1007/978-3-030-38948-2_178-1
- Aravot, I. (2002). Back to phenomenological placemaking. Journal of Urban Design, 7(2), 1–28. https://doi.org/10.1080/1357480022000012230
- Banister, D. (2008). The sustainable mobility paradigm. Transport Policy, 15(2), 73–80. https://doi.org/10.1016/j.tranpol.2007.10.005
- Baobeid, A., Koç, M., & Al-Ghamdi, S. G. (2021). Walkability and its relationships with health, sustainability, and livability: Elements of physical environment and evaluation frameworks. Frontiers in Built Environment, 7. https://doi.org/10.3389/fbuil.2021.721218
- Belcher, R. N., & Chisholm, R. A. (2018). Tropical vegetation and residential property value: A hedonic pricing analysis in Singapore. Ecological Economics, 149, 149–159. https://doi.org/10.1016/j.ecolecon.2018.03.012
- Blečić, I., Congiu, T., Fancello, G., & Trunfio, G. A. (2020). Planning and design support tools for walkability: A guide for urban analysts. Sustainability, 12(11), 4405. https://www.mdpi.com/2071-1050/12/11/4405 https://doi.org/10.3390/su12114405
- Blomquist, G., & Worley, L. (1981). Hedonic prices, demands for urban housing amenities, and benefit estimates. Journal of Urban Economics, 9(2), 212–221. https://EconPapers.repec.org/RePEc:eee:juecon:v:9:y:1981:i:2:p:212-221 https://doi.org/10.1016/0094-1190(81)90041-3
- Brezina, T., Graser, A., & Leth, U. (2017). Geometric methods for estimating representative sidewalk widths applied to Vienna’s streetscape surfaces database. Journal of Geographical Systems, 19(2), 157–174. https://doi.org/10.1007/s10109-017-0245-2
- Cervero, R., & Dai, D. (2014). BRT TOD: Leveraging transit oriented development with bus rapid transit investments. Transport Policy, 36, 127–138. https://doi.org/10.1016/j.tranpol.2014.08.001
- Cervero, R., Kang, J., & Shively, K. (2009). From elevated freeways to surface boulevards: neighborhood and housing price impacts in San Francisco. Journal of Urbanism: International Research on Placemaking and Urban Sustainability, 2(1), 31–50. https://doi.org/10.1080/17549170902833899
- Cervero, R., & Murakami, J. (2009). Rail and property development in Hong Kong: Experiences and extensions. Urban Studies, 46(10), 2019–2043. https://doi.org/10.1177/0042098009339431
- Chen, W. Y., & Jim, C. Y. (2010). Amenities and disamenities: A hedonic analysis of the heterogeneous urban landscape in Shenzhen (China). The Geographical Journal, 176(3), 227–240. https://doi.org/10.1111/j.1475-4959.2010.00358.x
- Chorus, P., & Bertolini, L. (2016). Developing transit-oriented corridors: Insights from Tokyo. International Journal of Sustainable Transportation, 10(2), 86–95. https://doi.org/10.1080/15568318.2013.855850
- Cities4Forests. (n.d). City highlights: Barcelona superblock: Redesigning the city for the well-being of its citizens. https://cities4forests.com/city-highlights/barcelona-superblock/
- Clifton, K. J., Burnier, C. V., & Akar, G. (2009). Severity of injury resulting from pedestrian–vehicle crashes: What can we learn from examining the built environment? Transportation Research Part D: Transport and Environment, 14(6), 425–436. https://doi.org/10.1016/j.trd.2009.01.001
- Congress for the New Urbanism. (1996). Charter of the new urbanism. http://www.cnu.org/charter
- Cortright, J. (2009). Walking the walk: How walkability raises home values in U.S. cities. CEOs for Ciies.
- Daniels, R., & Mulley, C. (2013). Explaining walking distance to public transport the dominance of public transport supply. Journal of Transport and Land Use, 6(2), 5–20. www.jstor.org/stable/26202654 https://doi.org/10.5198/jtlu.v6i2.308
- Falconer Al-Hindi, K. (2001). The new urbanism: Where and for whom? Investigation of an emergent paradigm. Urban Geography, 22(3), 202–219. https://doi.org/10.2747/0272-3638.22.3.202
- Frank, L. D., Schmid, T. L., Sallis, J. F., Chapman, J., & Saelens, B. E. (2005). Linking objectively measured physical activity with objectively measured urban form: Findings from SMARTRAQ. American Journal of Preventive Medicine, 28(2 Suppl 2), 117–125. https://doi.org/10.1016/j.amepre.2004.11.001
- Gan, Z., Yang, M., Zeng, Q., & Timmermans, H. J. P. (2021). Associations between built environment, perceived walkability/bikeability and metro transfer patterns. Transportation Research Part A: Policy and Practice, 153, 171–187. https://doi.org/10.1016/j.tra.2021.09.007
- Garrod, G. D., & Willis, K. G. (1992). Valuing goods’ characteristics: An application of the hedonic price method to environmental attributes. Journal of Environmental Management, 34(1), 59–76. https://doi.org/10.1016/S0301-4797(05)80110-0
- Geoghegan, J. (2002). The value of open spaces in residential land use. Land Use Policy, 19(1), 91–98. https://doi.org/10.1016/S0264-8377(01)00040-0
- Glaeser, E. L., Kolko, J., & Saiz, A. (2001). Consumer city. Journal of Economic Geography, 1(1), 27–50. https://doi.org/10.1093/jeg/1.1.27
- Gössling, S., Choi, A., Dekker, K., & Metzler, D. (2019). The social cost of automobility, cycling and walking in the European Union. Ecological Economics, 158, 65–74. https://doi.org/10.1016/j.ecolecon.2018.12.016
- Gruber, C., Raminger, K., Shibayama, T., & Winder, M. (2018). On the Vienna Corso: Changing street use and street design around the Vienna State Opera House 1860–1949. The Journal of Transport History, 39(3), 292–315. https://doi.org/10.1177/0022526618790443
- Hanson, S., & Jones, A. (2015). Is there evidence that walking groups have health benefits? A systematic review and meta-analysis. British Journal of Sports Medicine, 49(11), 710–715. https://doi.org/10.1136/bjsports-2014-094157
- Hiess, H. (2017). Entwicklung eines Umsetzungs-konzeptes für österreichweite ÖV-Güteklassen - Abschlussbericht (Development of an implementation concepts torwards an Austria-wide public transport service quality classifications - Final Report). ÖREK-Partnerschaft „Plattform Raumordnung & Verkehr“.
- Jun, H.-J., & Hur, M. (2015). The relationship between walkability and neighborhood social environment: The importance of physical and perceived walkability. Applied Geography, 62, 115–124. https://doi.org/10.1016/j.apgeog.2015.04.014
- Labdaoui, K., Mazouz, S., Acidi, A., Cools, M., Moeinaddini, M., & Teller, J. (2021). Utilizing thermal comfort and walking facilities to propose a comfort walkability index (CWI) at the neighbourhood level. Building and Environment, 193, 107627. https://doi.org/10.1016/j.buildenv.2021.107627
- Lee, C., & Moudon, A. V. (2006). The 3Ds + R: Quantifying land use and urban form correlates of walking. Transportation Research Part D: Transport and Environment, 11(3), 204–215. https://doi.org/10.1016/j.trd.2006.02.003
- Lee, S. (2021). Does tree canopy moderate the association between neighborhood walkability and street crime? Urban Forestry & Urban Greening, 65, 127336. https://doi.org/10.1016/j.ufug.2021.127336
- Li, W., Joh, K., Lee, C., Kim, J.-H., Park, H., & Woo, A. (2015). Assessing benefits of neighborhood walkability to single-family property values: A spatial hedonic study in Austin, Texas. Journal of Planning Education and Research, 35(4), 471–488. https://doi.org/10.1177/0739456X15591055
- Litman, T. (2013). The new transportation planning paradigm. Institute of Transportation Engineers. ITE Journal, 83, 20–24,26,28. https://search.proquest.com/docview/1399107662?accountid=39579
- Maghelal, P., & Capp, C. J. (2011). Walkability: A review of existing pedestrian indices. URISA Journal, 23, 5–19.
- Maki, Y., Ura, C., Yamaguchi, T., Murai, T., Isahai, M., Kaiho, A., Yamagami, T., Tanaka, S., Miyamae, F., Sugiyama, M., Awata, S., Takahashi, R., & Yamaguchi, H. (2012). Effects of intervention using a community-based walking program for prevention of mental decline: A randomized controlled trial. Journal of the American Geriatrics Society, 60(3), 505–510. https://doi.org/10.1111/j.1532-5415.2011.03838.x
- Marshall, S. (2003). New urbanism: An introduction. Built Environment, 29(3), 189–192. https://doi.org/10.2148/benv.29.3.189.54279
- McCormack, G. R., Friedenreich, C., Sandalack, B. A., Giles-Corti, B., Doyle-Baker, P. K., & Shiell, A. (2012). The relationship between cluster-analysis derived walkability and local recreational and transportation walking among Canadian adults. Health & Place, 18(5), 1079–1087. https://doi.org/10.1016/j.healthplace.2012.04.014
- Newman, P. W. G., & Kenworthy, J. R. (1996). The land use—transport connection: An overview. Land Use Policy, 13(1), 1–22. https://doi.org/10.1016/0264-8377(95)00027-5
- Österreichische Forschungsgesellschaft Straße–Schiene–Verkehr. (2015). RVS 03.02.12 Fußgängerverkehr (Pedestrian Traffic). Richtlinien und Vorschriften für das Straßenwesen (Guidelines and Regulations for Road Traffic). Österreichische Forschungsgesellschaft Straße–Schiene–Verkehr.
- Pivo, G., & Fisher, J. D. (2011). The walkability premium in commercial real estate investments. Real Estate Economics, 39(2), 185–219. https://doi.org/10.1111/j.1540-6229.2010.00296.x
- Rauterkus, S. Y., & Miller, N. (2011). Residential land values and walkability. Journal of Sustainable Real Estate, 3(1), 23–43. https://doi.org/10.1080/10835547.2011.12091815
- Rosen, S. (1974). Hedonic prices and implicit markets: Product differentiation in pure competition. Journal of Political Economy, 82(1), 34–55. http://www.jstor.org/stable/1830899 https://doi.org/10.1086/260169
- Rupprecht, S., Brand, L., Böhler-Baedeker, S., & Brunner, L. M. (2019). Guidelines for developing and implementing a sustainable urban mobility plan (2nd ed.). https://www.eltis.org/sites/default/files/sump_guidelines_2019_interactive_document_1.pdf
- Shamsuddin, S., Hassan, N. R. A., & Bilyamin, S. F. I. (2012). Walkable environment in increasing the liveability of a city. Procedia - Social and Behavioral Sciences, 50, 167–178. https://doi.org/10.1016/j.sbspro.2012.08.025
- Shashank, A., & Schuurman, N. (2019). Unpacking walkability indices and their inherent assumptions. Health & Place, 55, 145–154. https://doi.org/10.1016/j.healthplace.2018.12.005
- Shibayama, T. (2020). Competence distribution and policy implementation efficiency towards sustainable urban transport: A comparative study. Research in Transportation Economics, 83, 100939. https://doi.org/10.1016/j.retrec.2020.100939
- Shibayama, T., & Emberger, G. (2020). New mobility services: Taxonomy, innovation and the role of ICTs. Transport Policy, 98, 79–90. https://doi.org/10.1016/j.tranpol.2020.05.024
- Stadt Wien. (2021).). Adressservice Wien. https://www.data.gv.at/katalog/dataset/c223b93a-2634-4f06-ac73-8709b9e16888
- Stangl, P. (2012). The pedestrian route directness test: A new level-of-service model. URBAN DESIGN International, 17(3), 228–238. https://doi.org/10.1057/udi.2012.14
- Strydom, W., Puren, K., & Drewes, E. (2018). Exploring theoretical trends in placemaking: Towards new perspectives in spatial planning. Journal of Place Management and Development, 11(2), 165–180. https://doi.org/10.1108/JPMD-11-2017-0113
- Sundquist, K., Eriksson, U., Kawakami, N., Skog, L., Ohlsson, H., & Arvidsson, D. (2011). Neighborhood walkability, physical activity, and walking behavior: The Swedish Neighborhood and Physical Activity (SNAP) study. Social Science & Medicine (1982), 72(8), 1266–1273. https://doi.org/10.1016/j.socscimed.2011.03.004
- Tajima, K. (2003). New estimates of the demand for urban green space: Implications for valuing the environmental benefits of Boston’s big dig project. Journal of Urban Affairs, 25(5), 641–655. https://doi.org/10.1111/j.1467-9906.2003.00006.x
- Wang, R., & Rasouli, S. (2022). Contribution of streetscape features to the hedonic pricing model using geographically weighted regression: Evidence from Amsterdam. Tourism Management, 91, 104523. https://doi.org/10.1016/j.tourman.2022.104523
- Wefering, F., Rupprecht, S., Bührmann, S., Böhler-Baedeker, S., Rupprecht Consult – Forschung und Beratung GmbH. (2013). Guidelines. Developing and Implementing a Sustainable Urban Mobility Plan. European Union.
- Wieser, R. (2006). Wirkungen der U-Bahn auf den Bodenmarkt in Wien. TU Wien - Centre of Public Finance and Infrastructure Policy.
- Yin, L., Zhang, H., Patterson, K., Silverman, R., & Wu, L. (2020). Walkability, safety, and housing values in shrinking cities: Spatial hedonic study in Buffalo, Pittsburgh, and Detroit. Journal of Urban Planning and Development, 146(3), 04020029. https://doi.org/10.1061/(ASCE)UP.1943-5444.0000595
- Zheng, H., Ehrlich, F., & Amin, J. (2010). Economic evaluation of the direct healthcare cost savings resulting from the use of walking interventions to prevent coronary heart disease in Australia. International Journal of Health Care Finance and Economics, 10(2), 187–201. https://doi.org/10.1007/s10754-009-9074-2
- Zheng, S., Cao, J., Kahn, M., & Sun, C. (2014). Real estate valuation and cross-boundary air pollution externalities: Evidence from Chinese cities. The Journal of Real Estate Finance and Economics, 48(3), 398–414. https://EconPapers.repec.org/RePEc:kap:jrefec:v:48:y:2014:i:3:p:398--414. https://doi.org/10.1007/s11146-013-9405-4
Appendix A.
Building restriction codes of Vienna
Table A1. Building restriction codes of Vienna, with the maximum permitted building height within them.