 ?Mathematical formulae have been encoded as MathML and are displayed in this HTML version using MathJax in order to improve their display. Uncheck the box to turn MathJax off. This feature requires Javascript. Click on a formula to zoom.
Abstract
Several studies show that sedentary behavior poses dangerous signs to health. Patients requiring information of their physical activities can use a tri-axial accelerometer electronic device designed to attach to the waist of users. However, due to the low availability of devices, the applications were limited only to those patients who required special attention and who were to be closely monitored under a controlled environment. Many researchers have recently turned to smart phones to explore the built-in sensors of these phones to obtain accurate physical activity data. Today smart phones are ubiquitous and are equipped with a tri-axial accelerometer. It will be very useful if an activity detection system is implemented in these smart phones. Such system will aid patients with special needs in a special control environment and also others who want to know their daily activities for their own different purposes. This study discusses the use of smart phones in tracking human daily physical activities, divided into four: sleeping, resting, walking, and running. It was shown that the classification resulted in good accuracy in most cases and with reasonable battery consumption. Each activity performed over a period of time was also converted to energy expenditure using MET data published in the compendium of physical activities tracking guide. The following relevant information was also provided: duration of each activity, and step counts and distance obtained while walking and running. This tool could be used to automatically provide information on user's daily pattern of physical activities. Tests of battery consumption were also shown. Several tests of performance were shown, and although the application depended on factors such as users, phones, phone location, duty cycles, walking patterns, and application settings, it worked very well in most situations after proper calibration to suit the user.
Information regarding our daily total caloric expenditure is useful to know but difficult to obtain. The simplest way to estimate an individual's daily total energy expenditure is to compute the basal metabolic rate (BMR), which is the amount of energy a person burns when on sedentary activity. When an individual performs additional activities or exercises, the extra amount of energy can be estimated and added on top of the BMR. Usually BMR can be estimated with physical data such as age, weight and height. The problem is therefore reduced estimation of calorie expenditure due to daily physical activity. Then BMR and physical calorie expenditure can be summed to obtain total daily calorie expenditure. Thus, researchers usually resot to methods for detecting human physical activity.
Information on human daily physical activity has been explored in several fields, including the healthcare business, for counseling the patients with chronic health problems. In the past, it was customary to observe our own daily activity pattern and take notes in a logbook. Advances in information technology allow for a systematic monitoring of our activities using computer software based on our manual inputs. Nowadays, there are electronic devices, such as accelerometers, heart rate monitors, and pedometers, available to be worn on or attached to the body to automatically obtain physical and biological activity data. Some of these devices can transmit data wirelessly in real time.
The current trends show that smart phones have become more ubiquitous and more affordable. Every smart phone today contains a variety of sensors, one of which is the accelerometer. A common and very useful application of the accelerometer is a pedometer that keeps updating the distance and step counts. A simple pedometer application is based on the double integral of the acceleration data. This technique is referred to as dead reckoning. When combined with GPS updates periodically, it can give a more accurate update of step counts and distance (Citation1).
In addition to step counts, accelerometers can further be applied for activity classification. Zhang et al. (Citation2) adopted a hierarchical classification, which was then followed by two multiclass support vector machine (SVM) classifiers. They fixed a smart phone on the user's waist and classified activity into six classes: sitting, standing, lying, walking, posture transition, and gentle motion. Lee and Cho (Citation3) proposed a hierarchical probabilistic model to classify a user's activities. They used continuous and discrete Hidden Markov Model (HMM) on 5 seconds of acceleration data. They classified this into four actions: stand, walk, stair up/down, and run. Then, they evaluated a series of actions into a user's three activities: shopping, taking a bus, and walking. Taylor et al. (Citation4) reviewed a number of activity classifiers on smart phones specifically for sport activities. They found that the performances depended on a number of factors such as phone locations and orientations. In addition, they demonstrated that the performance of these activity classifiers can be degraded if activity definitions were not understood in the same way between users and developers.
At i-CREATEe 2012 conference, Chinrungrueng and Sartsatit proposed to perform activity detection using smart phones (Citation5). Activity was classified into four types: sleeping, resting, walking, and driving. The classification was performed with signal obtained using the accelerometer and GPS sensors on Android smart phones. The authors adopted Mathie's framework (Citation6) of a simple binary tree classification and implemented it on the Android smart phones. The classification results obtained were higher than 95%. However, they only presented the classification method, and vaguely defined relevant applications and performed only a few basic tests.
In this paper, an activity detection algorithm is proposed with a focus on detecting physical activity into a number of main classes in order to obtain an automatic estimation of daily caloric expenditure. The information can allow users to monitor their personal behavior and make any appropriate adjustment so that users can improve their health and avoid living a sedentary life. The classification tool proposed by Chinrungrueng and Sartsatit (Citation5) on Android smart phones is extended and focused on providing users with a classification of physical activity into the following four basic classes: sleep, rest, walk and run. The tool will provide automatic access to the following specific information: daily energy expenditure, activity duration, walk and run distance, and walk and run step count. Physical activity is represented by four basic classes as they can generally give the user ideas on how active or inactive they are. Other activities such as watching TV, jogging, and playing various sports, may be grouped very well into our basic classes according to the strenuous level of the activity they have. The definitions of these classes are defined as follows:
Method
Accelerometer and activity classification
Activity detection techniques using smart phones are expected to vary widely and depend on many factors such as algorithms, types of activity, environments, smart phones, and even the users. To make a smart phone useful for activity detection, a simple algorithm on physical activity detection should work very well in a free-living environment, and with various smart phones.
The focus of this paper is to classify activity into the following four classes: sleep, rest, walk, and run. These four physical activities can represent human daily physical activity very well based on the level of vigor from lowest to highest. When an estimate of human daily energy expenditure is obtained, it is not necessary to detect exact activity, but only classes of activities that represent the same level of vigor.
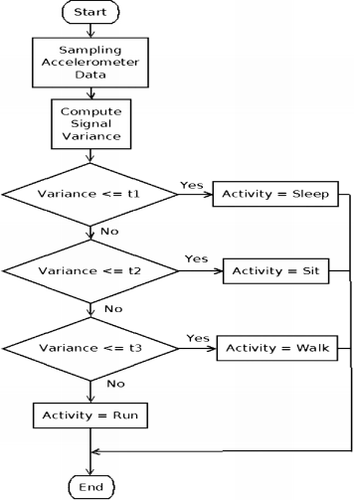
The classification follows a simple binary tree adapted from Mathie's generic platform (Citation6) as shown in . All decisions made are based on yes/no answers. Details on classification can be found in (Citation5). The algorithm addresses the following three important issues.
Accelerometer's sensitivity varies among different phones. An algorithm cannot simply apply fixed threshold obtained on any particular phone. To obtain a true average threshold will involve obtaining all available smart phones on the market, followed by finding the threshold appropriate to each phone and computing the average. In addition, when new phones are available, new averages will have to be computed incorporating these new phones. Thresholds must be different and adapted for different phones. Processing of variance signals must therefore allow for automatically finding thresholds of signal variances.
It is best to not always turn on the accelerometer, as it will deplete the phone battery quickly. Therefore, it is better to periodically apply the accelerometer and extrapolate the user's activity instead.
Spurious signal misinterpretation must be filtered out and an algorithm must only detect real main activity and not activity caused by infrequent changing of posture.
Figure 1. The main flowchart of the binary tree algorithm that takes samples of the accelerometer and evaluates the variance to classify activity.
In all of these classifications, the algorithm will tackle the above three issues as follows:
1) A method for obtaining sensor sensitivity is provided and adapted to different phones and also a way to collect accelerometer variance and to determine thresholds is performed automatically. It was possible to learn from data collected while running the application (Citation5).
To obtain accelerometer sensitivity, a means for the user to let the program learn of its accelerometer before using it is provided. The algorithm will ask the user to allow the application to learn of the phone's sensor. Sensor signal is simply obtained while being placed in the sleep state and the variance is computed and used as the threshold to identify sleep activity.
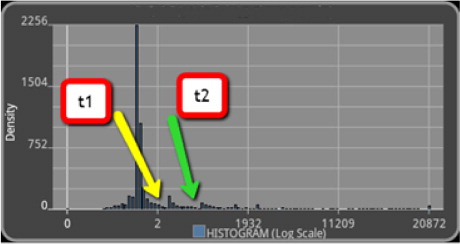
To identify the thresholds for all the other states: rest, walk and run, these thresholds are first guessed with multiples of the sleep threshold which will of course be inaccurate at first. While the program runs, the process of collecting accelerometer variances and obtaining a histogram of accelerometer variances is continued, as shown in . When enough samples are collected, the pattern can be seen with a few jumps. These jumps can be extracted and obtained as the thresholds. The histogram shows a Gaussian distribution in the low scale. The graph plotted in a log scale. Notice there are jumps between activities as labeled by t1 and t2. The thresholds t1 and t2 can be determined to distinguish rest, walk and run activities, respectively. The sleeping threshold obtained with a sensor reading earlier may not be seen in as it is very small due to the histogram being plotted in a log scale.
Figure 2. Histogram of accelerometer variances (in log scale). The jumps are noted as the adaptive thresholds to distinguish different physical activities.
2) Since one usually remains in one activity over a relatively long period of time, signal variance can be measured over a small time interval to monitor the movement instead of continuously monitoring the signal and draining the battery quickly. In this work, this periodic sampling time is referred as duty cycle, which is defined as the time data accessed over the time between two data readings.
3) To prevent the detection of spurious activity due to sporadic movements of our body, a counter is used to confirm the next activity. An activity is decided only when sensor signal that confirms the same activity is obtained a number of times consecutively.
Step counts, distance, and calorie expenditure calculation
An estimate of the step counts is given in the walking and running activities as follows:
where c is step counts; d is activity duration in seconds.
The estimation infers that a fixed average step counts is assumed over a period of time d. The factor 1.8 is obtained from average step counts for average persons. The factor 1.8 was obtained as follows: 10 subjects (five males and five females aged 25–50 years) were recruited to carry smart phones with the application installed together with pedometers for 7 days. The duration is noted with our application and the steps are counted with pedometers. The average number of step counts over the duration is obtained with 10 subjects. The test results show that it applies very well in most cases.
Once step counts are obtained, the step distances can be calculated by multiplying them with our step length. Step length is commonly estimated using the formula by Hatano (Citation7) as follows:
where h is height in cm and s is sex (0=female, 1=male).
Calorie expenditure (kcal) for physical activities is commonly calculated using MET data. MET data is an equivalent energy that a person will expend when performing a particular activity for a time unit. MET is usually published by an organization for references. The MET data is obtained from ‘2011 Compendium of Physical Activities: a second update of codes and MET values’ (Citation8). The expenditure energy can be obtained using the following formula:
where w is the weight of the user in kilograms, d is activity duration in seconds, and MET is the metabolic equivalent.
The following METs for the four activity classes are used: 1.0, 1.5, 4.0, and 6.0 for sleep, rest, walk, and run, respectively.
Results
The application was tested under several different conditions to see its performance. Most of the tests were performed under a free-living environment where test subjects were only required to perform the tests with very few limitations. Otherwise, the subjects were told to perform the tests as they would on their own phones on a daily basis.
Test of battery consumptions
Sampling rate
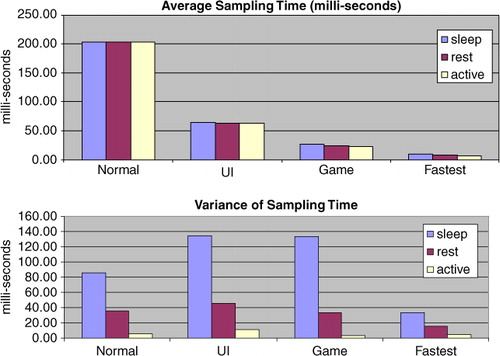
Android OS provides developers with four sampling rates of accelerometer sensor: normal, UI, game, and fastest – arranged from the slowest to the fastest sampling rates. showed an average sampling time and variance in milliseconds corresponding to each of the four sampling rates. The time between two consecutive samples was measured for 1,000 samples on four sampling options. As expected, the results showed that the sampling periods were arranged from lowest to highest as follows: fastest, game, UI and normal, respectively. The average sampling periods were not affected by the physical movement when measured across different activities. However, when considering the variance, it was found that the uniformity of sampling periods was affected by the physical movement. In other words, the Android OS imposed a sampling sensor more uniformly when the phone was in motion. The reason for this was that when the phone was not in motion, it might be safely assumed that the phone was not in use. So, the operating system did not give priority to the accessing of the sensors, but to more important tasks.
Figure 3. Average sampling time (top) and its variance (bottom) obtained for all four different sampling periods provided by an Android operating system. The sampling rates arranged from lowest to highest: Normal, UI, Game, and Fastest, respectively. The average sampling times are not affected by different activities, but the variation of the sampling times with activities are clearly noted.
Battery consumption subject to sampling rates
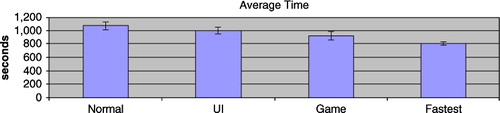
showed battery consumption subject to various sampling rates. In this experiment, the accelerometer was sampled at each of the four sampling rates and the battery consumption was monitored. The time duration was noted when the battery level was down by 1% and the test was repeated 10 times. The average was obtained and the results were plotted. The results shown in indicated that the slower the sampling rate, the longer the battery tended to last.
Figure 4. Average time for 1% of battery consumption over four different sampling rates clearly shows that faster sampling rates results in lower battery times.
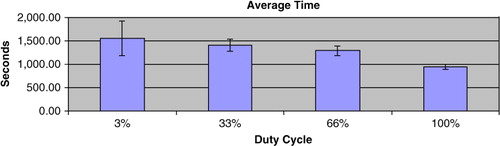
Duty cycle
To save battery it is best not to have the accelerometer turned on all of the time. Instead, data are periodically sampled in a short interval. While it is idle, the accelerometer is turned off to save the battery. The time interval that the accelerometer is turned on over the time interval between two consecutive samples is referred to as ‘duty cycle’. In this experiment, the measurement of the time that the phone consumed 1% of battery energy was obtained for four different duty cycles 3, 33, 66, and 100%. The measurement was repeated 10 times and the average was taken. showed a graph of average time corresponding to varying duty cycles. The results showed that lower duty cycles yielded longer battery time. However, variations in battery time were significantly higher with lower duty cycles and therefore performances were reduced.
Figure 5. Average time for 1% of battery consumption over four different duty cycles shows that higher duty cycles results in lower battery times. However, more variation in battery times is clearly noted in lower duty cycles.
Test of application performances
In the following section, a number of tests were performed to see the performances of the application with regards to following factors: users, phones, phone locations, accuracy settings, and application calibration. Three subjects were recruited to perform the test. A predetermined path was set up at an office by pasting stickers at a 1-meter interval along the path. All subjects were instructed to walk along the path at their usual pace and comfortable step distance. With a mechanical pedometer on their waist, the subjects walked and counted their own steps. When finished, the step counts were recorded with the pedometer and their self count. This initial protocol was to identify the accuracy of the pedometer to the self-step counts. The subjects were instructed to count their own steps very carefully. The tests were repeated 10 times for each subject and the step counts were averaged. Results are shown in .
Table I. Step counts obtained with pedometer and manual count
The hypothesis that step counts obtained with self-count and a pedometer were equal was tested. The null hypothesis was the step count difference, obtained with the two methods above, was zero. The error rate and the p-value were computed as shown in . The average number of step counts obtained with the pedometer was within 7% of the self-count. However, the hypothesis tests showed that two out of three subjects passed the test at the significant level of p=0.01. The results showed that the pedometer provided an estimate of step counts within some acceptable errors. Therefore, the pedometer will be employed in our next experiments to compare the performance of our application.
In the following tests, performance of the application was tested according to the following parameters: users, phone locations, phones, accuracy settings (duty cycles), and walking patterns. The default settings for each test subject were the followings: phone location was in the trouser pocket, test phone was HTC, and accuracy setting was medium. All subjects performed and repeated the experiment with default setting 10 times. Each time, the subject noted their step counts obtained with the pedometer and the application.
Test of performance to different users
Different people have different habit movements or walking stride. It will certainly be a factor that affects the application performance. All three subjects performed this test. Each subject carried a HTC phone and walked along the same path at normal pace and repeated the test 10 times. All parameters were set to default setting. The number of steps was noted with the pedometer and the application. The error percentages were computed and are shown in .
Table II. Percentage of step count error with various affecting factors compared with pedometer
Test of performance on different phone locations
Here, the performance of our application was tested if it depended on the location at which the user carried a smart phone. All subjects performed this test by putting the HTC phone in three different locations: trouser pocket (default setting), shirt pocket, and waist. The subjects walked along the same path at their normal pace. The test was repeated 10 times for each subject carrying the phone at each location. The number of steps was noted with the pedometer and the application. The error percentages were computed and are shown in .
Test of performance on different phones
The application was tested if it depended on different smart phones. The test was performed on two other different phones than the default settings that used HTC. The other two phones were Samsung, and LG. The phones were chosen arbitrarily. HTC run on a 1 MHz 32 bit single core Qualcomm CPU. Samsung runs on an 830 MHz ARMv6 CPU. LG run on an 850 MHz CPU. All subjects performed this test. The phone was put in the subject's trouser pocket in each test and the subject walked along the same path at the normal pace as before. The test was repeated 10 times for each phone. The number of steps was noted with the pedometer and the application. The error percentages were computed and are shown in .
Test of performance on different accuracy settings (duty cycles)
As mentioned, the battery could be saved by lowering duty cycle. The parameter ‘duty cycle’ was defined as the proportion of accelerometer access time and the time between accessing accelerometer. The duty cycle could range from 0 to 100%, where 0% referred to the accelerometer being completely turned off, and 100% referred to the accelerometer being fully turned on. The performance of our application was tested if it depended on the variation of the duty cycles. The application defined three accuracy settings according to three different duty cycles: high =20%, medium=10%, and low=6%. All subjects performed this test by putting HTC phone setup with three different settings: high, medium (default), and low. Each subject walked along the same path at normal pace and repeated the test 10 times. The number of steps was noted with the pedometer and the application. The error percentages were computed and shown in .
Test of performance on different walking patterns
Obviously people have different walking patterns during the day. Their patterns mostly depend on their jobs or habits. A boss may walk from here to there while at work, stopping to talk with subordinates. They may walk continuously for a few steps and come back to their work. It is expected that the performances will be affected with different walking patterns. All subjects performed this test by putting on HTC phone and walked in three different stop and go patterns. In each test, the subject walked continuously for 5, 15, and 30 steps, respectively, and then stopped for about 30 seconds before starting to walk again. The subject walked along the same path at normal pace and repeated the test 10 times. The number of steps was noted with the pedometer and the application. The error percentages were computed and are shown in .
Test of performance on different users with application calibration
The application was tested if its performance improved when calibration was performed. All of the above tests were repeated with all three subjects. Instead of using the default setting of calibration this time, each subject performed calibration of the sensor as instructed by the application. The application was therefore expected to set up such that the thresholds had been adapted to match each subjects’ walk stride. The number of steps was noted with the pedometer and the application. The errors were computed and are shown in .
Result interpretation
The above tests and results shown in demonstrated clearly that the performance of the application varied according to the parameters under consideration. Most of the tests yielded good accuracy to within around 20% of step counts compared to the pedometer. Some parameters might result in higher error percentages especially before application calibration. The results obtained after calibrating the application clearly showed that the performance improved significantly. In general, individual settings of parameters and thresholds also helped improving accuracy.
Although these tests did not cover every possible affecting factor, it could be concluded that the percentage of step count error in most cases was around 10–20% after calibration. In some extreme cases, very high error rates were noted; therefore, these situations or parameters should be avoided if possible. The settings adjusted to each individual provided by the application helped improve the performance in general.
Discussion
This paper found that smart phones could be an effective tool for automatically monitoring user's daily physical activity. To apply the work to various smart phones with different specifications of CPU and built-in sensors, the techniques must reliably detect activities, save battery, and automatically compute thresholds for the decision binary trees. The battery life depended on the sampling rate and the duty cycle. Four sampling rates were provided by Android operating systems. It was shown that higher sampling rates resulted in lower battery life. In addition, it was shown that Android operating system optimized the performance of sensor sampling when phone movement was detected, as seen from very low variation in sampling time. When the phones were not in motion, sensor sampling was not necessarily accurate and therefore resulted in high variation in sampling time. Another factor that affected the battery life was the duty cycle. Higher duty cycles resulted in higher battery consumption, while lower duty cycles could prolong battery time. However, the higher variation of battery life was seen when the sensor was operated in lower duty cycles. This resulted in higher performance variation of the activity detection.
Performance of the application when tested with subjects in a free-living environment showed that the algorithms worked well on all tested smart phones. Performance was seen to be affected by all factors under consideration to different degrees. The step count error obtained with self-count and the pedometer was averaged at 7%. The application error compared with the pedometer before calibration was averaged higher than 50% in some cases due to several factors. With calibration, the performance was improved in most cases. The step count error compared to the pedometer was limited to lower than 20%.
The results could be used for users to track their physical energy usage and give relevant information such as energy expenditure, activity duration, as well as step counts and distance. It should give the user an idea of what their activity pattern was each day and the user can therefore make a better plan for their health. They can also submit the information to health professionals and receive advice from them. In the future, it will be possible to refine the results of converting physical activity to expenditure energy using MET data according to the continuous varying levels of accelerometer data. In addition, being able to compare energy obtained from food consumption will allow users to plan for their diet and physical activity accordingly.
Conflicts of interest and funding
We declare there is no conflict of interest from any private organization. The smart phones employed in our performance tests were chosen arbitrarily without the involvement of any vendors.
Acknowledgements
The authors thank Assoc. Prof. Wiroj Jiamjaratrungsi and Mr. Sitmanat Suwanachai from King Chulalongkorn Memorial Hospital and Faculty of Medicine, Chulalongkorn University for their support and provision of data and information while developing this application. The authors also appreciate financial support from both National Electronics and Computer Technology Center and King Chulalongkorn Memorial Hospital's top executives.
References
- Weinberg H. Using the ADXL202 in pedometer and personal navigation applications. Application Note. 2002; Norwood, MA: Analog Devices.1–8.
- Zhang S, McCullagh P, Nugent C, Zheng H. Activity monitoring using a smart phone's accelerometer with hierarchical classification. 2010; Kuala Lumpur, Malaysia: 6th International Conference on Intelligent Environments.158–63. 19–21 July.
- Lee Y, Cho S. Activity recognition using Hierarchical Hidden Markov Models on a smartphone with 3D accelerometer. 23–25 May 2011; Wroclaw, Poland6th International Conference on Hybrid Artificial Intelligent Systems—Volume 1.460–7.
- Taylor K, Abdulla UA, Helmer RJN, Lee J, Blanchonette I. Activity classification with smart phones for sports activities. Procedia Engineering: 5th Asia Pacific Congress on Sports Technology. 2011; 13: 428–33.
- Chinrungrueng J, Sartsatit S. Tracking daily activity using smart phones. In: Sixth International Convention on Rehabilitation Engineering & Assistive Technology. 24–26 July 2012; , Singapore
- Mathie MJ, Celler BG, Lovell NH, Coster ACF. Classification of basic daily movements using a triaxial accelerometer. Medical & Biological Engineering & Computing. 2004; 42: 679–87. [PubMed Abstract] [PubMed CentralFull Text].
- Hatano Y. Use of the pedometer for promoting daily walking exercise. Journal of the International Committee on Health, Physical Education and Recreation. 1993; 4–8.
- Ainsworth BE, Haskell WL, Herrman SD, Meckes N, Bassett DRJr, Tudor-Locke C. Compendium of physical activities: a second update of codes and MET values. Medicine and Science in Sports and Exercise. 2011; 43(8): 1575–81. [PubMed Abstract].