
Abstract
In this study, we developed a transcriptomics based human in vitro model for predicting DILI in humans. The transcriptomics data (Affymetrix GeneChip Human Genome U133 Plus 2.0) from primary human hepatocytes were provided by the Japanese Toxicogenomics Project (TGP). The selected compounds were divided into two groups, i.e., most-DILI and no-DILI, based on FDA-approved drug labels. The compounds were further grouped in a training and validation set. The training set, containing the most extreme most-DILI and no-DILI compounds based on the in vivo rat clinical chemistry measurements from TGP, was used to develop the prediction model. The validation set showed high accuracy (> 90%) and performed better than splitting the compounds into training and validation set randomly.
Abbreviations
| DILI | = | drug-induced liver injury |
| CAMDA | = | critical assessment of massive data analysis |
| TGP | = | Japanese Toxicogenomics Project |
| FDA | = | U.S. Food and Drug Administration |
| PRC | = | precision-recall-curve |
| AUC | = | area under the curve |
| ALP | = | alkaline phosphatase |
| TBIL | = | total bilirubine |
| AST | = | aspartate aminoptansferase |
| ALT | = | alanine aminotransferase |
| LDH | = | lactate dehydrogenase |
| GTP | = | Y-glutamyltranspeptidase |
| PAM | = | Prediction Analysis for Microarrays |
| ME | = | misclassification errors |
| IARC | = | International Agency for Research on Cancer |
Introduction
Over the past decades drug-induced liver injury (DILI) is the main cause of drugs to fail during clinical trials or to be withdrawn from the market.Citation1 Approximately 40% of DILI cases are not detected in preclinical studies based on conventional indicators in in vivo rodent studies.Citation2 Therefore, alternative methods for predicting the DILI potential in humans are needed and toxicogenomics-based approaches have been investigated within this respect.Citation3-5 During CAMDA 2012Citation6 the data sets of the Japanese Toxicogenomics Project (TGP)Citation7 were provided to address this topic, which was followed up during CAMDA 2013.Citation8
Recently, we developed an in vitro transcriptomics-based method in the human hepatic cell line HepG2 for predicting in vivo genotoxicity, which showed 89% accuracy, thereby clearly outperforming the standard in vitro test battery.Citation9 In this model chemicals were stratified according to results from the Ames bacterial gene mutation assay prior to transcriptomics evaluation after 24 h of treatment. For the CAMDA Challenge 2013Citation8 an adapted version of this in vitro method was used to develop a human in vitro classification model for predicting DILI in humans.
The development of the human in vitro classification model for DILI in human consisted of three steps:
Selecting compounds from the DILI potential groups for the training and validation sets;
establishing gene signatures for each prediction model using a leave-one-out t test on the in vitro human transcriptomics data of the DILI potential groups from the training set;
using these gene signatures to train and validate the prediction model in PAM (Prediction Analysis for Microarrays).Citation10
Grouping of samples and segregating these into training and validation sets is an essential step in developing a classifier.Citation11 Based on FDA-approved drug labels DILI potential has been assigned to three groups, i.e., “no-DILI,” “less-DILI” and “most-DILI.”Citation1,12 Categorization of drugs to the most-DILI and no-DILI groups has been clearly defined and all other compounds that did not fall into these two categories were labeled as less-DILI-concern.Citation12 This makes the DILI potential of the less-DILI-concern compounds questionableCitation12 and one should be cautious using this category in any analysis (W. Tong, personal communication). Therefore, in this study only data on most-DILI and no-DILI compounds will be used to develop a classifier.
Further, in this study the most-DILI and no-DILI samples were split into the training and validation set based on in vivo rat clinical chemistry measurements from TGP.Citation7 Compounds from the most-DILI group with in vivo rat clinical chemistry measurements indicating liver toxicity were considered strong candidates to train the prediction model and thus were placed in the training set. The no-DILI compounds were selected in a similar way, i.e., compounds showing evidence of no liver toxicity in vivo were placed in the training set. The rationale behind this is that the in vivo–in vitro combination strengthens the selection of the training set and thereby improving the prediction. Preliminary results presented at CAMDA 2013Citation13 showed that this selection indeed improved classification compared with random selection of the compounds for the training and validation set. Here, a more stringent selection will be applied using the most common clinical chemistry measurements, i.e., alkaline phosphatase (ALP), total bilirubine (TBIL), aspartate aminoptransferase (AST), alanine aminotransferase (ALT), lactate dehydrogenase (LDH) and Y-glutamyltranspeptidase (GTP).Citation14,15 In case of liver injury one or more of these measurements are often elevated.
Results
Selection of compounds
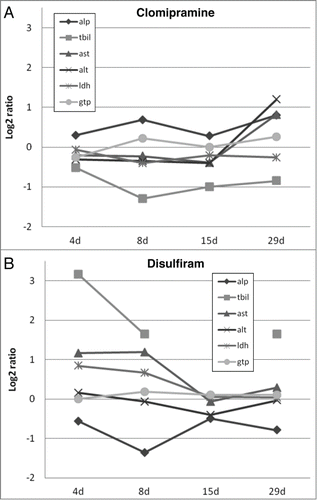
Selection of the compounds for the training and validation set was based on the sum of scores for the rat in vivo clinical chemistry measurements ALP, TBIL, AST, ALT, LDH and GTP. For the most-DILI group 31 of the 48 compounds had a sum of scores ≥7 (corresponding to a percentile of 0.7) for at least one time point. However, after evaluating these 31 compounds only 21 were selected for the training set. For example, clomipramine with a sum of scores ≥7 only for 29 d repeated exposure, showed a clear elevation of AST and ALT () and was therefore included in the training set. Disulfiram, on the other hand, had for three time points a sum of scores ≥7, but showed a decrease for the clinical chemistry measurements over time (). Further, it should be noted that despite the high log2 ratios for TBIL, all measurements (ranging from 0.002 to 0.044 mg/dL) were below the average of all TGP controls (0.11 mg/dL). Based on these results disulfiram was placed into the validation set.
Figure 1. Graphical overview of log2 ratios of rat in vivo clinical chemistry measurements for clomipramine (A) and disulfiram (B) over time. ALP, alkaline phosphatase; TBIL, total bilirubine; AST, aspartate aminoptansferase; ALT, alanine aminotransferase; LDH, lactate dehydrogenase and GTP, Y-glutamyltranspeptidase.
Compounds from the no-DILI group were selected for the training set when the sum of scores was ≤3 (corresponding to a percentile of 0.3) for any time point. Since, chlorpheniramine, chloramphenicol, hydroxyzine and metformin had a sum of scores ≤3 for at least one time point and none ≥7 and aspirin, ethanol and vitamin A had no sum of scores ≤3 these compounds were immediately placed in the training and validation set, respectively. The situation for caffeine and theophylline was not so clear-cut. Caffeine showed for two time points (8 and 15 d repeated exposure) a sum of scores ≤3 and once a sum of scores ≥7 for 29 d repeated exposure, whereas theophylline had a sum of scores ≤3 only for 4 d repeated exposure and sum of scores ≥7 for 15 and 29 d repeated exposure. Based on these numbers caffeine was selected for the training set and theophylline for the validation set.
The final selection of compounds for the training and validation set is shown in .
Table 1. Distribution of compounds over the training and validation set
Training and validation of prediction models
Four in vitro models for predicting DILI in humans were developed using data from primary human hepatocytes exposed to compounds with a medium or high dose for 24 or 8 h. For each model gene signature lists were obtained ranging from 71 genes for 8 h medium dose to 124 genes for 8 h high dose. PAM analysisCitation10 was conducted for each of the signature lists for class prediction (threshold: 0). Misclassification errors (ME) were calculated for each prediction model and were highest (0.12) for 24 h high dose. The other models had a ME <0.1.
Per prediction model the accuracy and balanced accuracy (between brackets) for each DILI group was calculated as indicated in . The accuracy within the training set is >90% (>95%) for all prediction models, but lowest for the high dose. Total accuracy for the validation set was also lowest for the high dose; for 24 h high dose it was 75% (54%) and for 8 h high dose 81% (57%). The highest accuracy of 91% (73%) is found for 8 h medium dose. This model also showed the best prediction for the no-DILI compounds in the validation set (50%). Both vitamin A and theophylline were correctly predicted whereas the other models only theophylline was correctly predicted.
Table 2. Accuracy for training and validation sets for each prediction model
The PRC analyses for the validation sets resulted in AUC's for 8 h medium dose, 8 h high dose, 24 h medium dose and 24 h high dose of 0.930, 0.892, 0.896 and 0.884, respectively. These AUC's are higher than for the baseline classifier (predicting all compounds as most-DILI with an accuracy of 87,5% and a balanced accuracy of 48.8%), which was 0.875.
Biological interpretation
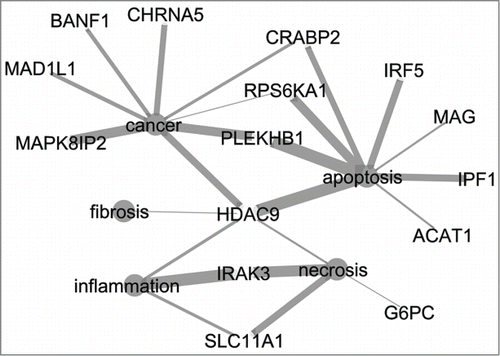
The gene signature list from the best prediction model, i.e., the 8 h medium dose model, was further investigated using the text mining tool CoPubCitation16 as pathway finding tools (e.g., MetaCore,Citation17 DAVIDCitation18) did not give any significant (FDR > 0.1) result. Seventy-one genes were uploaded of which 68 were found in the database from CoPub. In the annotation analysis co-occurrence of these genes with category terms for disease, liver pathology and general pathology were identified (.). Fifteen genes are related to cancer, apoptosis, necrosis, inflammation and fibrosis ().
Table 3. Result of annotation analysis in CoPub showing co-occurances for input gene set and terms for disease, general pathology and liver pathology
Figure 2. Network of 15 genes from the signature list of the 8 h medium dose prediction model and five terms related to relevant processes for DILI (cancer, apoptosis, fibrosis, necrosis, inflammation). Thickness of edges indicate the strength of the connection between the genes and terms. CytoscapeCitation19 was used to visualize the network.
Discussion
In this study, we aimed at developing an in vitro human transcriptomics-based method for predicting DILI using data sets from TGP. Compounds for most-DILI and no-DILI potential were split into a training and validation set based on in vivo rat clinical chemistry measurements from TGP. Four prediction models have been evaluated, showing a clear trend that accuracy improves for lower dosage and shorter exposure. The best accuracy for the validation set (96% for the most-DILI group; 50% for the no-DILI group, 91% overall and 73% balanced) was achieved using expression data from primary human hepatocytes exposed to compounds with a medium dosage for 8 h. This result is better than those of the human in vitro models, where the compounds were randomly distributed into the training and validation sets, which resulted in accuracies for the validation set of 92–96% for the most-DILI group; 0% for the no-DILI group, 79–84% overall and 46–48% balanced (data available on request). The four prediction models also outperform the baseline prediction as shown by the AUC's for the PRC.
Prediction of the no-DILI compounds has clearly improved by the models presented in this study compared with the random selection approaches. Still the lower accuracy for the no-DILI compounds could be due to the distribution of the classes in the prediction models. In imbalanced data sets prediction models tend to classify all the data into the majority class, which in this study is the most-DILI group.Citation20 There are several solutions, e.g., smoting, oversampling, undersampling to overcome this problem.Citation20,21 Since we adopted the PAM tool form our previous studyCitation9 no other algorithms have been applied in this study. Other methods could result in over-fitting (e.g., oversampling) or loss of valuable information (e.g., undersampling) in the PAM classification. Therefore, the best solution will be to increase the number of no-DILI compounds. However, for the >100 identified no-DILI compoundsCitation1,12 suitable data sets, beside those used in this study, are lacking thus far.
The gene signature list for the 8 h medium dose model consists of 71 genes of which 15 genes show co-occurrence with DILI related terms (). From these 15 genes HDAC9 seems to play an important role as it is connected to all terms displayed in . Histone deacetylases are linked to a variety of functional processes beyond chromatin and epigenetic gene regulation,Citation22 e.g., cell cycle and proliferation processes. In different cancer types aberrant expression of HDACs has been observed and HDACs have gained interest as promising targets in cancer therapeutics.Citation23 Further interesting genes from the signature list are IRAK3, RPS6KA1 and MAD1L1. IRAK3 plays a role in alcohol-induced liver injury,Citation24 RPS6KA1 is involved in hepatic steatosisCitation25 and MAD1L1 plays a role in mitotic checkpoint control in liver cancer.Citation26,27
In summary, the result of the human in vitro transcriptomics based model (8 h medium dose) in this study is very promising with >90% correct prediction (AUC of 0.879) for DILI potential in human. However, further validation is necessary, especially for no-DILI compounds as these are underrepresented in this study.
The 15 genes from the signature list are related to relevant processes for DILI. These genes indicate the biological relevance of the prediction model and therefore are interesting markers.
Material and Methods
Description of data sets
All models described in this study were based on transcriptomics, clinical chemistry and DILI potential data for 58 compounds (). The transcriptomics data from in vitro primary human hepatocytes and in vivo clinical chemistry data from rats with a daily repeated treatment were obtained from the Japanese Toxicogenomics Project (TGP). These data sets have been well described previously.Citation7 Information on DILI potential, i.e., for most-DILI and no-DILI concern, was obtained according to FDA's guidance.Citation1,12
Selection of compounds
Compounds for the training and validation sets were selected from the DILI potential groups most-DILI and no-DILI, based on the in vivo clinical chemistry measurements of alkaline phosphatase (ALP), total bilirubine (TBIL), aspartate aminoptansferase (AST), alanine aminotransferase (ALT), lactate dehydrogenase (LDH) and Y-glutamyltranspeptidase (GTP) from rats with a daily repeated treatment (high dose; all time points). The selection was done using the followings steps:
The clinical chemistry measurements for the highest dose were log2 transformed and log2 ratios were calculated for each compound per time point to its corresponding controls;
a score was given to increasing bins of the log2 ratios based on the distribution of these log2 ratios:
log2 ratio ≤ 0 → score 0 (overall 50%);
log2 ratio > 0–0.25 → score 1; (overall 23%)
log2 ratio > 0.25–0.5 → score 2 (overall 13%);
log2 ratio > 0.5–1.0 → score 3 (overall 8%);
log2 ratio > 1 → score 4 (overall 5%);
the sum of scores for the clinical chemistry measurements per time point was calculated;
compounds from the most-DILI group with a sum of scores ≥7 (corresponding to a percentile of 0.7) and compounds from the no-DILI group with a sum of scores ≤3 (corresponding to a percentile of 0.3) for any given time point were selected for the training set;
the selected compounds were manually verified before the selection of the training set was finalized. All other compounds were placed in the validation set. Compounds selected for the most-DILI group were verified for whether the clinical chemistry measurements decreased over time and whether a sum of scores ≥7 was not the result of outliers. Compounds selected for the no-DILI group were evaluated when showing both a sum of scores ≤3 as well as ≥7.
Gene signatures
Microarray data from primary human hepatocytes exposed to medium or high doses for 8 or 24 h were used to establish gene signatures for each training set of compounds. Per compound the expression data (including all dosages, controls and time-points) were Robust Multi-array Average (RMA) normalizedCitation28 and re-annotated to the MBNI Custom CDF-files v15Citation29 using the webtool arrayanalysis.org,Citation30 resulting in log2 intensities for 19,008 NCBI Gene IDs. Log2 ratios were calculated for each replicate to the corresponding control treatment and subsequently average log2 ratios were calculated for each compound per treatment. These averages were further used in the selection of significantly differentially expressed genes from the compounds of the training set.
Genes with significantly different expression values (P < 0.01) between the most-DILI and no-DILI groups for each training set were selected from the expression data based on a series of 26 t tests. For each t test one of the compounds was removed (leave-one-out procedure). The significant genes that were present in the intersection of all lists from the 26 t tests were selected for training the prediction model as signature.
Training and validation of prediction models
PAM (Prediction Analysis for Microarrays 2.13, Stanford University Software) analysisCitation10 was conducted for each of the signature lists for class prediction. For each prediction model gene expression values (averaged log2 ratios) from the signature lists of the compounds in the training set were used as input for PAM to train the model. The threshold was set to zero for predicting the properties of the compounds in the validation set. Misclassification errors (ME) for the training set were calculated for each prediction model. For the prediction of the compounds in the training set, the gene expression data from the signature lists of all compounds in the training set except one (leave-one-out approach) were used to generate a predictive model, whereafter that model was tested with the left out compound (threshold: 0). The leave-one-out approach was conducted for all the compounds in the training set.
The performance of the prediction models was also evaluated by precision-recall-curve (PRC) analyses using the Java tool AUCCalculator 0.2 (http://mark.goadrich.com/programs/AUC/). Data were loaded into the program in the form of a tab-delimited file in ROC format with the false positive and true positive rates as described on the website. The number of most-DILI and no-DILI were indicated for each validation set.
Biological interpretation of gene signature lists
The gene signature list for the best prediction model was further investigated for its biological relevance using the text mining tool CoPub.Citation16 CoPub detects co-occurrence between two biological terms, e.g., between gene names and pathways, in abstracts from the MedLine literature database. Here the genes of the signature list were uploaded to CoPub in order to find co-occurrences with category terms for disease, liver pathology and general pathology. This was done in the annotation analysis using the following parameters: 1) Abstract count threshold: ≥3 co-publications; 2) R scaled score threshold: ≥30.
Disclosure of Potential Conflicts of Interest
No potential conflicts of interest were disclosed.
Acknowledgment
We thank Dr Florian Caiment and Dr Dennie Hebels for their fruitful discussions on labeling and classifying compounds for drug-induced liver injury.
Funding
This work is supported by the European Chemical Industry Council, Long-range Research Initiative (CEFIC-LRI): project LRI-AIMT3-UM:DECO.
References
- Chen M, Vijay V, Shi Q, Liu Z, Fang H, Tong W. FDA-approved drug labeling for the study of drug-induced liver injury. Drug Discov Today 2011; 16:697-703; PMID:21624500; http://dx.doi.org/10.1016/j.drudis.2011.05.007
- Zhang M, Chen M, Tong W. Is toxicogenomics a more reliable and sensitive biomarker than conventional indicators from rats to predict drug-induced liver injury in humans? Chem Res Toxicol 2012; 25:122-9; PMID:22122743; http://dx.doi.org/10.1021/tx200320e
- Blomme EA, Yang Y, Waring JF. Use of toxicogenomics to understand mechanisms of drug-induced hepatotoxicity during drug discovery and development. Toxicol Lett 2009; 186:22-31; PMID:18996174; http://dx.doi.org/10.1016/j.toxlet.2008.09.017
- Natsoulis G, Pearson CI, Gollub J, P Eynon B, Ferng J, Nair R, Idury R, Lee MD, Fielden MR, Brennan RJ, et al. The liver pharmacological and xenobiotic gene response repertoire. Mol Syst Biol 2008; 4:175; PMID:18364709; http://dx.doi.org/10.1038/msb.2008.9
- Nie AY, McMillian M, Parker JB, Leone A, Bryant S, Yieh L, Bittner A, Nelson J, Carmen A, Wan J, et al. Predictive toxicogenomics approaches reveal underlying molecular mechanisms of nongenotoxic carcinogenicity. Mol Carcinog 2006; 45:914-33; PMID:16921489; http://dx.doi.org/10.1002/mc.20205
- CAMDA. 2012. http://camda.bioinfo.cipf.es/camda2012/
- Uehara T, Ono A, Maruyama T, Kato I, Yamada H, Ohno Y, Urushidani T. The Japanese toxicogenomics project: application of toxicogenomics. Mol Nutr Food Res 2010; 54:218-27; PMID:20041446; http://dx.doi.org/10.1002/mnfr.200900169
- CAMDA. 2013. http://dokuwiki.bioinf.jku.at/doku.php
- Magkoufopoulou C, Claessen SM, Tsamou M, Jennen DG, Kleinjans JC, van Delft JH. A transcriptomics-based in vitro assay for predicting chemical genotoxicity in vivo. Carcinogenesis 2012; 33:1421-9; PMID:22623647; http://dx.doi.org/10.1093/carcin/bgs182
- Tibshirani R, Hastie T, Narasimhan B, Chu G. Diagnosis of multiple cancer types by shrunken centroids of gene expression. Proc Natl Acad Sci U S A 2002; 99:6567-72; PMID:12011421; http://dx.doi.org/10.1073/pnas.082099299
- Dobbin KK, Simon RM. Optimally splitting cases for training and testing high dimensional classifiers. BMC Med Genomics 2011; 4:31; PMID:21477282; http://dx.doi.org/10.1186/1755-8794-4-31
- Chen M, Hong H, Fang H, Kelly R, Zhou G, Borlak J, Tong W. Quantitative structure-activity relationship models for predicting drug-induced liver injury based on FDA-approved drug labeling annotation and using a large collection of drugs. Toxicol Sci 2013; 136:242-9; PMID:23997115; http://dx.doi.org/10.1093/toxsci/kft189
- Jennen D, Polman J, Bessem M, Coonen M, Caiment F, Hebels D, et al. DILI classification model based on in vitro human transcriptomics and in vivo rat clinical chemistry data. CAMDA challange 2013; http://dokuwiki.bioinf.jku.at/lib/exe/fetch.php/jennen.pdf
- Giannini EG, Testa R, Savarino V. Liver enzyme alteration: a guide for clinicians. CMAJ 2005; 172:367-79; PMID:15684121; http://dx.doi.org/10.1503/cmaj.1040752
- Tsubouchi H, Ido A, Mawatari S. New Development in Treating Liver Disorders: Approaches to liver function test from mild to fulminant disorders. Japan Medical Association Journal 2010; 53:218-23.
- Fleuren WW, Verhoeven S, Frijters R, Heupers B, Polman J, van Schaik R, de Vlieg J, Alkema W. CoPub update: CoPub 5.0 a text mining system to answer biological questions. Nucleic Acids Res 2011; 39:W450-4; PMID:21622961; http://dx.doi.org/10.1093/nar/gkr310
- MetaCore. http://thomsonreuters.com/metacore/
- Dennis G Jr., Sherman BT, Hosack DA, Yang J, Gao W, Lane HC, Lempicki RA. DAVID: Database for Annotation, Visualization, and Integrated Discovery. Genome Biol 2003; 4:3; PMID:12734009; http://dx.doi.org/10.1186/gb-2003-4-5-p3
- Smoot ME, Ono K, Ruscheinski J, Wang PL, Ideker T. Cytoscape 2.8: new features for data integration and network visualization. Bioinformatics 2011; 27:431-2; PMID:21149340; http://dx.doi.org/10.1093/bioinfor-matics/btq675
- Kotsiantis S, Kanellopoulos D, Pintelas P. Handling imbalanced datasets: A review. GESTS International Transactions on Computer Science and Engineering 2006; 30:25-36.
- Chawla NV, Bowyer KW, Hall LO, Kegelmeyer WP. SMOTE: Synthetic Minority Over-sampling Technique. J Artif Intell Res 2002; 16:321-57.
- Livyatan I, Meshorer E. The HDAC interaction network. Mol Syst Biol 2013; 9:671; PMID:23752267; http://dx.doi.org/10.1038/msb.2013.33.
- Barneda-Zahonero B, Parra M. Histone deacetylases and cancer. Mol Oncol 2012; 6:579-89; PMID:22963873; http://dx.doi.org/10.1016/j.molonc.2012.07.003
- Wang Y, Hu Y, Chao C, Yuksel M, Colle I, Flavell RA, Ma Y, Yan H, Wen L. Role of IRAK-M in alcohol induced liver injury. PLoS One 2013; 8:e57085; PMID:23437317; http://dx.doi.org/10.1371/journal.pone.0057085
- Li S, Ogawa W, Emi A, Hayashi K, Senga Y, Nomura K, Hara K, Yu D, Kasuga M. Role of S6K1 in regulation of SREBP1c expression in the liver. Biochem Biophys Res Commun 2011; 412:197-202; PMID:21806970; http://dx.doi.org/10.1016/j.bbrc.2011.07.038
- Nam CW, Park NH, Park BR, Shin JW, Jung SW, Na YW, Seo JH. Mitotic checkpoint gene MAD1 in hepatocellular carcinoma is associated with tumor recurrence after surgical resection. J Surg Oncol 2008; 97:567-71; PMID:18491369; http://dx.doi.org/10.1002/jso.20999
- Sze KM, Ching YP, Jin DY, Ng IO. Role of a novel splice variant of mitotic arrest deficient 1 (MAD1), MAD1beta, in mitotic checkpoint control in liver cancer. Cancer Res 2008; 68:9194-201; PMID:19010891; http://dx.doi.org/10.1158/0008-5472.CAN-08-2600
- Irizarry RA, Hobbs B, Collin F, Beazer-Barclay YD, Antonellis KJ, Scherf U, Speed TP. Exploration, normalization, and summaries of high density oligonucleotide array probe level data. Biostatistics 2003; 4:249-64; PMID:12925520; http://dx.doi.org/10.1093/biostatistics/4.2.249
- Dai M, Wang P, Boyd AD, Kostov G, Athey B, Jones EG, Bunney WE, Myers RM, Speed TP, Akil H, et al. Evolving gene/transcript definitions significantly alter the interpretation of GeneChip data. Nucleic Acids Res 2005; 33:e175; PMID:16284200; http://dx.doi.org/10.1093/nar/gni179
- Eijssen LM, Jaillard M, Adriaens ME, Gaj S, de Groot PJ, Müller M, Evelo CT. User-friendly solutions for microarray quality control and pre-processing on ArrayAnalysis.org. Nucleic Acids Res 2013; 41:W71-6; PMID:23620278; http://dx.doi.org/10.1093/nar/gkt293