
Figures & data
Figure 1. Tectonic setting of the Te Puninga Fault. A, The Hauraki Rift (dashed rectangular zone), regional active faults (red lines, from the New Zealand Active Faults Database; KF, Kerepehi Fault; TPF, Te Puninga Fault), and recent seismicity (MW >4 earthquakes from 1952 to 2022, from Geonet, https://quakesearch.geonet.org.nz/). B, Detailed map of the Te Puninga Fault (blue, orange and black lines), showing the locations of the two trenches investigated in this project, Ryland and Arnold, and the two swathes where slip rate was calculated (yellow bands).
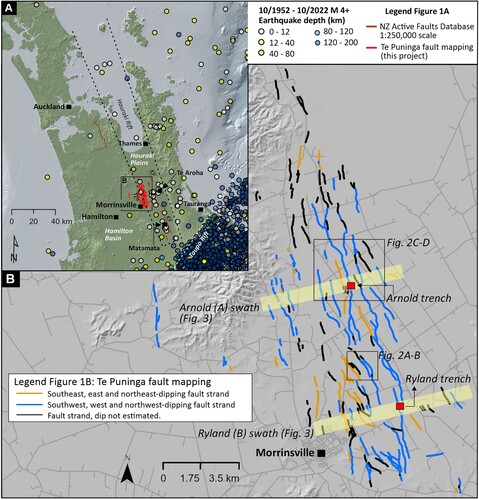
Table 1. Radiocarbon ages obtained from the Arnold and Ryland paleoseismic trenches on the Te Puninga Fault, and from the Hinuera Formation (Hinuera C) near Matamata.
Figure 2. Views of the different geomorphic characteristics of the Te Puninga Fault. A, Area of the Te Puninga Fault around the Waiharakeke West Stream that illustrates the interplay between fault scarps and fluvial terrace risers in locations where the fluvial drainage is parallel with the fault strike. B, Fault mapping interpretation for panel A. C, Area of the Te Puninga Fault in generally very flat topography where the fault scarps are very subtle in the LiDAR hillshade model. D, Fault mapping interpretation of panel C, showing how overlaying a dynamic-range-adjusted digital elevation model over the hillshade model enhances the fault scarps in this area of low topography. The pale-grey lines depict roads.
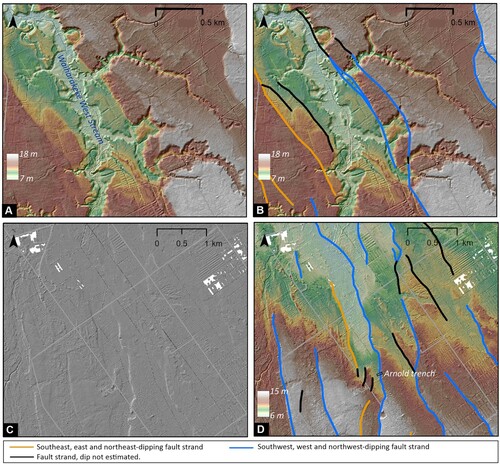
Figure 3. Example of topographic profiling undertaken across the Te Puninga Fault. Arnold (A) and Ryland (B) profiling swaths are indicated by the yellow boxes. White diamonds are location of trenches. Red lines are mapped traces of the Te Puninga Fault and blue dots are topographic profile locations. The white dashed line in (A) delineates the boundary between the two broad groups of surfaces discussed in the text: to the west are older alluvial fan deposits, while to the east, are the low lying surfaces of the Hauraki Plains and the youngest alluvial fan deposit. (C) and (D) are example topographic profiles from the Arnold and Ryland swathes, respectively, where red points are the elevations manually selected to define the slope of the upthrown and downthrown side of the fault resulting in the orange and blue best-fitting lines, respectively.
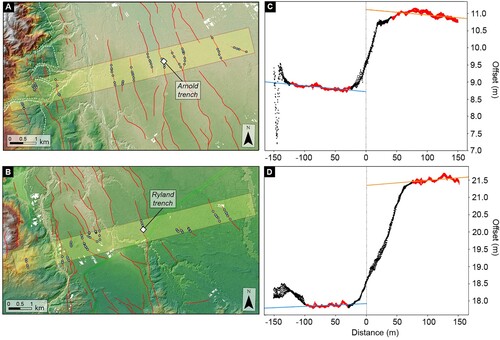
Figure 4. Trench log of the south wall of the Arnold trench. Offset of trench Unit A is indicated by the dashed lines on the left side of the trench log. Units A-C correspond to Hinuera C (Manville and Wilson Citation2004) of Hinuera Formation and unit 1 corresponds to Waitoa Formation (of Houghton and Cuthbertson Citation1989; Brathwaite and Christie Citation1996).
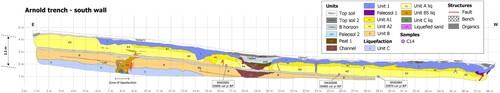
Figure 5. Trench log of the north wall of the Ryland trench. Units A-C correspond to Hinuera C (Manville and Wilson Citation2004) of Hinuera Formation and unit 1 corresponds to Waitoa Formation (of Houghton and Cuthbertson Citation1989; Brathwaite and Christie Citation1996).
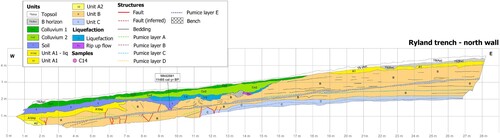
Figure 6. Schematic diagram of the general stratigraphy and chronology of the Arnold (A) and Ryland (B) trenches as east-west cross sections spanning the Te Puninga Fault, showing two or three main stratigraphic units, respectively, and associated pedological soils at the land surface. The surface soil classifications are based on Hewitt (Citation2010) and Hewitt et al. (Citation2021a, Citation2021b); the soil series names are from Wilson (Citation1980). Age on Hinuera C deposits based on this study (); age on base of tephra mantle (in Arnold trench) is based on likely presence of Okareka tephra (c. 23,500 cal yr BP), identified by Hughes (Citation2023); age on Waitoa Formation is from this study (). In Ryland trench, the asterisks in the soil profile represent redox features. Both sketches mimic the trench walls but are not to scale.
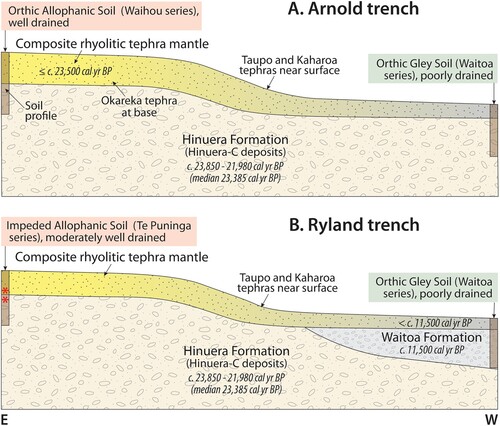
Figure 7. The age model used to constrain the age of the Unit A deposits (95.4% probability range). Median age is 23,385 cal yrs BP. Age model derived from OxCal (v. 4.4; Bronk Ramsey Citation2001, Citation2009) using the SHCal20 calibration curve (Hogg et al. Citation2020).
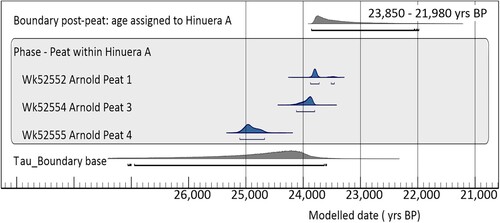
Figure 8. Profiles of cumulative net offset across the Arnold (A) and Ryland (B) profiling swaths. Down to the southwest is positive and down to the northeast is negative. The bold black line is the mean offset and orange bars reflect the 95% confidence interval. Grey lines are different simulations in the Monte Carlo used to propagate uncertainty.
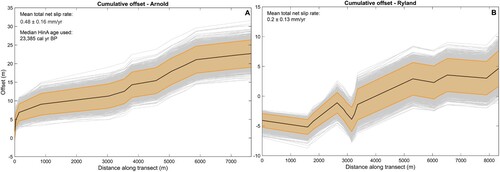
Figure 9. Interpolated along-fault net slip rate profile for the Te Puninga Fault. The red line is the average slip rate whereas the grey dashed lines reflect the two-sigma uncertainties on the net slip rate. Open circles are the net slip rates measured along the Ryland (south part of the fault) and Arnold (middle part of the fault) profiling swaths. The fault is assumed to have 0 mm/yr slip rate at its southern and northern ends.
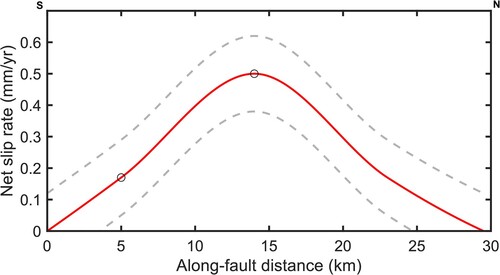
Table 2. Potential Peak Ground Acceleration (PGA) and Modified Mercalli Intensity (MMI) that could be expected in selected townships following rupture of the Te Puninga Fault.
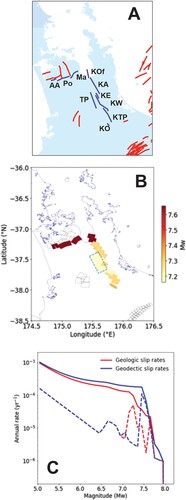
Figure 10. A, Fault sources around the Te Puninga Fault from the NZ Community Fault Model (NZ CFM, Seebeck et al. Citation2023). In blue are active faults that could rupture with the Te Puninga (TP) Fault based on the grand inversion in the 2022 NZ NSHM (Gerstenberger et al. Citation2022), namely: segments of the Kerepehi Fault (KO, Okoroire; KTP, Te Poi; KW, Waitoa; KE, Elstow; KA, Awaiti; KOf, Offshore) and the Mangatangi (Ma), Pokeno (Po) and Aka Aka (AA) faults. In red are other fault sources in the NZ CFM. B, Single-event ruptures of multiple faults that include the Te Puninga Fault (dashed box) are depicted by the filled polygons. The larger magnitude events are superimposed by the smaller magnitude ones. Open polygons denote fault segments (of the Community Fault Model; Seebeck et al. Citation2023) that do not participate in any of the ruptures involving the Te Puninga Fault. C, Participation magnitude frequency distribution of the events associated with the Te Puninga Fault. The event rates include those given by inversion of slip rates and distributed (or background) seismicity. The former accounts for magnitudes larger than Mw 6.8. The event rates derived from the inversion of the geologic slip rates (red lines) show a characteristic event with the mode at Mw ∼7.25, while those derived from the inversion of geodetic slip rates (blue lines) show the mode at Mw ∼7.45. The dataset shown in (B) and (C) was extracted from the 2022 NZ NSHM (Gerstenberger et al. Citation2022).
Data availability statement
The authors confirm that the data supporting the findings of this study are available within the article and its supplementary materials [https://doi.org/10.21420/bh9t-fr52]. Active fault traces are currently in the processed of being incorporated into the publicly available NZ Active Fault Database [https://www.gns.cri.nz/data-and-resources/new-zealand-active-faults-database/].