
Figures & data
Figure 1. Cytotoxicity of VRE. Fcwf-4, CrFK, and PBMC were incubated with VRE for 3 days, and the cytotoxicity was quantified using CCK-8 assay. Cell viability was normalized to that of the untreated controls (100%). Data in the plot represents the mean ± SD of four replicates.
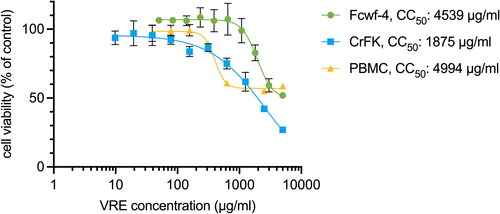
Figure 2. Antiviral activity of VRE against FIPV. (A) VRE was added during FIPV infection, and the antiviral activity of VRE was verified at 24 hpi using CPE analysis, alamarblue assay, Western blotting, and plaque assay. (B) Images of infected Fcwf-4 cells were observed at 24 hpi. Uninfected cells were used as controls. (C) The CPE reduction activity of VRE against FIPV was determined using alamarblue assay. Data in the plot represents the mean ± SD of three replicates. (D) Viral titers in the culture supernatant were determined using plaque assays. Virus titers between each treated group and the untreated control group were compared using one-way ANOVA followed by Dunnett’s multiple comparisons tests (ns: non-significant; ****p < 0.0001; **p < 0.01). Values are the mean ± SD of three replicates. (E) Western blotting analysis of FIPV N protein. GAPDH is the housekeeping protein used as the loading control.
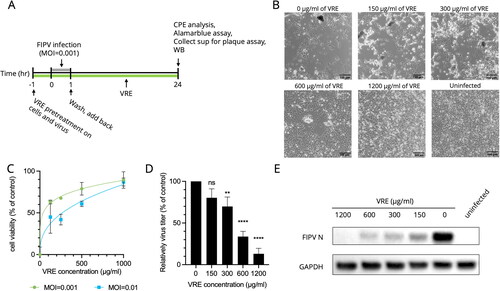
Figure 3. VRE anti-FIPV activity in different infection states. (A) Schematic diagram of the VRE virucidal activity assay. VRE (1200 μg/ml) was incubated with 10,000 PFU FIPV at 37 °C for 1 h, and the viral titer was determined using plaque assay. The VRE-FIPV mixture was inoculated to the Fcwf-4 cells for 1 h, and the cells were fixed and stained with crystal violet at 48 hpi. (B) The viral titer between the VRE-treated and untreated groups was compared using unpaired t-tests (ns: non-significant). (C) VRE anti-FIPV mechanism was analyzed by adding 1200 μg/ml of VRE in six different infection states. At 12 hpi, the supernatants were collected, and viral titers were determined using plaque assay. (D) Virus titers between each treated and untreated control group were compared using one-way ANOVA followed by Dunnett’s multiple comparisons tests (ns: non-significant; **p < 0.01; *p < 0.05). Data are shown as mean ± SD (n = 3). (E) The representative images of cells treated/untreated with 1200 μg/ml of VRE under infection of MOI = 1 for 12 h. (F) VRE anti-FIPV mechanism was analyzed by adding 1200 μg/ml of VRE at five time points: 0, 2, 4, 6, and 8 hpi. The supernatants were collected at 12 hpi for titration. (G) Virus titers in the culture supernatant were determined using plaque assays. The virus titers between each treated group and the untreated control group were compared using one-way ANOVA followed by Dunnett’s multiple comparisons tests (***p < 0.001; **p < 0.01; *p < 0.05). Data are shown as mean ± SD (n = 3).
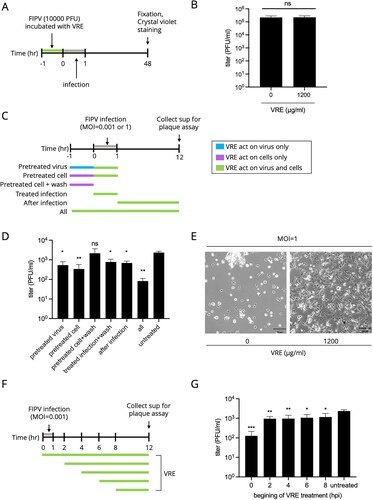
Figure 4. Entry test of VRE against FIPV. (A) Fcwf-4 cells were incubated with FIPV at 4 °C for virus binding for 1 h. After viral binding, the cells were incubated at 37 °C and treated with VRE for 1 h. IFA analysis was conducted at 8 hpi to analyze N protein expression. (B) Representative immunofluorescence images of different concentrations of VRE. FITC (green) signals represent N protein, whereas DAPI (blue) represents the nuclei (magnification: 100×).
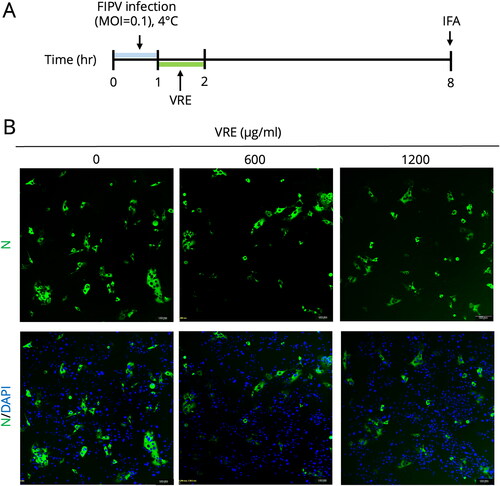
Figure 5. FIPV spike protein analysis. (A) Schematic diagram of testing for VRE inhibition of spike protein. Fcwf-4 cells were infected for 1 h, and VRE was added at 3–8 hpi. IFA and RT-qPCR were performed at 8 hpi to measure S protein expression or mRNA. (B) Representative immunofluorescence images of VRE treated in the late phase of FIPV infection. FITC (green) signals represent S protein, whereas DAPI (blue) represents the nuclei (magnification: 100×). (C) RT-qPCR results were used to quantify S mRNA expression. Data are shown as mean ± SD (n = 3). The S gene mRNA expression between the treated and untreated groups was compared using unpaired t-tests (ns: non-significant). (D) Schematic diagram of the S protein inhibitory effect of VRE when incubated with S protein stably expressing HEK293-UU4-S cells. (E) Western blotting analysis of FIPV S protein in HEK293-UU4-S cells. GAPDH is the housekeeping protein used as the loading control.
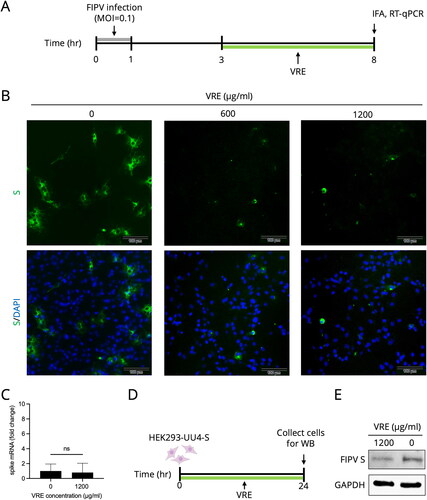
Figure 6. VRE anti-FIPV activity in the in vitro ADE model. (A) Experimental design to examine the inhibitory activity of VRE on FIPV under ADE infection conditions. Different concentrations of VRE were added during ADE infection, and the viral titer was determined using RT-qPCR. (B) The viral titers between the treated and untreated groups were compared using one-way ANOVA followed by Dunnett’s multiple comparisons tests (ns: non-significant; **p < 0.01; *p < 0.05). Data are shown as mean ± SD (n = 3).
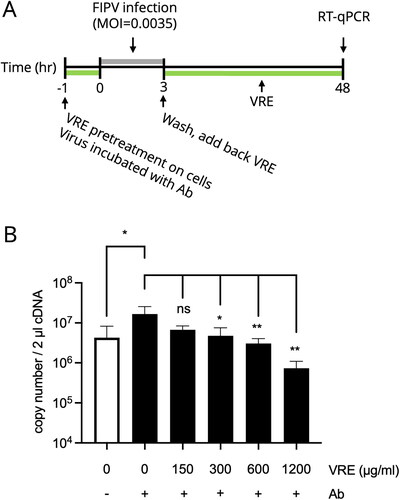
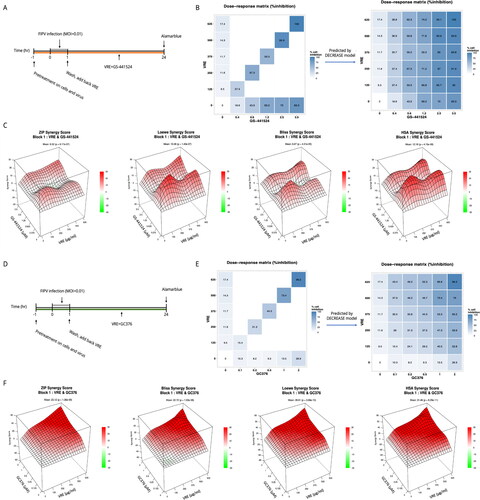
Figure 7. Combinational use of VRE and GS-441524 or GC376 on anti-FIPV activity. (A) Combinations of different concentrations of VRE and GS-441524 were tested during FIPV infection. (B) Dose–response matrix of the combination of VRE and GS-441524. The diagonal elements of the full dose–response matrix were examined (left), and the full dose–response matrix was predicted using the DECREASE model. (C) ZIP, Loewe, Bliss, and HSA score maps for the combination of VRE and GS-441524. A synergy score below −10 indicates an antagonistic interaction between the drugs. Scores ranging from −10 to 10 suggest an additive interaction, whereas scores above 10 indicate a synergistic interaction. (D) Different concentrations of VRE and GC376 were combined during FIPV infection. (E) Dose–response matrix of the combination of VRE and GC376. The diagonal elements of the full dose–response matrix were examined (left), and the full dose–response matrix was predicted using the DECREASE model. (F) ZIP, Loewe, Bliss, and HSA score maps for the combination of VRE and GC376. A synergy score below −10 suggests antagonism between the drugs. Scores within −10 to 10 imply an additive effect, and scores above 10 indicate synergy.
Supplemental Material
Download MS Word (182.5 KB)Data availability statement
The data that support the findings of this study are available from the corresponding author, upon reasonable request.