Figures & data
Figure 1. Location setting of the study sites in South Africa.
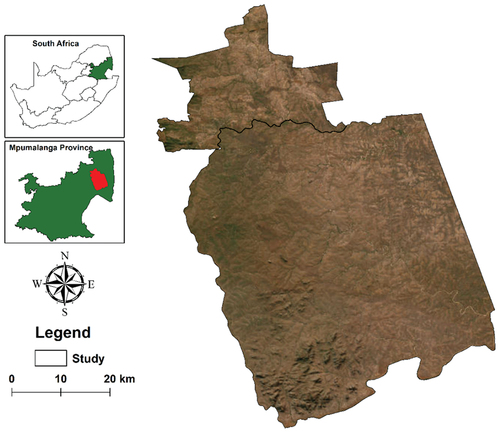
Table 1. Field sampled points.
Figure 2. Flow chart of the methodology.
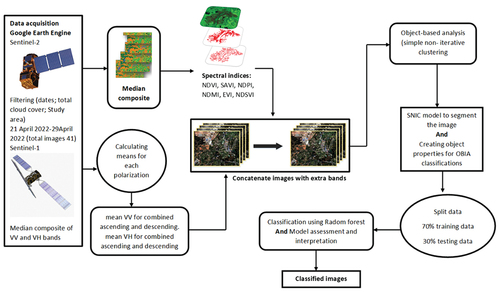
Figure 3. (a) Mean indices values per class extracted from the median composite image using training data; while (b) shows mean spectral reflectance extracted from the median composite image for all the classes in the study area.
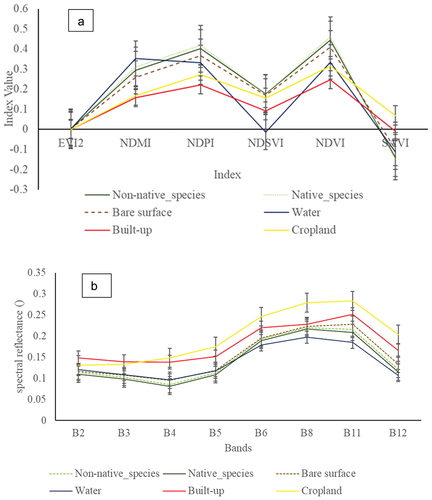
Figure 4. Separability of the six land cover classes, namely non-native woody plants; native plants; bare surface; water; built-up areas; and croplands for the variables Sentinel-1.
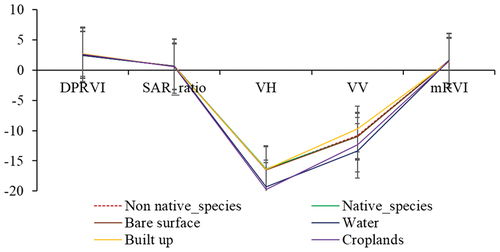
Figure 5. The producer’s accuracy (a) and user’s accuracy (b) from the model incorporating Sentinel-1 and Sentinel-2 data.
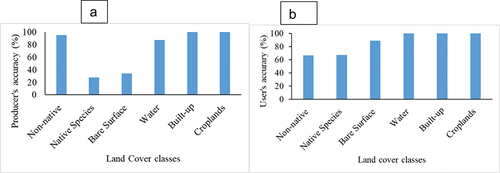
Figure 6. Output of the multispectral integration of Sentinel-1 and Sentinel-2 classification map at 10 m of geometrical resolution of the study area using object-based.
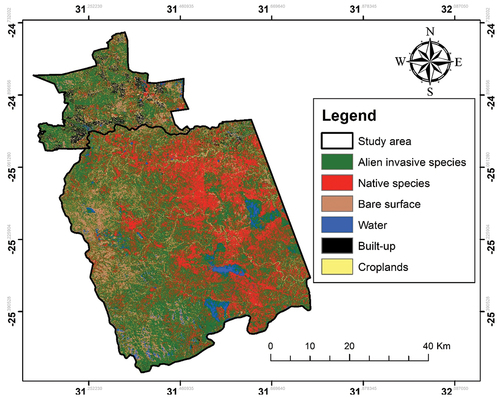
Table 2. The error metrics obtained from different land use classes, wherein the elements are the classification accuracies.
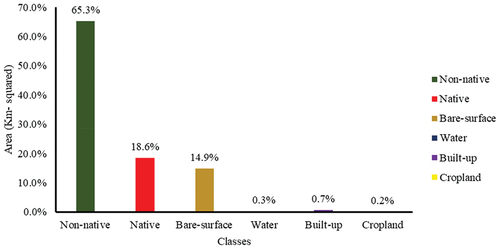
Figure 7. The aerial coverage of the six classes in percentage from the output of Sentinel-2 and Sentinel-1 data.