Figures & data
Figure 1. Example for a snippet pair that is supposed to be non-confusing (a) or confusing (b), depending on whether there is an assignment of a constant inside the while condition.
Table 1. The 26 basic operational components we identified in the items and short descriptions of the challenges that arise from each of them. These components represent the columns of our weight matrix.
Table 2. Results of the conducted LRTs for the split criteria of median of person score, population, and median of experience. The columns refer to the test statistic (LR), the degrees of freedom
, the critical
value for a corrected significance level
of the respective test distribution, as well as the associated
-value.
Figure 2. Graphical model checks for the three LRTs. Each plot depicts item difficulty parameter estimates (“betas”) for the subgroups of each LRT (person score, population, and experience). Blue dots represent item difficulty estimates, grey ellipses represent the two-dimensional confidence intervals () associated with the item estimates.
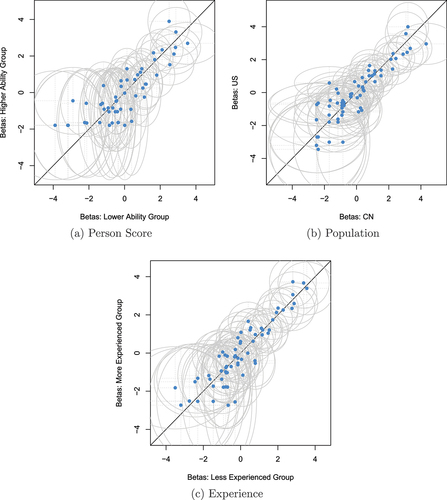
Figure 3. Person-item map of our RM. The upper histogram reflects the distribution of our subjects’ ability parameters. The lower part of the figure depicts the item difficulty for every item in our dataset. The items are marked by horizontal ticks on the left and are ordered by difficulty (from easy items on top to difficult items on the bottom).
Table 3. Estimates of parameters (basic components) of our LLTM, their standard errors (
), the respective 99% confidence interval, as well as the number of atoms containing the respective component (
).
Table 4. Model fit of the estimated RM and LLTM as well as results of a difference test for model comparison.
logLikelihood;
number of model parameters;
likelihood ratio, also denoting a
value;
the difference in degrees of freedom between the models.
Figure 4. Estimated RM item difficulty parameters plotted against the (mean-centered) item difficulty parameters reconstructed by LLTM’s estimated basic parameters. The 45° line indicates the hypothetical line the dots would be at if parameters were perfectly equal.