Figures & data
Figure 1. Illustration of the planing boat in calm water. (SkyView in CAESES with wave field from Simcenter STAR-CCM+).
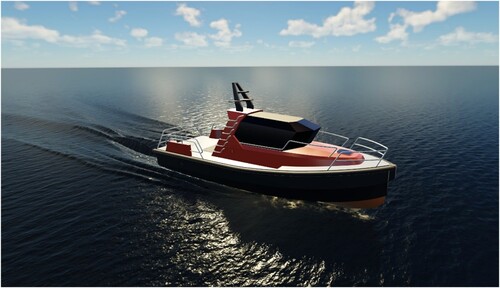
Table 1. Outline of the paper.
Figure 2. Side view of bare hull without tunnels.
Figure 3. Top view of definition of bare hull without tunnels.
Figure 4. Front view of bare hull without tunnels.
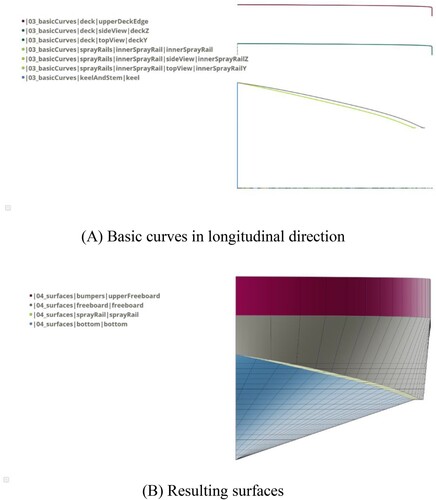
Figure 5. Perspective view of bare hull without tunnels.
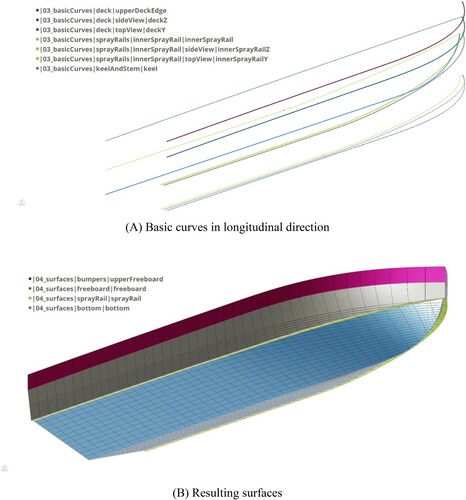
Table 2. Global parameters of the planing boat (parameters featuring sliders are free variables with given lower and upper bounds).
Table 3. Parameters of basic curves.
Table 4. Parameters of the tunnel (N.B. The tunnel radius is kept constant during the optimizations).
Figure 6. Tunnel geometry defined via a Gordon surface.
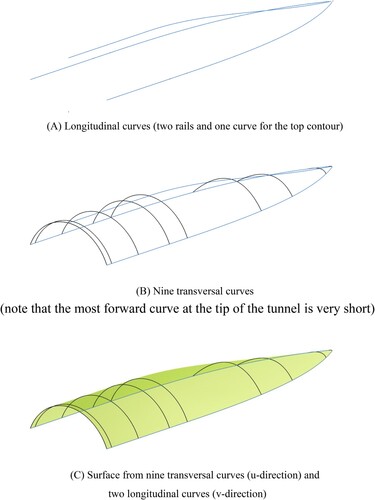
Figure 7. Isophotes on tunnel modelled as a Gordon surface.
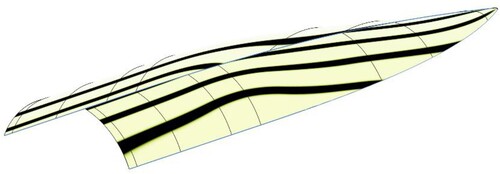
Figure 8. Example variations of the tunnel (before assembly with the bare hull).
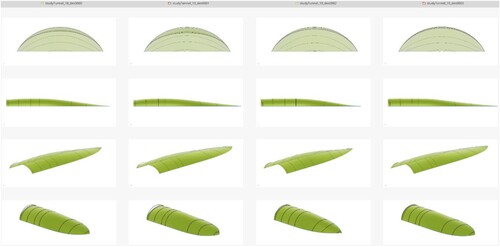
Figure 9. Perspective view of assembly of final hull from bare hull and tunnel. (A) Tunnel geometry (green surface) converted into a solid and rotated to position (grey), protruding into the bare hull (semi-transparent solid in blue for the bottom and the freeboard with purple for the transom); (B) Imprint of the tunnel (green region) in solid for the bare hull (blue).
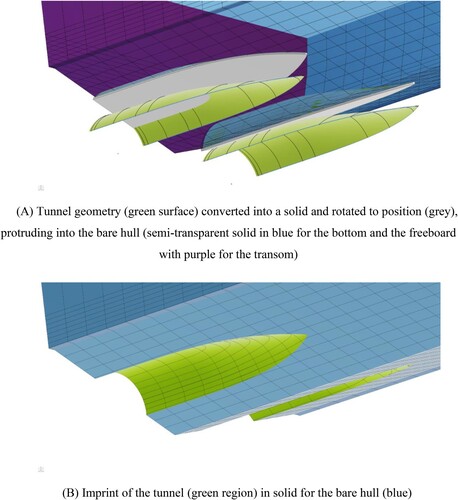
Figure 10. Perspective view of aftbody with all components put together (shaft line and bracket conceptually approximated for illustration).
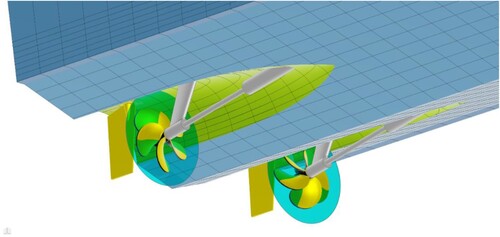
Figure 11. Example variations of the bare hull with tunnel.
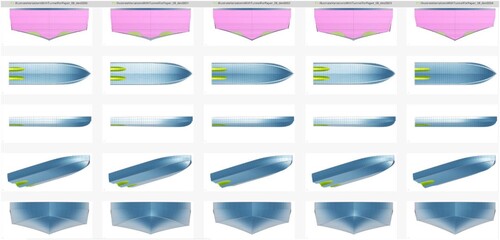
Figure 12. Appended hull with actuator disk for CFD simulations within Simcenter STAR-CCM + (rudder omitted).
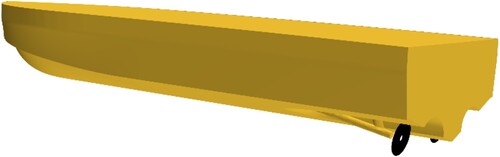
Table 5. Principal dimensions at full-scale and at model scale (model scale of 3.2871).
Figure 13. Overset grid around the ship within Simcenter STAR-CCM +.
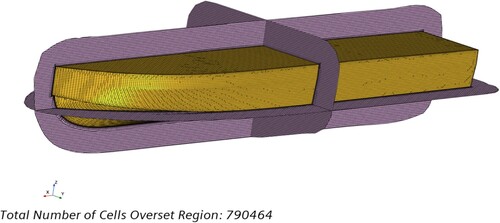
Figure 14. y+ distribution on the hull at convergence (bottom view) within Simcenter STAR-CCM +.
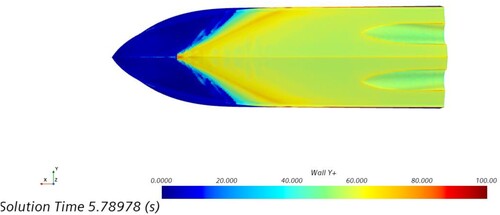
Figure 15. Overset grid with adaptive mesh refinement.
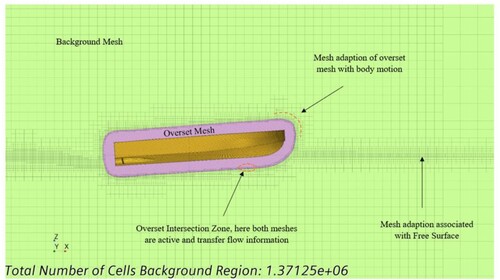
Figure 16. Wave forcing zones and boundary conditions (bow pointing to the right).
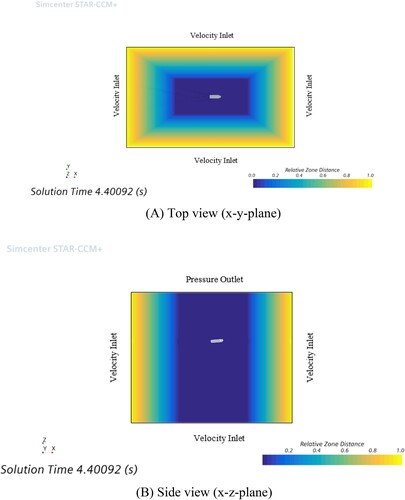
Table 6. Grid convergence study.
Figure 17. Dependency of drag (resistance) on mesh size.
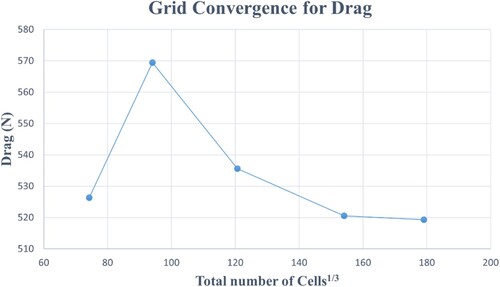
Figure 18. Dependency of heave (rise) and pitch (trim) on mesh size.
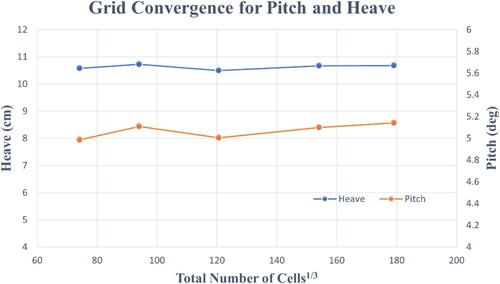
Figure 19. Simulation time vs. mesh size.
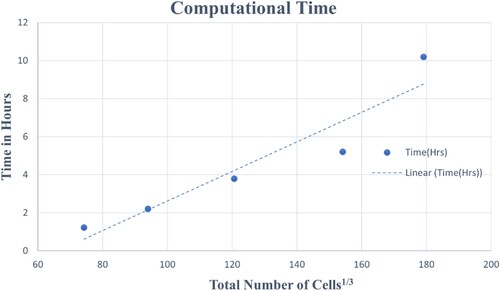
Figure 20. Model test in TU Berlin’s large towing tank.
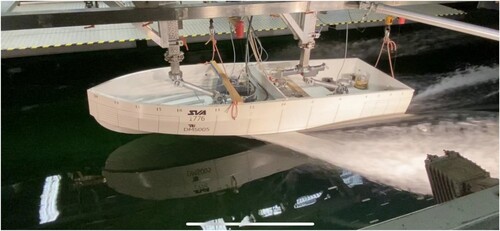
Table 7. Validation at model-scale for various speeds.
Figure 21. Comparison of numerical (orange) and experimental (blue) values for resistance (drag).
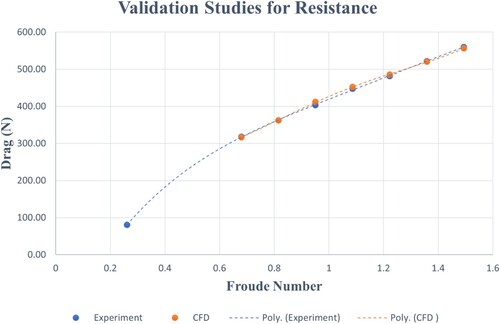
Figure 22. Comparison of numerical (orange) and experimental (blue) values for trim (pitch).
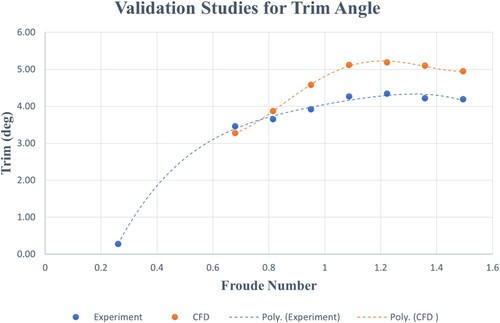
Figure 23. Comparison of numerical (orange) and experimental (blue) values for heave (rise) (only one measurement point available).
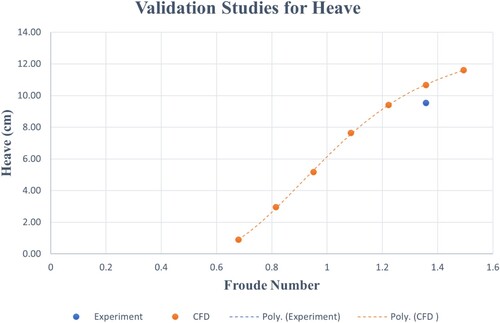
Figure 24. Variations of geometry and collection of simulation results as summarized in CAESES.
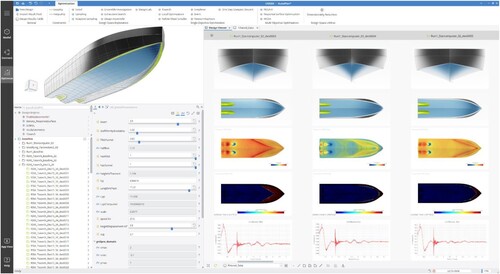
Figure 25. Initial tunnel (left) and new tunnel (right), before rotation to position above the propeller (compare to ).
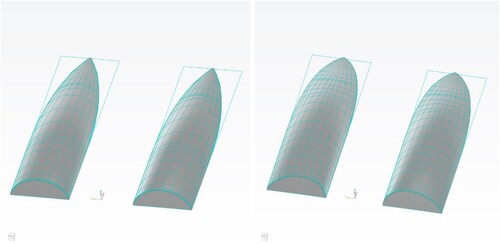
Figure 26. Free surface for planing hull with initial tunnel (first baseline).
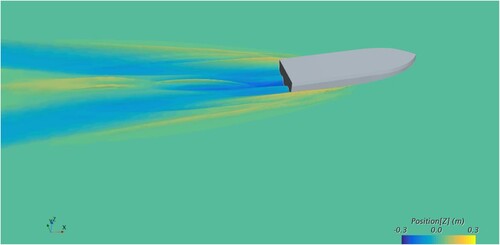
Figure 27. Free surface for planing hull with new tunnel (without pretrim).
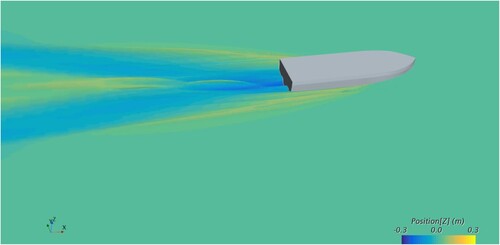
Table 8. Comparison of model-scale data for the boat with the initial and the new tunnel using CFD.
Figure 28. Pressure distribution for boat with initial tunnel as computed with Simcenter STAR-CCM +.
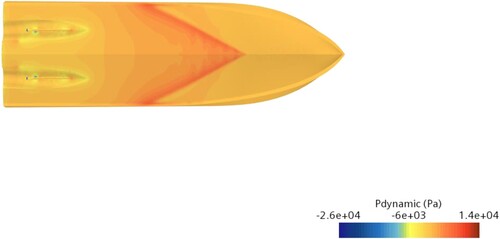
Figure 29. Pressure distribution for boat with new tunnel as computed with Simcenter STAR-CCM +.
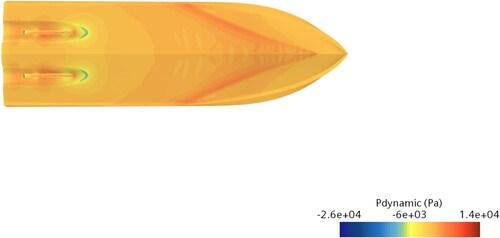
Table 9 . Sensitivity analysis of LCG for boat with new tunnel, using CFD (negative static trim refers to bow down, positive trim means bow up).
Figure 30. Change of resistance by moving the longitudinal centre of gravity.
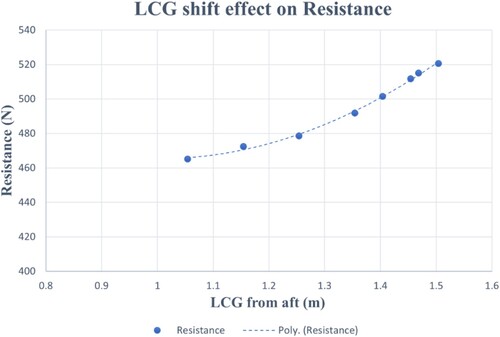
Figure 31. Pressure distribution for boat with new tunnel and LCG shifted aftwards as computed with Simcenter STAR-CCM +.
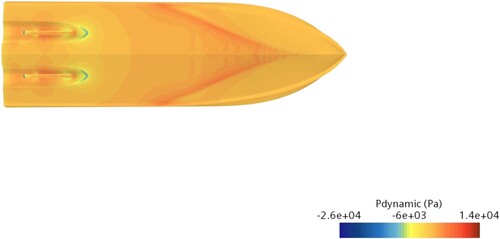
Figure 32. LCG effect on resistance (drag) components.
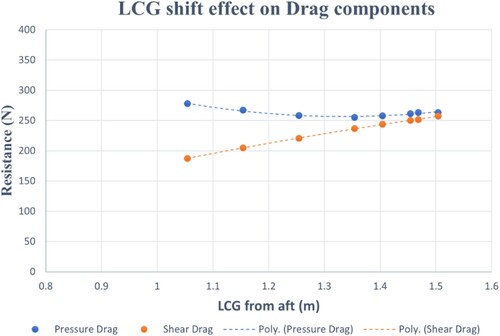
Table 10. Effect of appendages on performance.
Table 11. Effect of mesh size on performance.
Figure 33. Overview of the overall design process and the various SDD campaigns (below the dashed line) along with resulting designs.
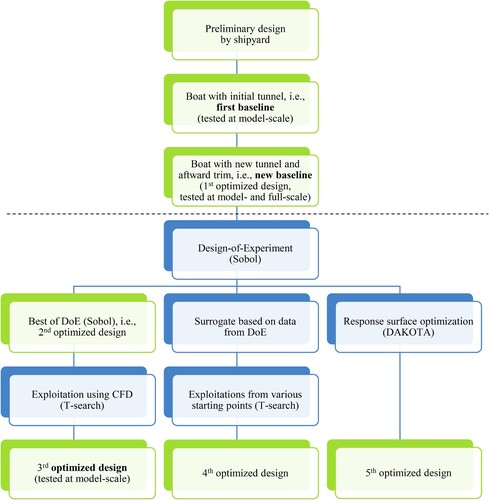
Table 12. Lower and upper bounds of design variables for the SDD campaigns.
Figure 34. Thrust, drag, pitch, heave etc. as functions of several free variables from DoE.
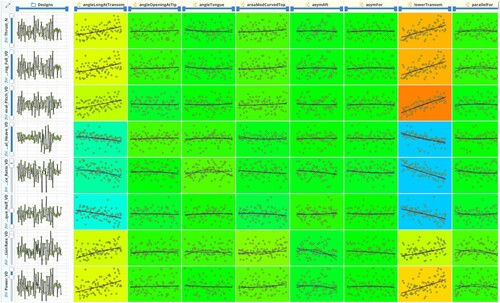
Figure 35. Change of objective vs. variants in DoE.
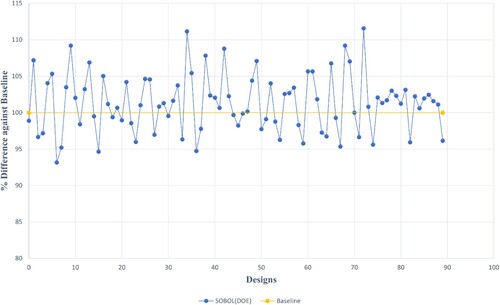
Figure 36. Deterministic optimization via a T-search, starting from DoE’s design number 15 with thrust of one propeller as the objective.
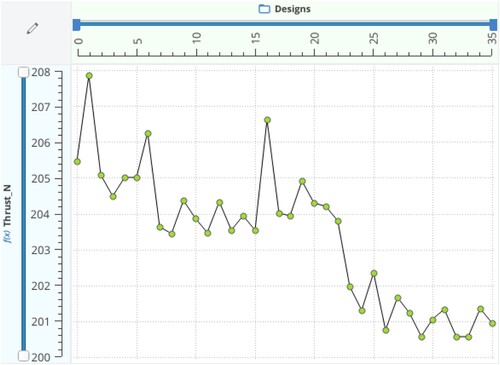
Figure 37. History of the T-search run on the surrogate (grey line) vs. history of the T-search run on the basis of CFD simulations (orange line).
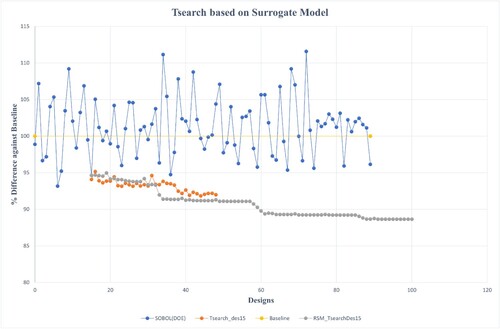
Table 13. Validation of the Kriging based ML model.
Table 14. Summary of optimization results.
Table 15. Optimization Results for Appended Model with Finer Mesh.
Figure 38. Free surface for new baseline (new tunnel with pretrim) (also compare to and ).

Figure 39. Free surface for 3rd optimized design (also compare to and ).
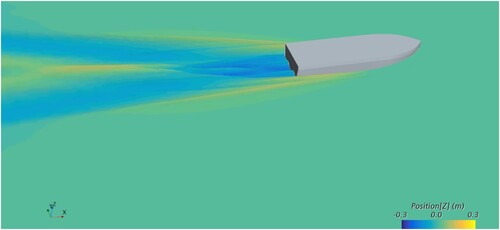
Figure 40. Free surface for 4th optimized design (also compare to and ).
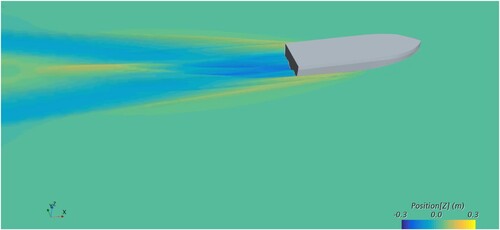
Figure 41. Stern views of wave fields for selected designs.
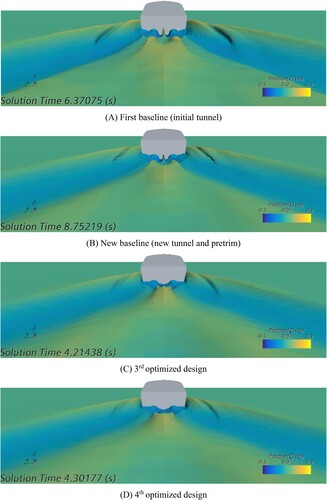
Figure 42. Pressure distribution for 3rd optimized design as computed with Simcenter STAR-CCM + (also compare to and ).
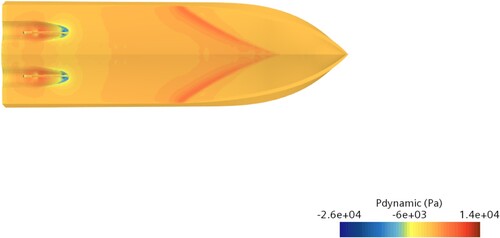
Figure 43. Perspective view of selected designs.
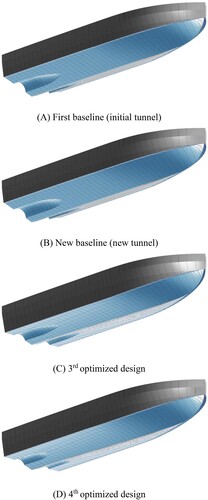
Figure 44. Side view of selected designs.
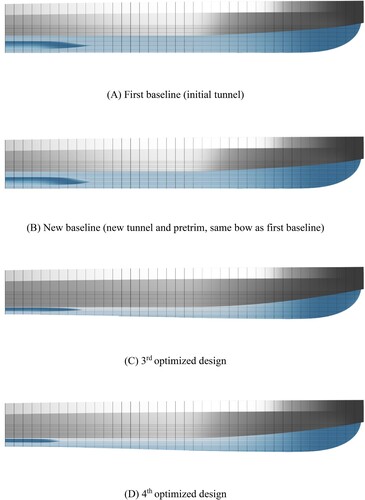
Figure 45. Bottom view of selected designs.
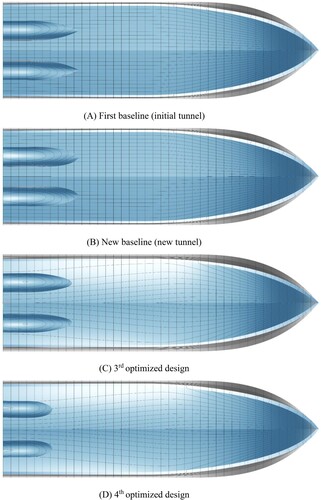
Figure 46. Transom view of selected designs.
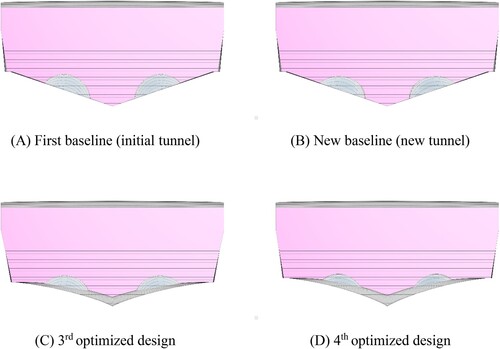
Figure 47. Propeller thrust at model-scale vs. speed for the new baseline and the 3rd optimized design at three representative displacements.
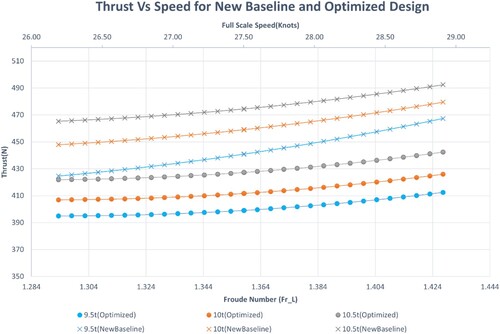
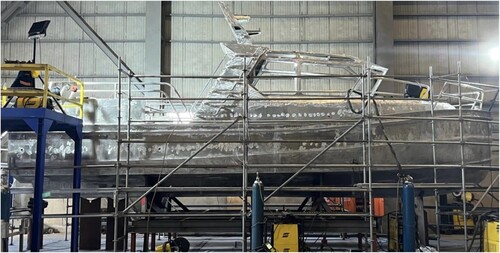
Figure 48. Full-scale prototype being built at UZMAR (photo courtesy of Nalan Erol, AutoPlan project coordinator).