
Figures & data
Table 1. Different degree programs at the medical faculty of the University of Groningen, The Netherlands, for the academic years 2018/19 and 2019/20.
Figure 1. Flowchart showing the EDM data processing steps taken in this study.
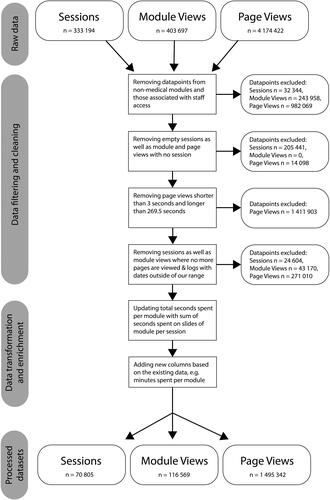
Figure 2. Distributions of e-learning session start times per day of the week starting with monday at the bottom. For smoothing, a kernel density estimation with a bandwidth of 300 datapoints was used to depict the data. The total number of sessions per weekday are given as n. The hourly rhythm defines weekday (light grey) studying behavior between 9:00 and 16:00 and a more uniform distribution defines evenings and weekend days (dark grey).
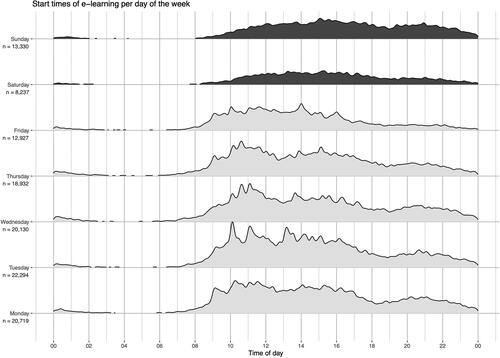
Figure 3. Earliest start times of users during the week (light grey) and the weekend (dark grey).
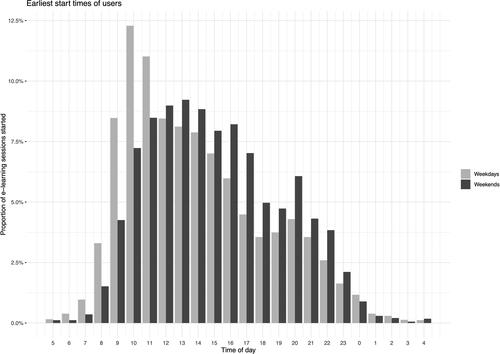
Figure 4. Number of e-learning sessions started at each hour of the day, grouped by weekday (upper bar chart) and weekend activity (lower bar chart). ‘early bird’ activity is shown in red and ‘night owl’ activity in blue.
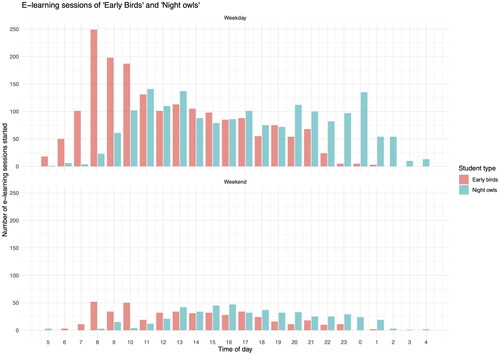
Table 2. Descriptive statistics of time of day (hour) when different students study.
Figure A1. Time spent in minutes per e-learning session. A session contains all activity from a user within 24h. The mean time spent on a session (red line) is 16.8 min (range 0.05 - 369.9 min, median 7.3 min, skewness 2.6 and kurtosis 14.4).
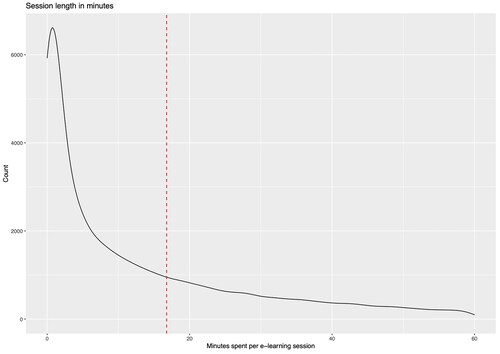
Figure A2. Time spent in minutes per e-learning module. The mean time spent on a module (red line) is 10.2 min (range 0.05–176.9 min, median 3.9 min, skewness 2.4 and kurtosis 9.9).
