
Figures & data
Figure 1. Graphical abstraction continuum for visualizing point feature landmarks on mobile maps (after Elias & Paelke, Citation2008, p. 44).
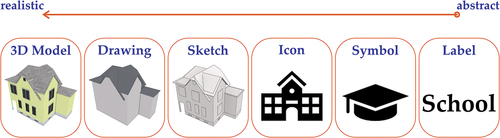
Figure 2. The interactive mobile map application depicts navigation-relevant landmarks either as abstract (a) or realistic (b) 3D buildings (the inset view shows a zoomed-in landmark in the respective visualization style) and the route to be followed.
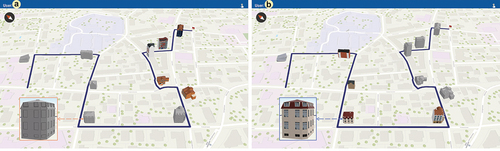
Table 1. Normalized fixation duration (nFD) in the environment AOI is predicted by the interactions of QSS score and familiarity with the visualization conditions.
Figure 3. The normalized fixation duration (nFD) in the environment increases with higher spatial abilities when wayfinders navigate with realistic 3D landmarks (a). However, this is not influenced by environmental familiarity across conditions (b). Shaded areas correspond to 95% confidence intervals (CIs).
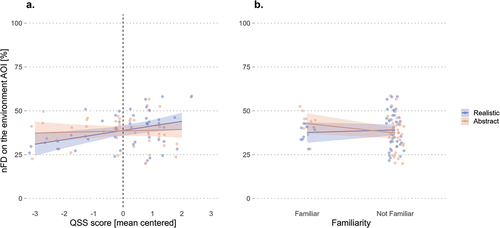
Table 2. Normalized fixation duration (nFD) on the mobile map AOI is not predicted by the fixed effects or the interactions between the fixed effects.
Figure 4. Realistic landmarks prompt longer normalized fixation duration (nFD) on the landmark AOI for low-spatial-ability wayfinders. Shaded areas correspond to 95% CIs.
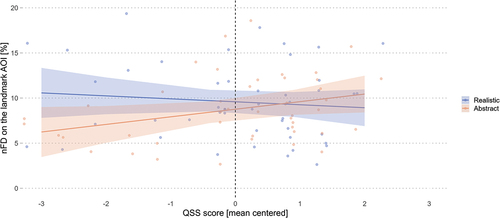
Table 3. Normalized fixation duration (nFD) on the landmark AOI is not predicted by condition, QSS score, familiarity, or fixed-effect interactions.
Table 4. Recognition of environment landmarks is predicted by environmental familiarity and the interactions between nFD in the environment and landmark AOIs with the condition.
Figure 5. Longer normalized fixation duration (nFD) in the environment (a) and on the landmark (b) is associated with improved recognition accuracy of landmarks seen in the environment when wayfinders navigate with realistic 3D landmarks. Shaded areas correspond to 95% CIs.
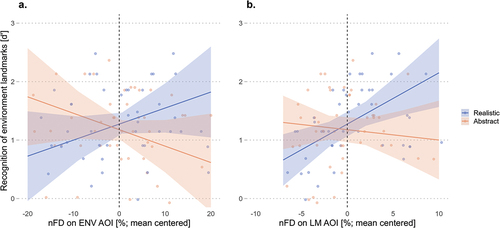
Table 5. The recognition accuracy of landmarks seen on the mobile map is predicted by the QSS score and its interaction with nFD on the environment and on the mobile map.
Figure 6. Improved recognition accuracy performance of landmarks featured on the mobile map with increased QSS score, regardless of the landmark visualization style (a); improved performance for high-spatial-ability wayfinders and deteriorated performance for low-spatial-ability wayfinders with increased attention in the environment (b) and on the mobile map (c) AOIs. Shaded areas correspond to 95% CI.
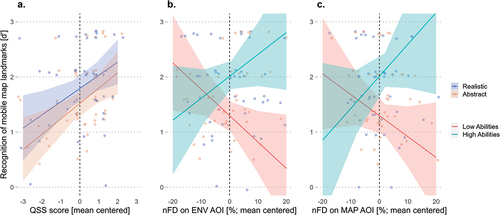
Figure 7. Route direction recall accuracy improves with increased spatial abilities, regardless of the landmark visualization style. Shaded areas correspond to 95% CIs.
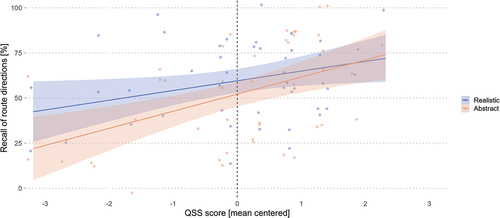
Table 6. Route direction recall accuracy is predicted by the QSS score and familiarity.
Table 7. Reconstruction of landmarks sequence is predicted by QSS and familiarity.
Figure 8. Landmark sequence reconstruction improves with increased spatial abilities regardless of the landmark visualization styles and improves when low-spatial-ability wayfinders navigate with realistic landmarks. Shaded areas correspond to 95% CIs.
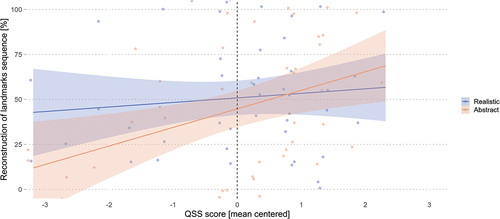
Table 8. Direction estimation accuracy is influenced by the interaction between landmark visualization conditions and the QSS score.
Figure 9. Direction estimation error improves when wayfinders with low spatial abilities navigate with realistic landmarks. Shaded areas correspond to 95% CI.
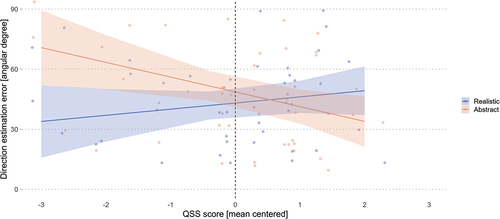
Figure 10. Longer visual attention on the landmarks AOI improves wayfinders’ distance estimation error, regardless of the landmark visualization style. Shaded areas correspond to 95% CI.
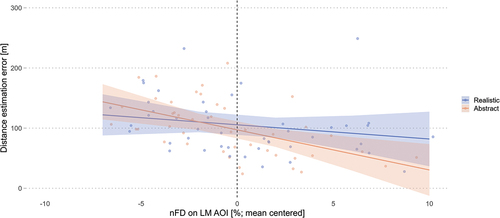
Table 9. The distance estimation error is predicted by the nFD on the landmark AOI.
Data availability statement
This study’s preregistration, data, and analyses (R-code) are available online at the Open Science Framework repository: https://doi.org/10.17605/OSF.IO/AKRJN.