Figures & data
Figure 1. Sampling map of soils and plants within the vicinity of the Morupule fly ash dumpsite.
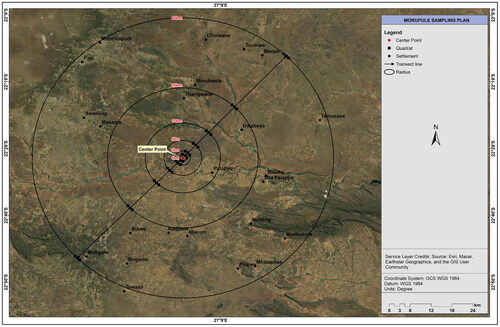
Figure 2. Prevailing wind direction in Mahalapye from 1960 to 2016, representing Palapye area (department of meteorology, Botswana).
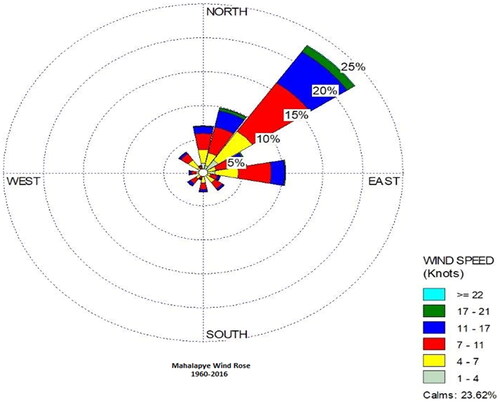
Table 1. Estimates of parameters used in the calculation of daily dietary intake of grazing ruminants from plants in the vicinity of Morupule power station.
Table 2. Physicochemical properties and metal concentration for soils found in the vicinity of morupule power stationTable Footnote1.
Table 3. Palatable plant species from the vicinity of the morupule power station.
Table 4. Diversity index, species richness, and species evenness along the vicinity of morupule power station.
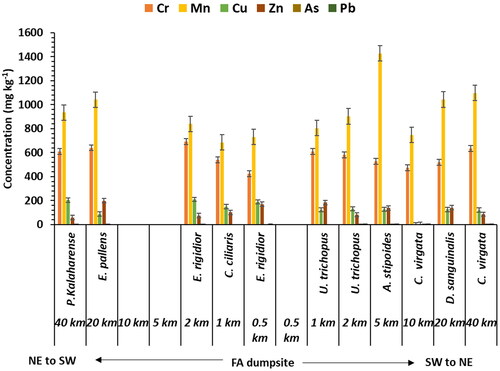
Figure 3. Heavy metal concentration found in dominant herb species growing within 40 km distance of the fly ash dumpsite. (n = 11; mean ± standard deviation). Critical concentration are Cr =75-100a, Mn = 400a, Cu = 100b, Zn = 200b, as = 10-20a, Pb = 20b mg kg-1; aHajar, Sulaiman, and Sakinah (Citation2014) b Manyiwa et al. (Citation2021).
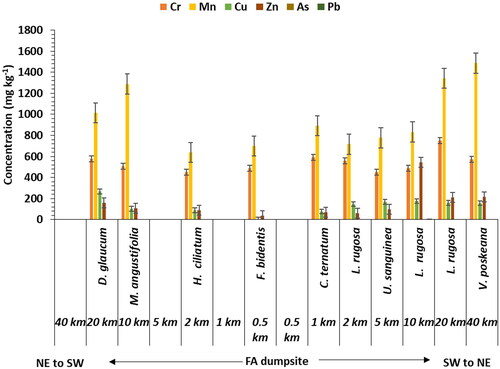
Figure 4. Heavy metal concentration found in dominant shrub species growing within 40 km distance of the fly ash dumpsite. (n = 11; mean ± standard deviation). Critical concentration are Cr =75-100a, Mn = 400a, Cu = 100b, Zn = 200b, as = 10-20a, Pb = 20b mg kg-1; aHajar et al. (2014) b Manyiwa et al. (Citation2021).
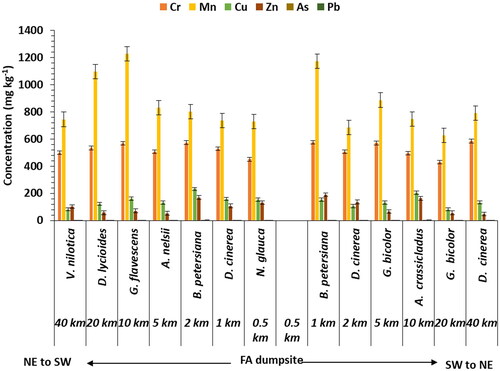
Figure 5. Heavy metal concentration found in dominant tree species growing within 40 km distance of the fly ash dumpsite. (n = 11; mean ± standard deviation). Critical concentration are Cr =75-100a, Mn = 400a, Cu = 100b, Zn = 200b, as = 10-20a, Pb = 20b mg kg-1; aHajar et al. (2014) b Manyiwa et al. (Citation2021).
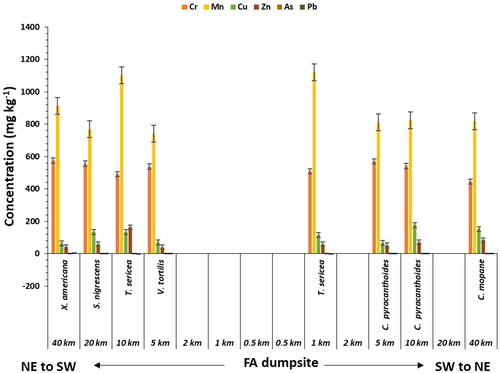
Figure 6. Bioaccumulation factor of heavy metals in the dominating grass species growing within 40 km distance of the fly ash dumpsite (n = 11; mean ± standard deviation).
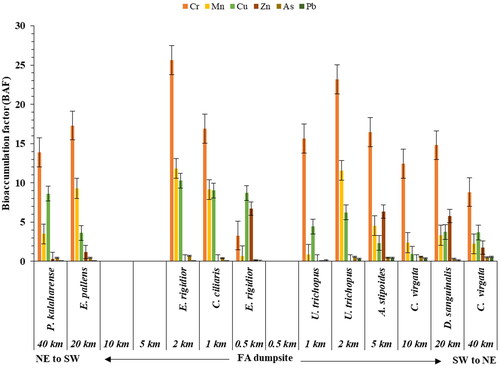
Figure 7. Bioaccumulation factor of heavy metals in the dominating herb species growing within 40 km distance of the fly ash dumpsite (n = 11; mean ± standard deviation).
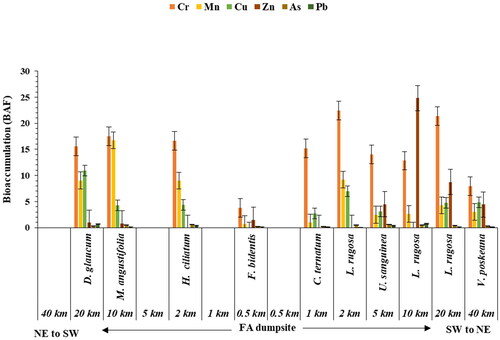
Figure 8. Bioaccumulation factor of heavy metals in the dominating shrub species growing within 40 km distance of the fly ash dumpsite (n = 11; mean ± standard deviation).
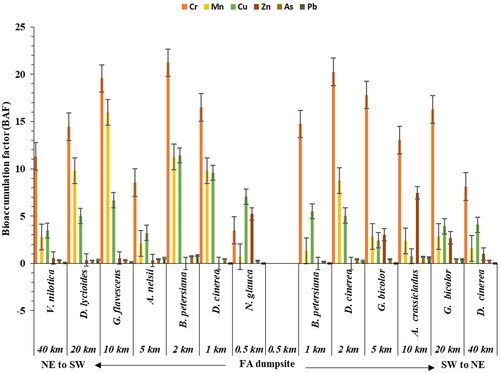
Figure 9. Bioaccumulation factor of heavy metals in the dominating tree species growing within 40 km distance of the fly ash dumpsite (n = 11; mean ± standard deviation).
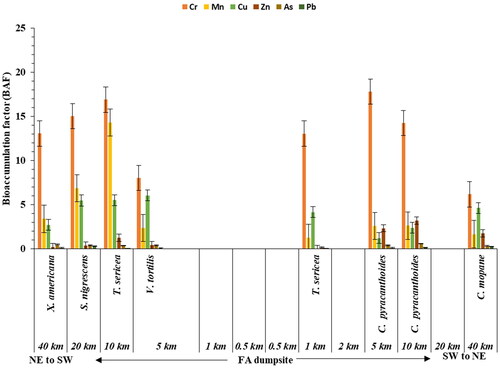
Table 5. Estimated daily intake of Cu of cattle, goat, and sheep grazing in the vicinity of Morupule power station.
Figure 10. Heavy metal concentration found in dominant grass species growing within 40 km distance of the fly ash dumpsite. (n = 11; mean ± standard deviation). Critical concentration are Cr =75-100a, Mn = 400a, Cu = 100b, Zn = 200b, as = 10-20a, Pb = 20b mg kg-1; aHajar et al. (Citation2014) b Manyiwa et al. (Citation2021).