Figures & data
Figure 1. Experimental task design. During the first MEG session, at the beginning of each trial, subjects rated the sociableness of faces on an 8-point scale. Then, subjects were presented with a cue image representing either a peer or expert group followed by the presented group rating. Group rating could be the same as the subject (no conflict with group ratings with percent symbol), and different from the subject (conflict with group ratings with upward arrows for positive conflict and downward arrows for negative conflict). Thirty minutes after the first MEG session, subjects rated the same items again without group cues and feedback to identify conformity effects.
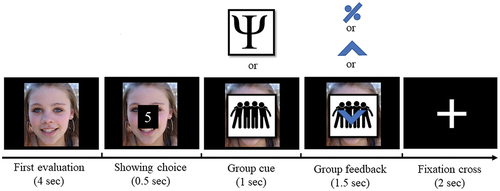
Figure 2. Behavioral results. (a) Mean rating change (second rating minus first rating) for peer and expert groups with all trials across all 23 subjects (total number of trials: 5492). (b) Mean rating change when the effect of the regression to mean (RtM) is removed by using only initial ratings 4 and 5 (2277 trials). Bars indicate the standard error of the mean across subjects. (c) The diagram for statistical analysis shows the behavioral effects of positive and negative conflict and the initial rating. The values indicate mean differences between negative conflict with no-conflict (d1), positive conflict with no-conflict (d2), and the effect of initial rating on change. The value on the right indicates the residual variance of change, and pvalues are shown inside brackets.
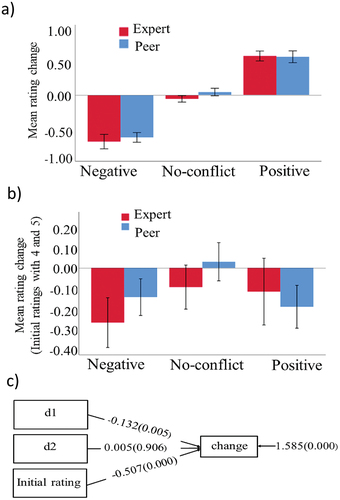
Figure 3. Evoked response analysis. Upper panel. Butterfly plot of magnetometer channels for evoked responses time-locked to the presentation of group feedback for the grand average (peer conflict plus expert conflict). The colored head in the top-left corner shows the individual waveform’s position in the sensor array and the color scales in the top right indicate magnetic field strength. The time points for topographies are selected at activation peaks. Lower panel. Cluster-based permutation test results. Time courses were obtained by averaging over magnetometers comprising the cluster identified by the permutation test. The orange box indicates the time window in which a statistically significant difference was observed.
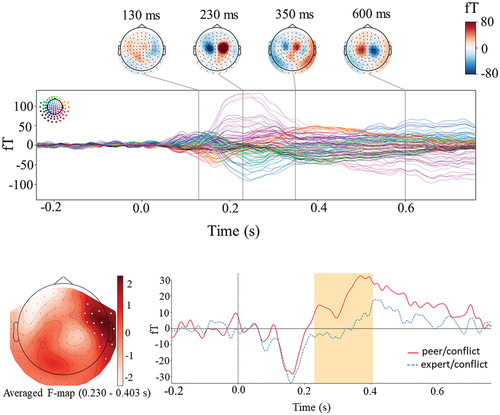
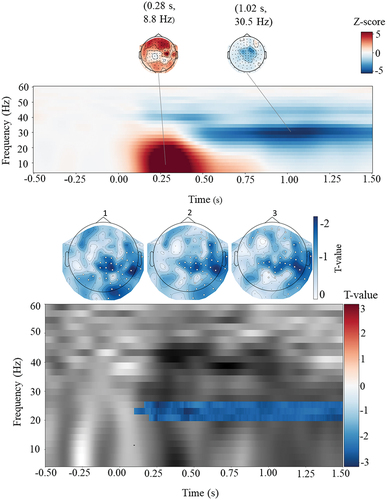
Figure 4. Analysis of induced oscillatory activity. Upper panel. Time-frequency map for the frequency range 4–60 hz and time interval − 500–1500 ms for the grand average of z-scores over gradiometer channels (conflict plus no-conflict) with spatial topographies at the peaks. Lower panel. Time-frequency map and corresponding topographies for the three significant clusters resulting from the cluster-based permutation test. Time-frequency plot is averaged over channels for each time-frequency point. The topography plots are the significant frequency-specific clusters averaged over the time points; cluster 1 (167–1500 ms, 24–26 hz), cluster 2 (100–1500 ms, 22–24 hz), and cluster 3 (200–1500 ms, 20–22 Hz).