Figures & data
Figure 1. The principal scheme of the apparatus for measuring absolute PL QY using an IS and LEDs as excitation sources. The second power supply for LED is applied in order to enable emission stabilization of an LED before its application in experiments.
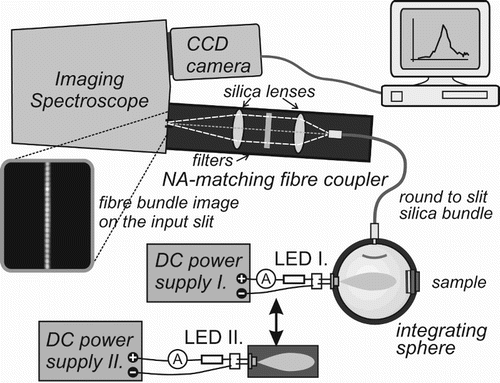
Figure 2. (a) Diffuse reflectance of the Spectraflect coating. (b) Absorbance of the Si/SiO2 nanocrystalline multilayer sample (solid line) and the hypothetical sample with flat absorbance of 0.2 (dashed line). (c) IS multipliers calculated using Equation (3) or (6) for the IS with 10-cm diameter covered by the Spectraflect coating and having: no ports (uppermost solid line), two ports (a LED input and a fibre output) but no sample (dotted-dashed black line), two ports with a sample (12×12 mm) of Si/SiO2 nanocrystalline multilayers (thin line) or a sample of the same size but A=0.2 (lower dashed line) and the calibration configuration (an open input port, a fibre output).
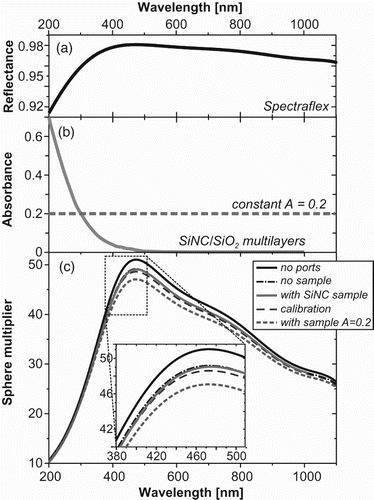
Figure 3. The basic parameters of the integrated sphere experiment with output signal coupled into a fibre bundle (for meaning of symbols, see Section 2.2).
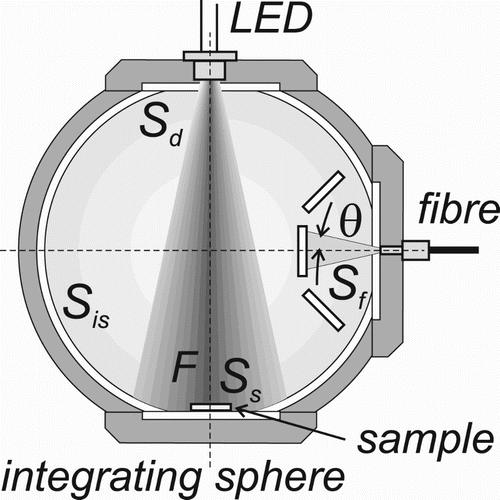
Figure 4. (a) Schematic representation of the PL QY measurement as a sort of “black-box” experiment, where part of the input signal (photon flux) is transformed to the longer-wavelength signal (PL) and then converted to detected signal counts. The lower panel illustrates the three experimental configurations to be used for the PL QY determination: (b) sensitivity calibration, (c) excitation/absorption and (d) emission (PL) signal acquisition. Note that only one (or none) sample is present inside IS during one experimental step – multiple samples in (c) and (d) just illustrate possible positions of a sample in or outside the direct excitation spot (P1 and P2, respectively).
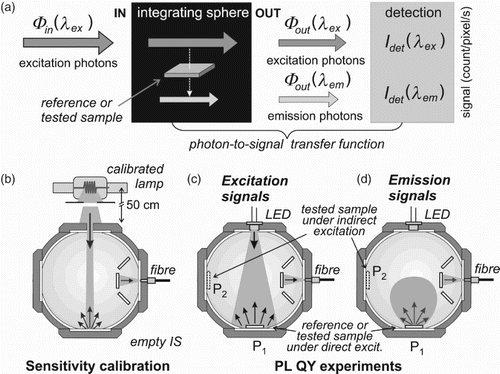
Figure 5. Relation (Equation (13)) between the direct (short-dashed line), indirect (dashed line) and total (solid line) absorbance as function of the direct flux fill factor F for the case of (a) highly absorbing (A=0.8) and (b) weakly absorbing (A=0.02) sample. The sample area fill factor fTS and the sphere multiplier MTS are 0.0046 and 40, respectively.
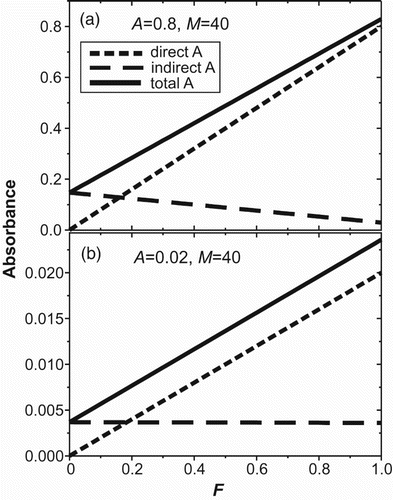
Figure 6. PL QY experiments on the sample of SiNC/SiO2 multilayers on a quartz substrate (its absorbance is given in (b)). The upper panels show experimental data for (a) the excitation region (using LED 505 with actual peak around 513 nm) and (b) the emission region. The black solid and grey dashed lines represent the signal from reference and TS, respectively. The inset in the panel (a) gives expanded view on the excitation peak area. The lower panels (c) and (d) show the corrected differences of spectra from panels (a) and (b), respectively. The ratio of integrated emission and excitation signals gives QY of about 7%.
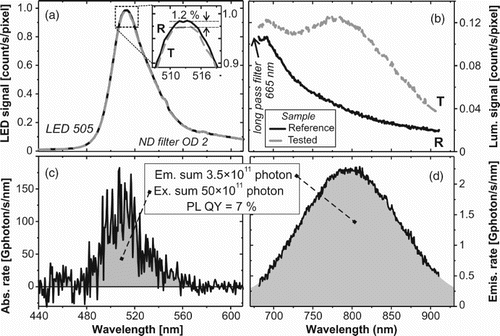
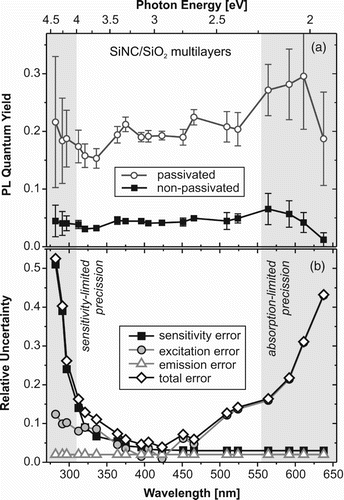
Figure 7. (a) PL QY excitation spectra for a pair of SiNC/SiO2 multilayer samples: the non-passivated sample (black rectangles) and the sample passivated by annealing in hydrogen (open circles). (b) Error analysis of the above PL QY experiments: the total uncertainty (open diamonds) is combined (Equations (20) and (21)) from the excitation (grey circles), emission (open triangles) and sensitivity (black squares) errors. The sensitivity error is dominant at the short-wavelength (UV) side, while the absorption error dominates the long-wavelength side (due to very low absorption of these wavelengths by the sample).