Figures & data
Table 2. Fundamental IR spectral data of calix[Citation4]pyrrole compounds (1, 2, 3 and 4).
Figure 1. TGA-DSC of meso-tetramethyltetrakis-[4-hydroxyphenyl]calix[Citation4]-pyrrole (1).
![Figure 1. TGA-DSC of meso-tetramethyltetrakis-[4-hydroxyphenyl]calix[Citation4]-pyrrole (1).](/cms/asset/94474d46-3fde-4383-b7c0-cfc0c56ac572/tcme_a_884940_f0001_c.jpg)
Figure 2. TGA/differential thermogravimetry-DTA of meso-tetramenthyltetrakis-[4-(2-ethoxy)ethoxyphenyl] calix[Citation4]pyrrole polymer (4).
![Figure 2. TGA/differential thermogravimetry-DTA of meso-tetramenthyltetrakis-[4-(2-ethoxy)ethoxyphenyl] calix[Citation4]pyrrole polymer (4).](/cms/asset/8125044d-54d0-460a-ac66-b81bf2215aa8/tcme_a_884940_f0002_c.jpg)
Table 3. Thermal analysis data, TG, DSC/DTA for the compounds (1, 3 and 4).
Figure 3. Absorbance data (at 240 nm) versus mole ratio (Pb(II)/(2)) in acetonitrile at 298 K.
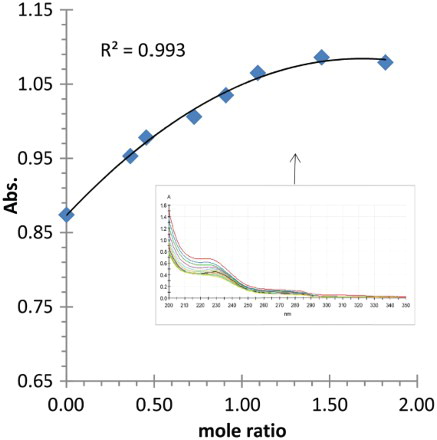
Figure 4. Absorbance data (at 240 nm) versus mole ratio (Cd(II)/(2)) in acetonitrile at 298 K.
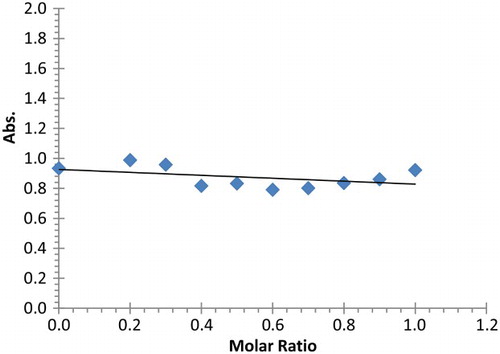
Figure 5. Absorbance data (at 240 nm) versus mole ratio (Hg(II)/(2)) in acetonitrile at 298 K.
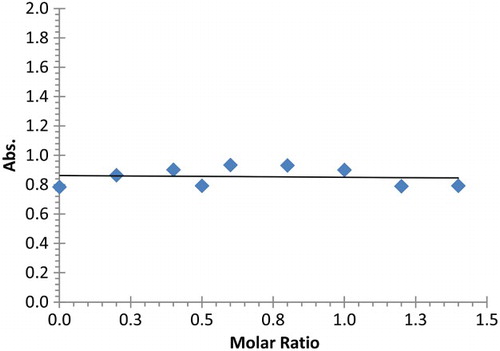
Table 4. Values of Kf for complexation of Pb2+ with (2) obtained at different temperatures in acetonitrile.
Table 5. Thermodynamic parameters for complexation of Pb2+ with (2) in acetonitrile.
Figure 6. Plot of the variation in Kf for complexation of Pb2+ with (2) as a function of (1/T) in acetonitrile.
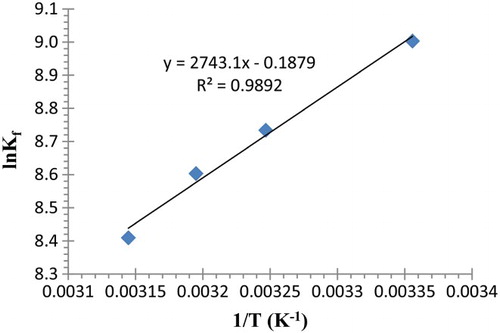
Figure 7. Optimum time for the uptake of lead (II) (200 ppm) by 4 from water.
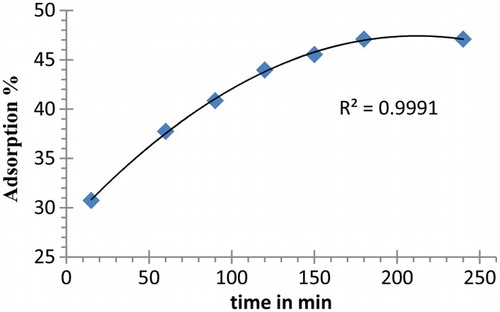
Figure 8. Pseudo-first-order kinetics for lead (II) (200 ppm) uptake by 4 from water.
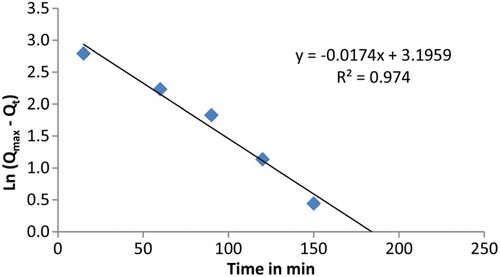
Figure 9. Pseudo-second-order kinetics for lead (II) (200 ppm) uptake by 4 from water.
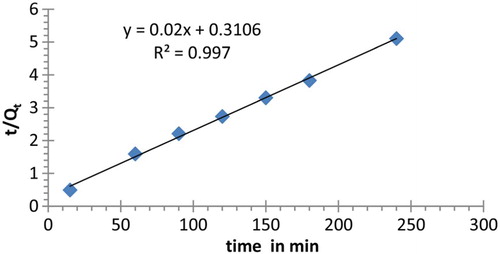
Table 6. Pseudo-first-order and second-order constants for lead (II) cation uptake at 298.15 K (cal.=calculated; exp.=experimental).
Figure 10. Optimum temperature for the uptake of lead (II) (200 ppm) uptake by 4 from water.
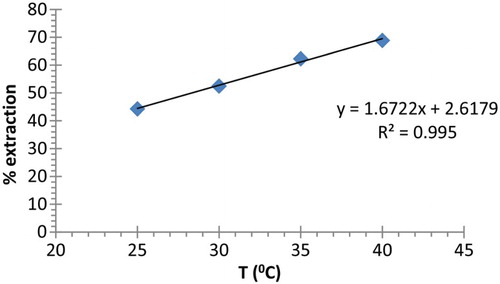
Figure 11. Plot of ln K. vs. 1/T for the uptake of lead ion by 4.
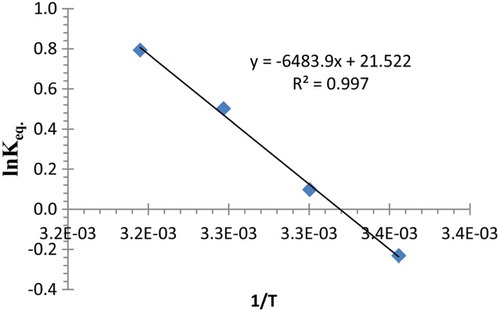
Table 7. Thermodynamic parameters for lead (II) cation uptake using 4 at different temperatures.
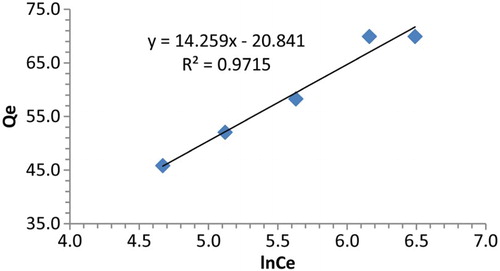
Figure 12. Freundlich isotherm plot for the uptake of lead (II) by 4 at 298.15 K.
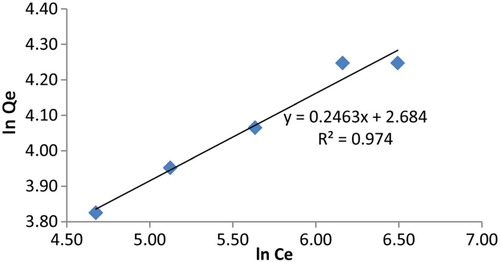
Table 8. Langmuir, Freundlich and Temkin isotherm constants for the uptake of lead (II) cation at 298.15 K.
Figure 13. Langmuir isotherm plot for the uptake of lead (II) by 4 at 298.15 K.
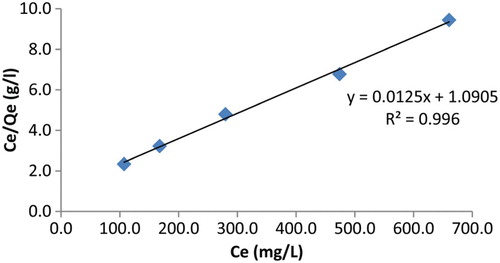
Table 9. RL Langmuir values for the uptake of lead (II) cation at 298.15 K.
Figure 14. Temkin isotherm plot for uptake of lead (II) by 4 at 298.15 K.