Figures & data
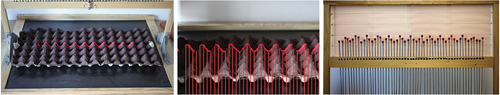
Figure 1. Diagram of pinboard setup (top left), the pinboard calibration on a flat artificial surface (top right), in situ usage (bottom left) and red laser projection for soil profile emphasis on a synthetic surface (bottom right).
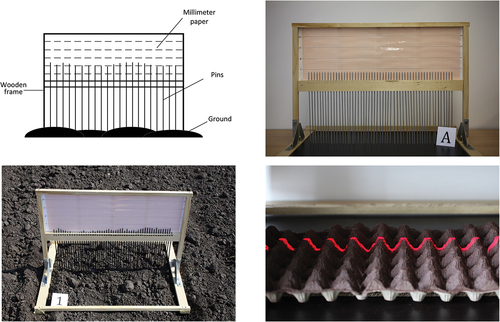
Figure 2. The four types of artificial and real soil surfaces used for in-lab measurements.
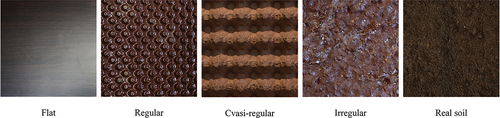
Table 1. The SR values for the synthetic and real soil samples, as measured using the pinboard.
Figure 3. Sample 100 × 200 pixels areas of interest cropped and scaled from RGB images of the projections of a red laser line beam on the surface samples from (top row), binarized (black and white) images (middle row) and grayscale images derived from the binarized ones by adding Gaussian noise of 0 mean and 1% variance (bottom row).
Figure 4. Sample 256 × 256 pixels areas of interest cropped and scaled from RGB images of the projections of a red laser line beam on the surface samples from (top row), random 224 × 224 pixels crops (bottom row) with the following random transformations (from left to right): random brightness scaling, vertical flip, horizontal flip plus random clockwise rotation and random brightness scaling, random clockwise rotation and horizontal flip.
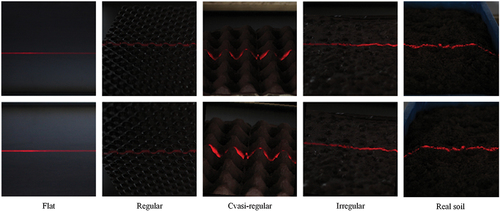
Figure 5. The architecture of our VGG-11 model.
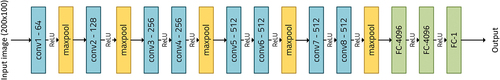
Figure 6. The architecture of our ResNet-18 model.
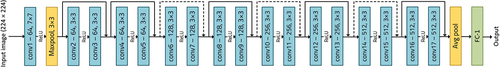
Figure 7. VGG-11 training and validation loss per epoch (logarithmic vertical scale). The green line represents the moving average computed on an arbitrarily-chosen window size, in order to emphasize the decreasing tendency of the validation loss despite its large variations.
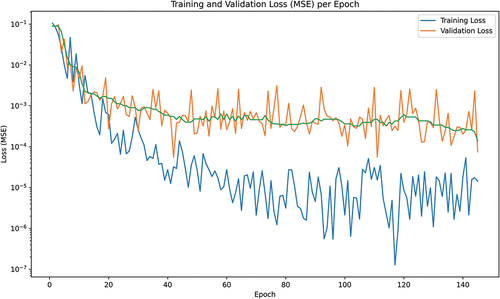
Figure 8. ResNet-18 training and validation loss per epoch (logarithmic vertical scale) for an initial learning rate of 0.0005.
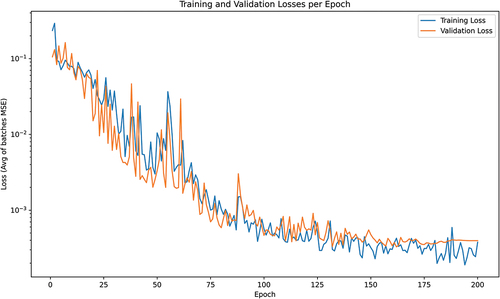
Table 2. The MAPE of pinboard SR prediction and overall accuracy for our experiments with the VGG-11 and ResNet-18 models.
Figure 9. Testing the equivalence between SR estimation using pinboard measurements and laser-based measurements in the digital image: set-up with pinboard and laser line (left), laser line-based SR estimation (middle) and pinboard SR measurement (right).