Figures & data
Figure 1. The influence of different job roles on OFR. Horizontal coloured bars represent %, numbers within bars represent count frequency.
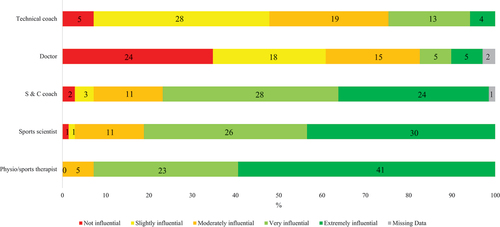
Table 1. Rank order (%) of activities (used earlier [1] to later [7]) with regard to typical field-based movements (A), physical conditioning (B) and sport-specific skill progressions (C).
Figure 2. Tools used to monitor training load, and frequency of use. Horizontal coloured bars represent %, numbers within bars represent count frequency.
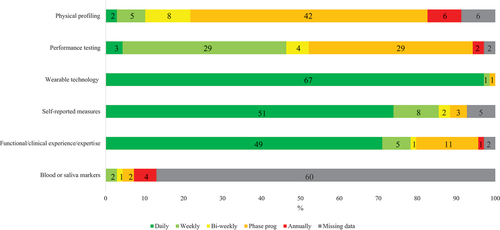
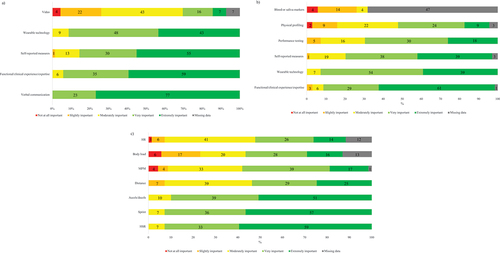
Figure 3. The importance of different monitoring tools to inform decision-making within sessions (A), and between sessions (B), with the importance of selected GPS metrics during OFR (C). Horizontal coloured bars represent %, numbers within bars represent count frequency. Accels = accelerations, decels = decelerations, HR = heart rate, HSR = high speed running, MPM = meters per minute, sprint = sprint distance.