
Figures & data
Figure 1. Polycondensation reaction of guaiacyl units from lignin with formaldehyde
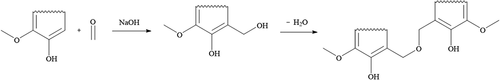
Figure 2. From left to right: hydrogel, aerogel and carbon aerogel for a formaldehyde–lignin ratio of 1 (F/L 1)
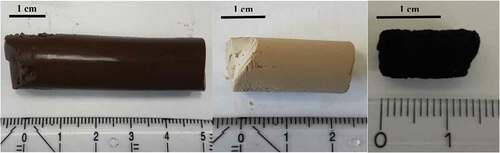
Figure 3. Correlation of initial formaldehyde–lignin mass ratio (F/L) and the specific BET surface area (SBET) for the resulting aerogels
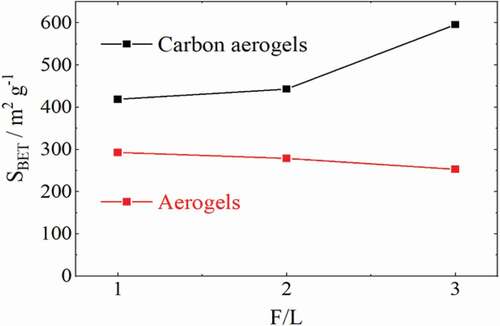
Table 1. Formaldehyde-lignin mass ratio (F/L) of each reaction mixture and specific BET surface area (SBET) of the respective aerogel and carbon aerogel
Figure 4. Pore size distributions of the aerogels (red) and carbon aerogels (black) made from solutions of varying formaldehyde–lignin mass ratios (F/L), where dP is the pore diameter and V the relative pore volume
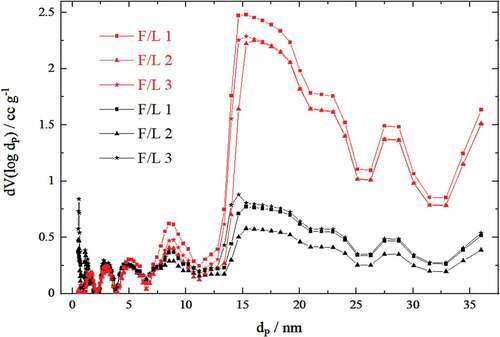
Figure 5. Pore size distributions of the aerogels (red) and carbon aerogels (black) made from solutions of varying formaldehyde–lignin mass ratios (F/L), where dP is the pore diameter and V the relative pore volume
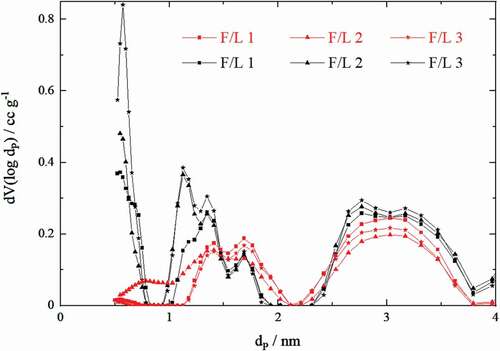
Figure 6. SEM image of the lignin–formaldehyde aerogel (F/L 2) before (left) and after (right) carbonization
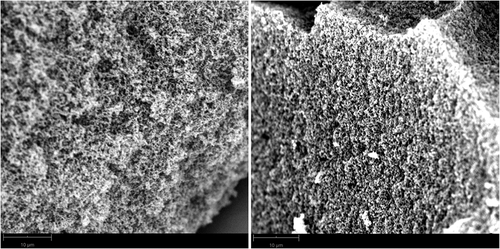
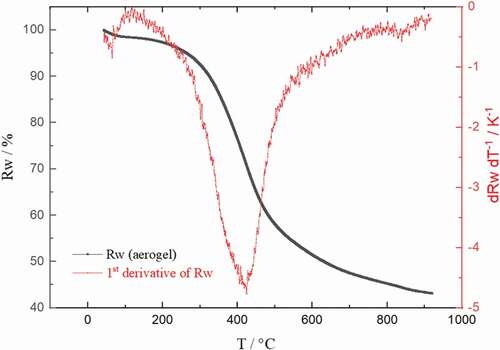
Figure 7. TGA curve (relative weight Rw plotted against temperature T) and the first derivative of the lignin–formaldehyde aerogel (F/L 1) after drying with supercritical CO2.

Data availability statement
Data availability statement Data will be made available upon request to the corresponding author at [email protected]. https://www.wood-kplus.at/en.