Figures & data
Table 1. Detailed description of all collected parameters.
Figure 1. Schematic illustration of bibliometric research design.
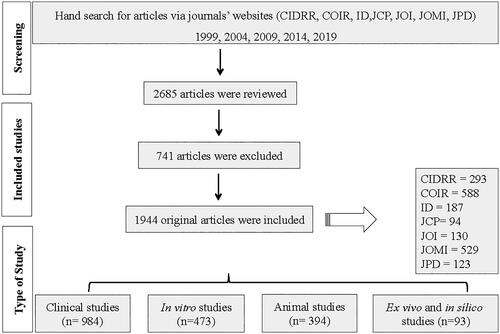
Figure 2. Distribution of total number of published articles in seven dental implant journals according to the type of study over the years; “n” refers to total number of published articles according to the type of study.
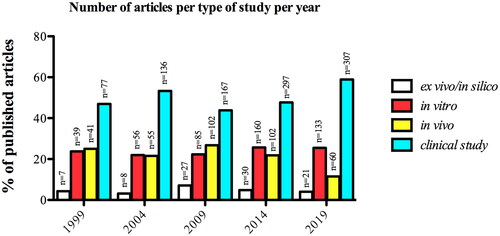
Figure 3. Distribution of total number of published articles according to the type of study per continent; “n” refers to total number of published articles according to the type of study.
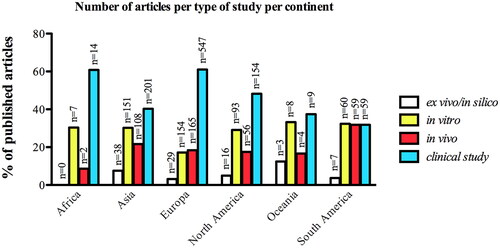
Figure 4. Total number of published articles according to the income country per type of study.
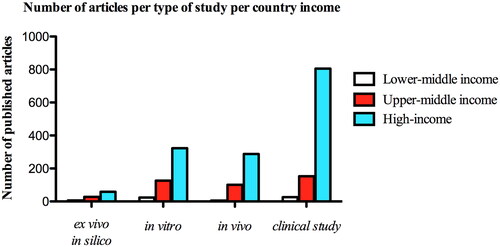
Figure 5. Distribution of total number of published articles according to the income country and type of study over the years. (A) Lower-middle income countries, (B) Upper-middle income countries and (C) High income countries, according to the World Bank country and lending groups (september 2021).
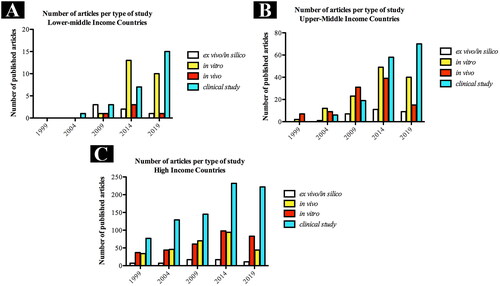
Table 2. Multiple regression model for indicators of type of study by number of authors, country income, number of institution (interinstitutional collaboration), topic of research, and funding factors.
Figure 6. Distribution of total number of published articles according to the number of disciplines from each author’s affiliation per type of study (A) and number of institutions involved from each author’s affiliation per type of study.
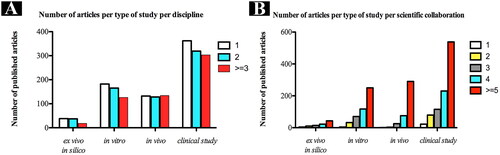
Figure 7. Distribution of total number of articles according to type of funding per type of study.
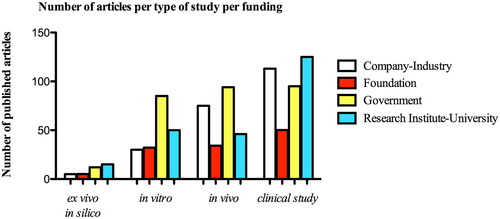
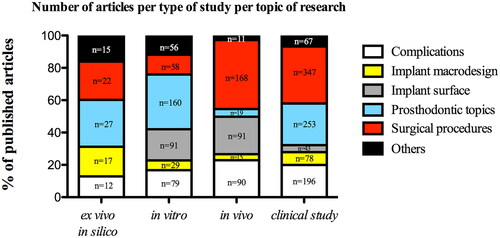
Figure 8. Distribution of 5 main research topics in dental implant research field according to the type of study; “n” refers to total number of published articles according to the type of study.