Figures & data
Figure 1. Conceptual model.
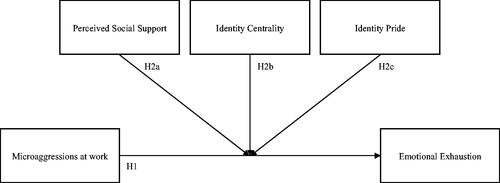
Table 1. Measures of focal variables.
Table 2. Sociodemographic characteristics of the sample (N = 366).
Table 3. Means, Standard deviations, and correlations of main variables.
Table 4. Multiple regression analyses for moderators and microaggressions on emotional exhaustion.
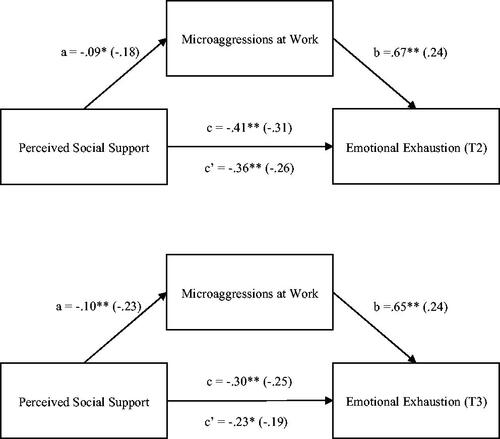
Figure 2. Mediation diagrams. Note: a, b, c, and c’ are path coefficients representing unstandardized regression weights for the relationships between perceived social support and emotional exhaustion as mediated through microaggressions. The standardized coefficients are in parentheses. The c path coefficient represents the total effect, and the c-prime path coefficient refers to the direct effect. *p < .05, **p < .01.