Figures & data
Figure 1 Male Balb/C mice were exposed to diethylnitrosamine and phenobarbital (D+P), or additionally exposed to hypoxia (D+P+Hx), given a high-fat diet (D+P+HF), or both hypoxia and a high-fat diet (D+P+Hx+HF) for 48 weeks. Control animals were left untreated. Weights of the animals were determined twice weekly. (A) Liver sections from control and treatment mice were immunostained with an anti-carbonic anhydrase antibody (CA9). (B) The extent of the staining in panel A was determined by the average immunoreactivity scoring (IRS) score for each of the groups. Each bar represents the mean ± s.e. Scale bar; 100 µm. (C) The average weight of the animals for control and each of the treatment groups over 48 weeks is shown. (D) Average weight gained at 48 weeks. Asterisks indicate a significant difference between the indicated group and D+P (*p ≤ 0.05, **p ≤ 0.01). N ≥ 4 mice per group.
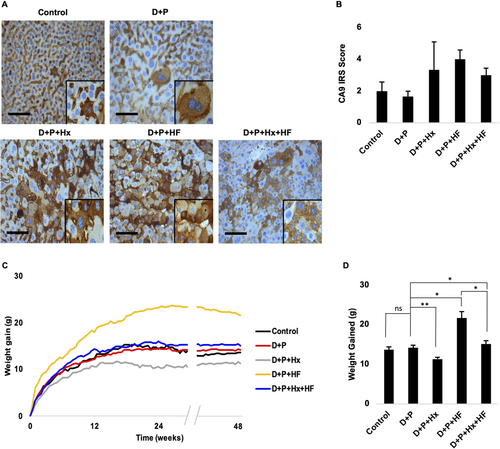
Figure 2 Liver tumor development was monitored using several methods. (A) Representative micro-CT images of mouse livers at 48 weeks on control, D+P, D+P+Hx, D+P+HF, and D+P+Hx+HF mice are shown. (B) The mice were euthanized at 48 weeks and the livers harvested. Pictures of gross morphology of the livers, front and back are shown for representative mice from each group. Dashed circles indicate grossly observed liver abnormalities >3mm. White arrows point to abnormalities <3mm in size. (C) A portion of the liver shown in panel B was fixed, embedded, and stained with hematoxylin and eosin (H&E). Images of stained sections from the liver of representative mice from each of the groups are shown. Magnification is 10x, and the scale bar represents 300 µm. Black arrowheads show macro- and microvesicular fatty change. Black arrows show diffused hyperplasia lipofuscin-laden kupffer cells.
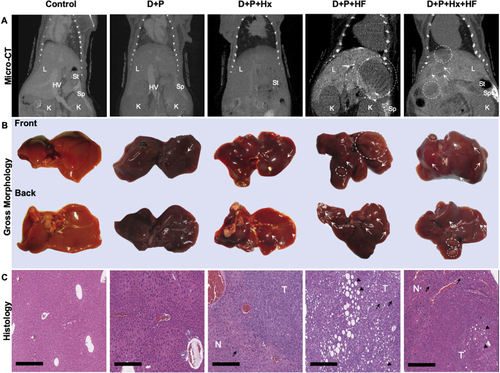
Figure 3 The average number of lesions per mouse was determined by histology. The bars depict the average number of foci of altered hepatocytes (foci, black bars), hepatocellular adenoma (adenoma, dark gray bars) and hepatocellular carcinoma (carcinoma, light gray bars) per mouse for control and each treatment group. Asterisks indicate a significant difference in the average number of adenomas between D+P and D+P+HF (**p <0.01) and D+P and D+P+Hx+HF (*p <0.05). N ≥ 3 mice per group.
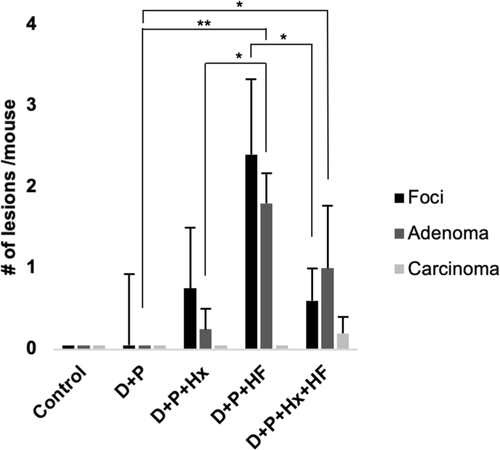
Figure 4 The percent of fat in the liver was determined from H&E stained liver sections for each of the groups as described in the materials and methods. (A) The bars depict the average percent liver fat accumulation for each of the groups. The asterisk indicates a statistical difference between D+P and D+P+HF (p <0.05). Error bars show standard error. (B) The percent liver fat was compared with the number of adenomas for all of the animal groups combined, and a Spearman’s rank correlation coefficient test was performed. The line depicts the correlation between the percent liver fat and the number of liver adenomas per animal (r=75, p=<0.001, n=17). *p<0.05.
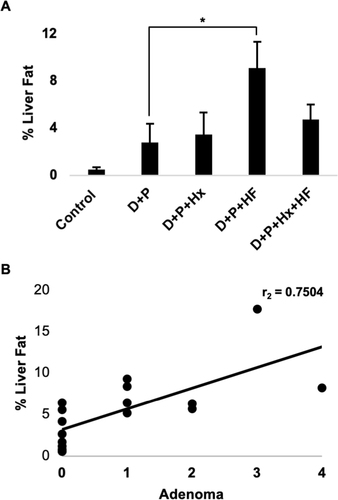
Figure 5 At 48 weeks mice were sacrificed. Whole blood was collected from control, D+P, D+P+Hx, D+P+HF, and D+P+Hx+HF mice, via cardiac puncture. Serum was separated from the whole blood and analyzed for the levels of alanine aminotransferase (ALT) and aspartate aminotransferase (AST). (A) Graphs the units per liter of serum. Each bar represents the average AST for all the animals in each of the groups. Error bar represents the standard error. (B) Data for AST levels and percent liver fat were pooled for all of the animals, and the levels of AST were compared with the percent liver fat using Spearman’s rank correlation coefficient test (r=0.63, p=<0.01, n=17). (C) A similar test for the correlation between serum AST levels and the number of adenomas per mouse was conducted also using the Spearman’s rank correlation coefficient test (r=0.52, p=<0.05, n=18). (D) The average serum levels of ALT in units per liter serum for each of the animal groups is depicted. Error bars represent the standard error. An asterisk indicates a statistically significant difference between groups (p <0.05). (E) Data for ALT serum levels and percent liver fat were pooled for all of the animals and the levels of ALT compared with the percent liver fat using Spearman’s rank correlation coefficient test (r=0.6, p=<0.02, n=17). (F) The graph shows a Spearman’s rank correlation coefficient test of ALT serum levels and the number of adenomas per animal (r=0.46, p=not significant, n=18). *p<0.05.
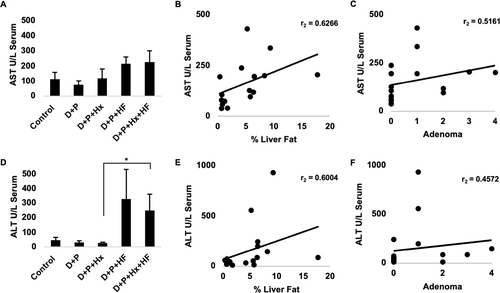
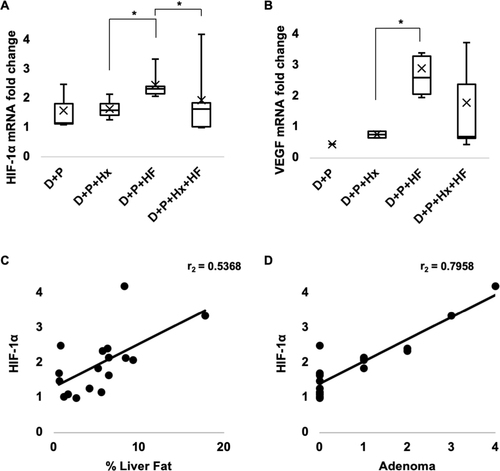
Figure 6 HIF-1α mRNA expression was analyzed for control, D+P, D+P+Hx, D+P+HF, and D+P+Hx+HF mice using qRT-PCR. (A) Box plots depict the fold change calculated using the 2−(ΔΔCt) method and normalized to GAPDH for each of the groups (n ≥3 mice per group). (B) Downstream target, VEGF (n ≥1 mouse per group). Asterisks indicate a significant difference between compared groups (*p ≤ 0.05). (C) HIF-1α expression levels were compared with the percentage of liver fat using Spearman’s rank correlation coefficient test (r=0.54, p=<0.05, n=17). (D) Similarly, HIF-1α expression levels compared with the average number of adenomas developed per mouse using Spearman’s rank correlation coefficient test (r=0.80, p=<0.001, n=17).