Figures & data
Table 1 Primer Sequences
Figure 1 Intersection of liquid-liquid phase separation (LLPS)-related genes with glioma-related differentially expressed genes (DEGs), identifying a common set of 673 genes.
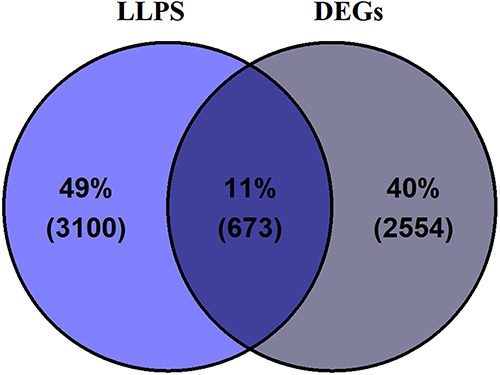
Figure 2 Molecular subtyping and analysis of glioma samples. (A) Three distinct molecular subtypes (C1, C2, and C3) derived from the TCGA-glioma dataset. (B) Cumulative distribution function (CDF) displaying the optimal clustering stability at k = 3. (C) Principal component analysis (PCA) demonstrating significant differentiation among the C1, C2, and C3 glioma molecular subtypes. (D) Prognostic characteristics of C1, C2, and C3 molecular subtypes. (E-F) Expression levels of immune checkpoint genes PD1 and PDL1 across the three molecular subtypes. ***p < 0.001, ****p < 0.0001.
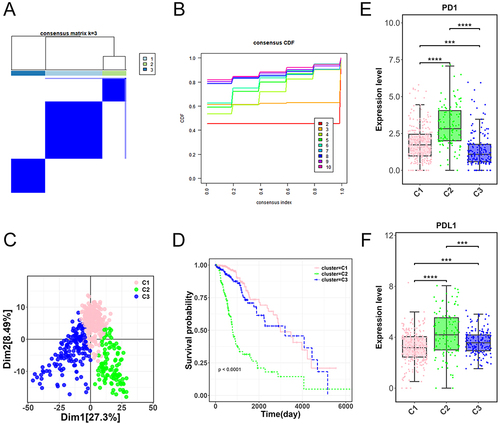
Figure 3 Immune cell infiltration and immune response levels among the three glioma molecular subtypes.
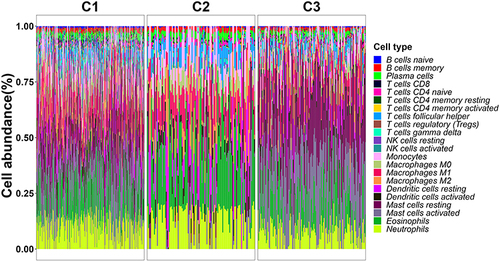
Figure 4 Prognostic evaluation based on selected genes and risk assessment. (A) Prognostic signature derived from three genes (TAGLN2, NTNG2, and IGF2BP2) identified from the intersecting gene set. (B-C) Kaplan-Meier survival curves representing high and low-risk groups from both training and validation sets. The accompanying Receiver Operating Characteristic (ROC) analysis highlights the prognostic accuracy of the model.
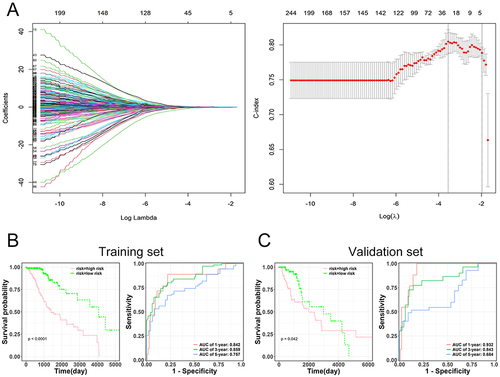
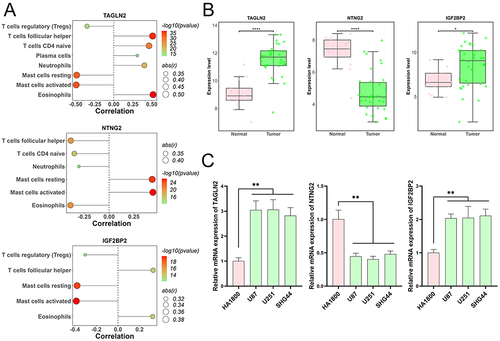
Figure 5 Correlation and expression analysis of prognostic genes in glioma. (A) Analysis illustrating the correlation between the three prognostic genes (TAGLN2, NTNG2, and IGF2BP2) and immune cells in glioma samples. (B) Differential expression levels of TAGLN2, NTNG2, and IGF2BP2 in glioma tumor samples in comparison to normal samples using the GSE50161 dataset. *p < 0.05, ****p < 0.0001. (C) RT-qPCR results confirming the altered expression patterns of TAGLN2, NTNG2, and IGF2BP2 in glioma cells. **p < 0.01 vs HA1800.