
 ?Mathematical formulae have been encoded as MathML and are displayed in this HTML version using MathJax in order to improve their display. Uncheck the box to turn MathJax off. This feature requires Javascript. Click on a formula to zoom.
ABSTRACT
In this study, we provide the first field-based assessment of the seismic potential of the Te Puninga Fault, Hauraki Plains, Waikato region. Initially considered to be part of the nearby Kerepehi Fault, our new mapping and field data suggest the Te Puninga Fault is independent. A new net slip rate value of 0.25 mm/yr, based on geomorphic data and evaluations from two paleoseismic trenches, is slightly higher than previously considered. Comparisons of geomorphic expression between the two faults suggest that the slip rate currently assigned to the Kerepehi Fault could be underestimated. The earthquake magnitude estimated here for the Te Puninga Fault (Mw 6.9 ± 0.35) is based on a characteristic earthquake model. New PGA and MMI estimates here are only slightly larger than those published prior to this study. Although ruptures of the Te Puninga Fault are infrequent (derived recurrence range of 3000–11,500 years), and thus its hazard is low, with this paper we wish to enhance the community awareness to prepare for the rare large earthquake in the region. We also recommend that this new information is added to fault databases used for seismic assessment.
Introduction
New Zealand has several regions of low historical seismicity where the hazard of moderate to large (moment magnitude, Mw > 5.0) earthquakes is thought to be low (Stirling et al. Citation2012). However, events such as the MW7.2 Darfield earthquake (Quigley et al. Citation2012) demonstrate that low historic seismicity does not necessarily equate to an absence of ground-surface rupturing earthquakes that can significantly impact surrounding communities. A particular challenge with low seismicity areas is that the recurrence of large earthquakes is infrequent, and therefore the surface expression of faults can be obscured by other processes such as sedimentation (where the fault scarp is buried: e.g. Canterbury Plains, Christchurch, and Tagus Basin, Portugal; Villamor et al. Citation2012; Cabral et al. Citation2013) or erosion (removal of the scarp from the landscape; e.g. central Southern Alps; Cox et al. Citation2012). These potential impacts can lead to the underestimation of the long-term deformation rates from active faults in low seismicity areas. Geodetic techniques are used worldwide to calculate short-term strain rates that could sometimes be used instead of, or in combination with, long-term rates from fault slip data to inform the potential seismicity of an area (e.g. Petersen et al. Citation2014; Van Dissen et al. Citation2023, accepted). However, low seismicity regions often need geodetic acquisition for a long time frame (decades) for the signal to be larger than the noise (Niemi et al. Citation2004; Broermann et al. Citation2021).
The Hauraki Rift, a c. 250-km-long half graben extending west of the Taupō Rift northward to the Hauraki Gulf (A), is an optimal low seismicity region in which to study both long-term and short-term deformation rates. With the recent widespread acquisition and availability of high-resolution digital topography from airborne light detection and ranging (LiDAR), the ability to detect subtle landscape signatures of active faults has significantly increased (Meigs Citation2013). Therefore, we have new opportunities to improve our understanding of long-term deformation rates. In the present study, we use the Te Puninga Fault, located on the western margin of the Hauraki Plains within the rift, as an example of a subtle active fault in a low seismicity region that has only been recently discovered due to the availability of LiDAR. The rift is also located far away from fast deforming regions of the New Zealand plate boundary, which is an advantage to properly interpret the geodetic data models, given that residual unmodelled geodetic deformation from fast deformation adjacent areas is commonly assigned to the low seismicity zone (e.g. Southern Basin and Range US; Broermann et al. Citation2021).
Figure 1. Tectonic setting of the Te Puninga Fault. A, The Hauraki Rift (dashed rectangular zone), regional active faults (red lines, from the New Zealand Active Faults Database; KF, Kerepehi Fault; TPF, Te Puninga Fault), and recent seismicity (MW >4 earthquakes from 1952 to 2022, from Geonet, https://quakesearch.geonet.org.nz/). B, Detailed map of the Te Puninga Fault (blue, orange and black lines), showing the locations of the two trenches investigated in this project, Ryland and Arnold, and the two swathes where slip rate was calculated (yellow bands).
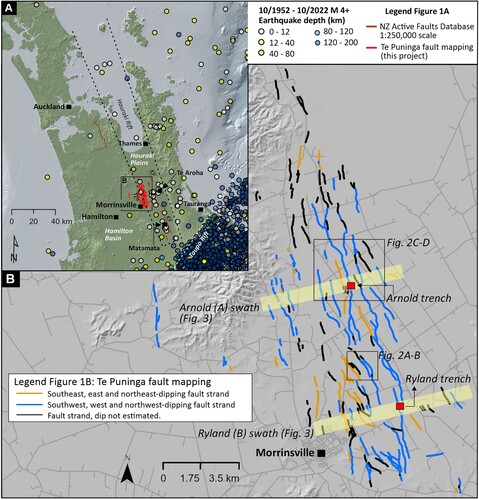
The extension rate of the Hauraki Rift is low at 1.15 ± 0.30 mm/yr (Pickle Citation2019), but it has significant importance to national seismic hazard because of its proximity to the major population centres of Hamilton, Auckland, and Tauranga. Although the faults bounding the rift are not currently active, a prominent active fault, the Kerepehi Fault, is located within the eastern half of the graben (Edbrooke Citation2001, Citation2005). The Kerepehi Fault is an 80 km-long segmented normal fault with a slip rate of 0.008–0.4 mm/yr (Persaud et al. Citation2016). The Te Puninga Fault is located on the western side of the Hauraki Rift () and was originally mapped as one segment of the Kerepehi Fault. However, its distinctive structural character as a zone of distributed faulting shows it should be classified as a separate fault. Modelling of a MW 7.3 earthquake on a possible full rupture along the Kerepehi Fault showed strong to very strong shaking (Modified Mercalli Intensity, MMI 6–7) in Hamilton and Tauranga, along with severe shaking (MMI >8), liquefaction, and likely flood defence damage near source in the Hauraki Plains (Dempsey et al. Citation2021). Also, recent spatial and temporal analysis of soft-sediment deformation structures within tephra layers in extant lakes in the Hamilton Basin provided some evidence that liquefaction of a sequence of tephras deposited between c. 17,500 and c. 14,000 cal yr BP was triggered by a seismic source to the northeast, namely the Te Puninga and/or Kerepehi faults (Kluger et al. Citation2023). In comparison to the Kerepehi Fault, little is known about the likely impacts of a Te Puninga Fault earthquake. Gaining a better understanding of the seismic potential of the Te Puninga Fault is an important step in better constraining seismic hazard for the wider Auckland-Hamilton urban areas, for the local community and rural businesses in nearby Morrinsville, for iwi and hapu with marae nearby, and for local government agencies with roles in land use planning and emergency management. It will also help in understanding long-term extension rates in the context of the tectonic models of the North Island that will ultimately inform broader hazard estimates. In this study, we present the first detailed mapping of the Te Puninga Fault, along with estimates of slip rate and extension rate from landform ages and topographic offsets, estimates of recurrence interval of large earthquakes, and ground shaking modelling from characteristic earthquakes on the fault.
Tectonic setting
The Te Puninga Fault is located on the western margin of the Hauraki Rift, a NNW-SSE-oriented half-graben extending from the Taupō Rift in the south to the Hauraki Gulf in the north (). The Hauraki Rift is located in the back-arc of the Hikurangi subduction zone and it has been active since 7–5 Ma (Hochstein and Ballance Citation1993). As the subduction margin migrated (Seebeck et al. Citation2014a), the focus of back-arc rifting shifted to the Taupō Rift at c. 2 Ma (Seebeck et al. Citation2014b; Villamor et al. Citation2017). Based on early gravity surveys, the basement rock is estimated at up to 3 km depth with the rift infilled by Quaternary and Neogene sediments (Hochstein and Nixon Citation1979). Among the most recent sediments, the Hinuera Formation (broadly post 220 ka; Manville and Wilson Citation2004) is key to assessing the timing of fault activity (see more below). Historical seismicity within and proximal to the rift is sparse and generally <12 km deep (). Notable historical macroseismicity has been summarised by Dempsey et al. (Citation2021) and includes the 1972 MW 5.1 Te Aroha earthquake, a shallow event that caused minor localised damage (Adams et al. Citation1972); a pair of MW 4.6 events in June 2002 at 5 km depth near the town of Matamata; a brief seismic swarm in 2005 west of Te Aroha (largest event MW 3.9); and two moderate events that occurred north of Matamata in November 2014, the largest being MW 3.9. More recently, in January–February 2023, two moderate events with a MW of 5.1 and 4.8 occurred south of Te Aroha (https://www.geonet.org.nz/earthquake).
Active faulting in the Hauraki Plains
Using a LiDAR-derived digital elevation model (DEM), Persaud et al. (Citation2016) mapped numerous fault traces of the Kerepehi Fault across the Hauraki Plains. They also mapped several fault traces on the western side of the Hauraki Rift with the opposing sense of dip (NE dipping) to that of the Kerepehi Fault (predominantly SW dipping). Persaud et al. (Citation2016) mapped six segments of the Kerepehi Fault, with the western, NE-dipping fault traces forming the ‘Te Puninga segment’. However, it was not clear whether the Te Puninga segment is part of the Kerepehi Fault or if it is a separate fault. In this study we redefine the ‘Te Puninga segment’ as a separate fault based upon new mapping and field data (presented here). The Te Puninga and Kerepehi faults collectively form the Kerepehi-Te Puninga fault system. The five segments of the Kerepehi Fault are arranged in a right-stepping geometry with segments of 10–43 km in length, totalling 80 km. Based on the length of the fault segments and using established scaling relations, Persaud et al. (Citation2016) estimated that the characteristic earthquake magnitude for a single-segment rupture on the Kerepehi Fault ranged from Mw 5.5–7.0, and up to Mw 7.2 or 7.4 in the case that all fault segments ruptured together. Four of the five Kerepehi Fault segments displayed evidence of average recurrence intervals of 5000–10,000 calendar (cal) years in paleoseismic trenches excavated by Persaud et al. (Citation2016).
The Te Puninga Fault () was not discovered prior to Persaud et al. (Citation2016) because it consists of many distributed fault strands most of which have only low scarps (<3 m high). The existing aerial photography, originally used to map active faults across the Hauraki Plains, did not have appropriate lighting and contrast to distinguish the subtle scarps of the Te Puninga Fault. Only the relatively high scarps of the Kerepehi Fault had been identified prior to work by Persaud et al. (Citation2016). With the acquisition of LiDAR data in 2007, the low scarps of the Te Puninga Fault were identified, along with additional smaller traces belonging to the Kerepehi Fault, which were mapped by Persaud et al. (Citation2016) at ∼ 1:10,000 scale. Since then, parts of the Te Puninga Fault have been mapped at a regional scale (1:250,000 scale) by Leonard et al. (Citation2024) but high-resolution (1:2000–1:5000) mapping to capture fault complexity and interrogate differences between active fault scarps and fluvial terrace risers (highlighted as an issue in this area by Persaud et al. Citation2016) has not previously been undertaken.
An initial fault assessment by Persaud et al. (Citation2016) suggested the Te Puninga Fault can produce earthquakes of Mw 6.7 or greater with shaking intensities of MMI 9 + in Morrinsville and MMI 8 in Te Aroha. Preliminary characterisation of the Te Puninga Fault in the New Zealand Community Fault Model (NZ CFM; Seebeck et al. Citation2023) represented it as a single fault trace with a length of 29 km and a slip rate of 0.16 mm/yr (range 0.1–0.3 mm/yr; based on comparison with the Kerepehi Fault). Although this initial fault characterisation has been useful for inclusion in the 2022 New Zealand National Seismic Hazard Model (NZ NSHM; Gerstenberger et al. Citation2022), it is limited by large uncertainties as it lacks on-fault derived paleoseismic data on the Te Puninga Fault, such as slip rate, co-seismic ground displacement, recurrence interval, and the time since its last seismic event.
Age of the Hinuera Formation and Hinuera surface in the Hauraki Plains
The Hinuera Formation infills much of the Hauraki Plains and is comprised of up to 90 m of unconsolidated secondary volcaniclastic alluvial sediments that consist of rhyolitic quartzofeldspathic, ignimbritic, and pumiceous gravelly sands, sandy gravels, and sands, characterised by common cross-bedding, as well as mud and occasional lenses of peat (Schofield Citation1965; Hume et al. Citation1975; Kear and Schofield Citation1978). The volcaniclastic sediments, which infill much of Hamilton Basin as well as the Hauraki Plains (Edbrooke Citation2001, Citation2005; Leonard et al. Citation2010), were deposited by the high-energy, sediment-laden ancestral Waikato River as a series of fluvial fans in four main episodes that generated four general units, namely Hinuera A, B, C, and D (Manville and Wilson Citation2004). In the Hauraki Basin, early deposits of Hinuera A and B (pre-25,400 cal yr BP) lie deep within the sequence. Also, present in the Hauraki basin, Hinuera C was deposited more recently, during the extended Last Glacial Maximum (Barrell et al. Citation2013) when sea levels were c. 120 m lower than today, as a low-angle fan. The surface of Hinuera C is referred to as the Hinuera surface (Schofield Citation1965; Hume et al. Citation1975; Edbrooke Citation2001) and has a mean gradient of only 1.8 m/km, effectively forming a wide, low-angle, braided alluvial plain in the southern Hauraki Plains (Houghton and Cuthbertson Citation1989; Manville and Wilson Citation2004). Hinuera D refers to the post-17,600 cal yr BP reworking of earlier Hinuera sediments.
The Hinuera C deposits largely comprise the reworked products of the voluminous break-out flood event from the Taupō volcano (Manville and Wilson Citation2004; Manville et al. Citation2007) that occurred soon after the Oruanui supereruption c. 25,400 cal yr BP (Wilson Citation2001; Vandergoes et al. Citation2013; Barker et al. Citation2021) but before the Waikato River’s avulsion into the Hamilton Basin, which occurred between c. 24,000 cal yr BP (Lowe and Green Citation2024) and c. 23,500 cal yr BP (Peti et al. Citation2021) (see also section on this topic below). The land surface in the southern Hauraki Plains (on the Hinuera C deposits), therefore, has an estimated age of c. 24,000 to c. 23,500 cal yr BP (Lowe and Green Citation2024), consistent with calibrations on several radiocarbon dates obtained by Houghton and Cuthbertson (Citation1989) (). Note that most of the Hinuera C surface is buried by a composite of incrementally accumulated, thin, chiefly rhyolitic, tephra-fall deposits that together are up to about 1 m thick in the southern parts of the plains (Pullar and Birrell Citation1973; Lowe Citation1988; Houghton and Cuthbertson Citation1989; Persaud et al. Citation2016), the basal tephra likely being Okareka tephra (Hughes Citation2023) which has an age of 23,525 ± 300 cal yr BP (95% probability range) (Peti et al. Citation2021).
Table 1. Radiocarbon ages obtained from the Arnold and Ryland paleoseismic trenches on the Te Puninga Fault, and from the Hinuera Formation (Hinuera C) near Matamata.
Methods
Active fault mapping
The active faults in the Hauraki Plains have been mapped in detail at scales between 1:2000 and 1:5000 with a DEM derived from LiDAR data. The LiDAR data were acquired in 2007 by the Waikato Regional Council. The 1 m resolution DEM and hillshade relief models were used to identify fault scarps (). We also reviewed the original mapping by Persaud et al. (Citation2016) and Leonard et al. (Citation2024) as the base for our mapping. Due to the mainly north–south orientation of the alluvial system through the region of the Te Puninga Fault, there are river channels and terrace risers parallel and subparallel to the fault strike. These fluvial features make it difficult to distinguish whether a topographic scarp is tectonic in origin or a terrace riser (). To distinguish between the two, we made topographic profiles across suspected fault scarps to see whether the surfaces either side were tectonically tilted (i.e. sloping), rather than flat-lying as would be expected for fluvial surfaces. The tectonic origin of some small traces is still uncertain, because the amount of tectonic tilting associated with faulting would be too small to be detectable ().
Figure 2. Views of the different geomorphic characteristics of the Te Puninga Fault. A, Area of the Te Puninga Fault around the Waiharakeke West Stream that illustrates the interplay between fault scarps and fluvial terrace risers in locations where the fluvial drainage is parallel with the fault strike. B, Fault mapping interpretation for panel A. C, Area of the Te Puninga Fault in generally very flat topography where the fault scarps are very subtle in the LiDAR hillshade model. D, Fault mapping interpretation of panel C, showing how overlaying a dynamic-range-adjusted digital elevation model over the hillshade model enhances the fault scarps in this area of low topography. The pale-grey lines depict roads.
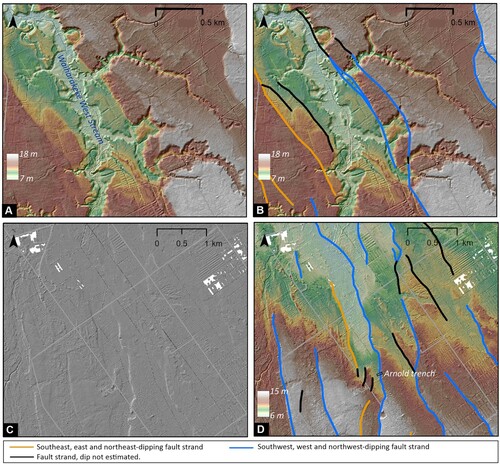
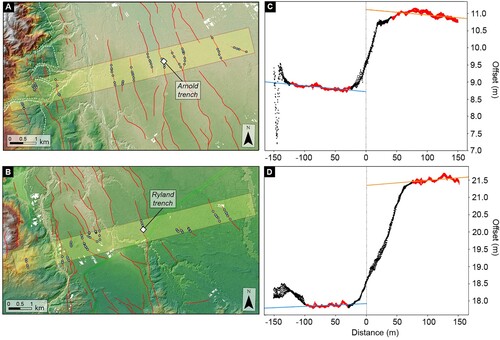
Figure 3. Example of topographic profiling undertaken across the Te Puninga Fault. Arnold (A) and Ryland (B) profiling swaths are indicated by the yellow boxes. White diamonds are location of trenches. Red lines are mapped traces of the Te Puninga Fault and blue dots are topographic profile locations. The white dashed line in (A) delineates the boundary between the two broad groups of surfaces discussed in the text: to the west are older alluvial fan deposits, while to the east, are the low lying surfaces of the Hauraki Plains and the youngest alluvial fan deposit. (C) and (D) are example topographic profiles from the Arnold and Ryland swathes, respectively, where red points are the elevations manually selected to define the slope of the upthrown and downthrown side of the fault resulting in the orange and blue best-fitting lines, respectively.
Paleoseismic trenching and chronology of the Hinuera surface
Paleoseismic trenching was undertaken to date the sediments displaced by the fault and refine the age of the Hinuera surface in the Te Puninga Fault area. Trenching also enabled the offset stratigraphy in the trench to be compared to the offset seen at the surface. This comparison helped evaluate whether the age of the Hinuera surface, along with scarp heights at the ground surface, could be used to calculate slip rate. Observations and data from the trenches will also be used in the future to develop a paleoearthquake record and estimate co-seismic displacements for strands of the Te Puninga Fault. Trenches were excavated at two sites, namely the Arnold and Ryland sites (B), across two different and prominent fault strands.
The Arnold trench was excavated across a prominent, 2–2.5 m-high scarp and was 41 m long and 3 m deep. The Ryland trench was excavated perpendicular to a 3.3 m-high scarp, with a length of 38 m and depth of 2.4 m. Both trench walls were photographed and a structure from motion (SfM) photomosaic was produced with spatial precision tied to real-time kinematic (RTK) global navigation satellite system (GNSS) positions. One key wall log from each trench is displayed in and .
Figure 4. Trench log of the south wall of the Arnold trench. Offset of trench Unit A is indicated by the dashed lines on the left side of the trench log. Units A-C correspond to Hinuera C (Manville and Wilson Citation2004) of Hinuera Formation and unit 1 corresponds to Waitoa Formation (of Houghton and Cuthbertson Citation1989; Brathwaite and Christie Citation1996).
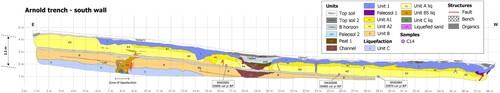
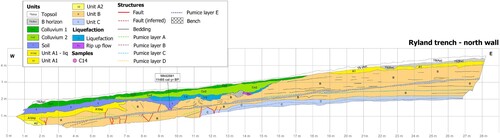
Figure 5. Trench log of the north wall of the Ryland trench. Units A-C correspond to Hinuera C (Manville and Wilson Citation2004) of Hinuera Formation and unit 1 corresponds to Waitoa Formation (of Houghton and Cuthbertson Citation1989; Brathwaite and Christie Citation1996).
The stratigraphic units and tectonic deformation features were digitised directly onto the photo orthomosaics using ArcGIS software. The units identified within these materials were described geologically and pedologically using standard procedures and nomenclature (Clayden and Hewitt Citation1989; Milne et al. Citation1995). Trench unit descriptions are given in the electronic supplement to this article (supplementary material S1). Organic material was collected for radiocarbon dating where possible. The most common organic fractions were large roots and stumps, small pieces of wood, bark, or twigs, and decomposed peat (including preserved but somewhat degraded leaf material in one sample). Four radiocarbon samples were processed at the Waikato Radiocarbon Laboratory and the Rafter Radiocarbon Laboratory and the ages were calibrated using the SHCal20 calibration curve (Hogg et al. Citation2020) and OxCal v.4.4.4 (C. Bronk Ramsey: https://c14.arch.ox.ac.uk/oxcal/OxCal.html).
Topographic profiling
Topographic profiling was undertaken to estimate the total offset of the Hauraki Plains geomorphic surface by Te Puninga Fault. Fault offsets were estimated in two transects perpendicular to the fault that spanned the width of the Te Puninga Fault zone to include all the parallel fault strands. The total offset was estimated by summing all the individual strand offset measurements across the transect. Each transect is represented by a 1 km-wide swath rather than a line. The two swaths (transects) are centred around the Ryland and Arnold trenching sites () to enable information from the trenches (mainly Hinuera surface age) to be used, and hence are referred to as the Ryland and Arnold swaths. These wide swaths were used to facilitate estimates of offset uncertainty through the acquisition of multiple offset values for each individual strand of the Te Puninga Fault zone which we averaged to develop an estimate for that individual strand. Topographic profiles were constructed for offset measurements using a Python tool developed in Howell et al. (Citation2020). After defining the location of multiple profiles for each fault strand, this tool extracts the elevation of the ground surface across a 10m-wide zone along each profile. It them plots this elevation data against distance from the fault, and the user then defines the slopes of the hanging wall and footwall. The gradients of these slopes are then projected to the location of the fault and the resulting vertical offset and associated uncertainty are measured (e.g. ). A quality factor (Q1-3, where Q3 is excellent and Q1 is poorly quality) was assigned to each measurement.
Slip rate
Slip rate across the Te Puninga Fault was calculated in the Arnold and Ryland profile swaths utilising offsets measured from topographic profiling and age bounds on these offsets from radiocarbon dating of deformed stratigraphy in the two paleoseismic trenches. At least three offsets of sufficient quality (Q ≥ 2) for each strand were used to calculate overall slip rate within each profiling swath. Topographic surfaces crossing each profiling swath were mapped out and broadly grouped into surfaces of the same age based upon elevation and geomorphology. This process led to two broad groups of surfaces: (1) surfaces within the low-lying Hauraki Plains along with the youngest alluvial fan deposits towards the higher elevation hills to the west (group A; A); and (2) a set of older alluvial fan deposits present to the west of the younger deposits in the Arnold profiling swath (group B; A). Vertical offset of the surfaces trenched at the Arnold and Ryland sites were compared to the vertical offset of trench Unit A exposed in each paleoseismic trench to assign an age to the vertical offsets.
A Monte Carlo approach was taken to calculate slip rate from age and offset data. We generated 10,000 offset profiles across the Te Puninga Fault zone. This approach is achieved by randomly sampling vertical offset for each strand, as well as fault dip (60 ± 15°; Seebeck et al. Citation2023) to allow calculation of dip-slip offset, assuming Gaussian uncertainties for both. The modelled OxCal age distribution for trench Unit A deposition was also randomly sampled and used to calculate slip rate across the fault traces. Slip rates were then summed across each profiling swath and two total slip rates were calculated. The first is the total slip rate across the fault regardless of down quadrant (i.e. all slip rates are positive) and the second is the total down-to-the-southwest slip rate (down-to-the-northeast slip rates treated as negative). Because the age bounds on offset of three fault traces in the Arnold swath are minimums, slip rate calculated for that swath should be considered a maximum bound on the true slip rate here.
Maximum magnitude and recurrence interval
We have used two approaches to estimate the likely earthquake magnitude that could be generated by rupture of the Te Puninga Fault. Firstly, we estimated the maximum moment magnitude (Mw) using the scaling relation between fault length and magnitude, developed for the Taupō Volcanic Zone (Villamor et al. Citation2001) and used in the 2010 NZ NSHM (Stirling et al. Citation2012), as follows:
where L is the subsurface fault length in km. The subsurface fault length is 1.164 times the mapped fault length at the surface (Villamor et al. Citation2001, Citation2007).
Secondly, we calculated magnitude using the recently proposed scaling relation for normal faults in the 2022 NZ NSHM (Gerstenberger et al. Citation2022), which relate Mw to rupture area, A (in km2), as follows:
where c has a mean of 4.13 and bounds of 3.95–4.3 (Stirling et al. Citation2023 accepted). To apply the 2022 NZ NSHM scaling relation we generated c using a Gaussian distribution with 95% confidence interval limits of 3.95 and 4.3 and calculated area using the subsurface length of the Te Puninga Fault and the seismogenic depth of the Hauraki Plains of 17 ± 1 km (Ellis et al. Citation2021). Both A and c are randomly sampled to calculate the magnitude.
We also utilised scaling relations to place bounds on the recurrence interval of the Te Puninga Fault. The magnitude calculated above is used to calculate displacement (D, in metres) according to Villamor et al. (Citation2001):
The distribution of magnitudes given by the 2022 NZ NSHM scaling relation is used to calculate a distribution of displacements, which then in turn is divided by the slip rate of the Te Puninga Fault to derive a recurrence interval (RI = displacement/slip rate). A Gaussian distribution is fitted to slip rate with the centre of the distribution centred around the mean slip rate and the two-sigma defined the 95% confidence interval.
Expected ground motion calculations
Modified Mercalli Intensity (MMI) and peak ground acceleration (PGA) were modelled using OpenQuake (GEM Citation2019), an open source hazard and risk modelling tool that uses ground motion models (GMMs) to estimate the expected level of ground shaking during an event of a particular size and magnitude.
The calculation mode used in this study is called scenario analysis, where a single seismic event is considered. Uncertainties associated to the GMMs are included by generating a number of simulations that represent its variability.
Intensity prediction equations (IPEs) are GMMs used to estimate MMI whereas ground motion prediction equations (GMPEs) are used to predict PGAs and accelerations at other period levels. Generally, IPEs and GMPEs are dependent on the distance to the earthquake source, the earthquake tectonic region, rupture mechanism and magnitude, and the local site conditions, as follows:
Where IM is the intensity at a site, Rup is the rupture mechanism, Dist is the distance to the earthquake source, Mw is the earthquake magnitude, and S is the local site condition.
In this study we use the GMPE from the 2022 NZ NSHM (Gerstenberger et al. Citation2022), which combines several international GMPEs through a logic tree approach to address uncertainties. The IPE used is from Dowrick and Rhoades (Citation2005) and was developed for New Zealand events.
Detailed fault rupture geometries are normally required by the most recent GMMs to calculate the distance to the fault source. Here we use the geometries from the CFM (Seebeck et al. Citation2023). Local site conditions were expressed as the mean shear wave velocity at 30 m depth (Vs30). The data used come from the latest updated Vs30 model for New Zealand (Foster et al. Citation2019).
Results
Fault map
The results of fault mapping, as shown in B, demonstrates the distributed nature of the surface deformation along the Te Puninga Fault. The total fault length based on mapped traces is 30 km. More careful topographic analysis has allowed more scarps to be identified as fault traces, rather than terrace risers, than on previous maps (). As a result, at the surface, the Te Puninga Fault is composed of more than 10 parallel strands for most of its length. Fault strand length is variable with ∼30% of mapped traces < 200 m in length, 68% of mapped traces < 1 km in length, and only 1% of traces greater than 10 km in length. These strand lengths should be considered as minimums as we are referring to mapped length and traces that could be longer but not expressed at the land surface – for example, because of erosion or human modification.
A key finding from the fault mapping is that the largest displacements occur on the fault strands that dip to the southwest. This finding suggests that the main fault plane at depth is likely southwest dipping. Based on preliminary mapping, Persaud et al. (Citation2016) suggested that the ‘Te Puninga segment’ dipped to the northeast and that it was probably connected at depth with the Kerepehi Fault. If the Te Puninga Fault plane is subparallel to the Kerepehi Fault (i.e. both dip towards the same direction), they may not necessarily connect at depth. Hence it is preferable to consider the Te Puninga Fault as an independent fault.
Paleoseismic trenching – age of Hinuera surface displaced by the Te Puninga Fault
Stratigraphy and tectonic deformation in the trenches
The locations of the Arnold and Ryland trench sites were selected to target different fault strands and at least two different sections along the fault length to inform slip rate profiling swaths across the fault (B). Both trenches showed similar stratigraphic and tectonic deformation features ( and ).
Stratigraphic columns were constructed at multiple locations in each trench to incorporate all the detailed units observed in the two trenches. Three broad stratigraphic units were identified ( and ): (1) late Pleistocene secondary volcaniclastic alluvium, Hinuera C (of Manville and Wilson Citation2004), of the Hinuera Formation, labelled as Units A–C; (2) Holocene (post-Hinuera C) alluvium of Waitoa Formation (of Houghton and Cuthbertson Citation1989; Brathwaite and Christie Citation1996) (unit 1); and (3) a composite cover bed of mainly rhyolitic tephra-fall deposits of variable thickness up to 65 cm in total, labelled as TS (Bw) ( and ). Note that although Houghton and Cuthbertson (Citation1989) defined the Waitoa Formation as encompassing Holocene alluvium of the Waitoa and Waihou rivers and tributaries (plus minor peat), we have extended the coverage here to include Holocene alluvium of the Piako River and tributaries. correlates the simplified stratigraphy, including ages, as exposed at the two trenches with named geological deposits/formations. Different pedological soils identified at the land surface along each trench are also shown in .
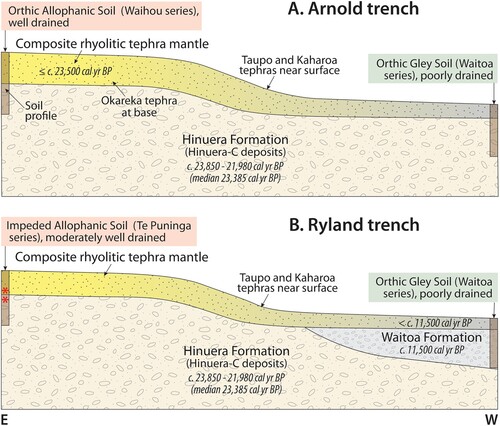
Figure 6. Schematic diagram of the general stratigraphy and chronology of the Arnold (A) and Ryland (B) trenches as east-west cross sections spanning the Te Puninga Fault, showing two or three main stratigraphic units, respectively, and associated pedological soils at the land surface. The surface soil classifications are based on Hewitt (Citation2010) and Hewitt et al. (Citation2021a, Citation2021b); the soil series names are from Wilson (Citation1980). Age on Hinuera C deposits based on this study (); age on base of tephra mantle (in Arnold trench) is based on likely presence of Okareka tephra (c. 23,500 cal yr BP), identified by Hughes (Citation2023); age on Waitoa Formation is from this study (). In Ryland trench, the asterisks in the soil profile represent redox features. Both sketches mimic the trench walls but are not to scale.
The Arnold trench comprised mainly Hinuera C deposits of the Hinuera Formation, with a c. 65 cm thick composite mantle of tephra-fall deposits on the upthrown side of the trench (, and supplementary material S1), diminishing to a c. 30 cm-thick mantle on the downthrown side where soil reducing (gley) conditions prevailed (including low-chroma colours, positive Childs’ test for Fe2+) (Hewitt et al. Citation2021b) (). Two visible tephra layers, Taupō (AD 232 ± 10) (as fine pumice lapilli) and Kaharoa (AD 1314 ± 12) (as very fine ash/silt), both thin, discontinuous layers ≤ 5 mm thick, were identified in each wall of this trench (supplementary material S1) (ages from Hogg et al. Citation2003, Citation2012, Citation2019). The likely presence of Okareka tephra (c. 23,500 cal yr BP), as a cryptotephra (Lowe Citation2011) at the base of the composite tephra mantle (on the upthrown side), was inferred using glass-shard analyses (Hughes Citation2023). Hinuera C deposits are labelled Unit A, Unit B, and Unit C from top to bottom. Unit A consists of two subunits A1 and A2. Unit B can be divided into five subunits (B1–B5), and Unit C into three subunits (C1–C3) (see descriptions in data supplement).
The Ryland trench stratigraphy comprises mainly Hinuera C deposits of the Hinuera Formation, labelled Unit A, Unit B (subunits B1–B3), and Unit C from top to bottom. On the downthrown side of the fault, and at the western end of the trench, about ∼1.5 m of volcaniclastic sediments of the Holocene Waitoa Formation were exposed overlying Hinuera Formation (, supplementary material S1). On the upthrown side of the trench, the composite mantle of tephra-fall deposits was c. 30–40 in thickness, with underlying soil horizons showing evidence of pedological redox reactions and associated redoximorphic features (including orange mottles, MnO2 concretions, some low-chroma colours), and a mantle of similar thickness, but under full reducing conditions, marked the land surface at the downthown side ().
The tectonic deformation in the trenches was expressed as folding, tilting, small faults and liquefaction features. The layers displayed in the trench logs ( and ) were horizontally deposited. However, they are currently folded into a broad fold, mimicking the same shape as the ground surface. If the topographic scarp had been a terrace riser, the layers would have been horizontal and likely eroded along the scarp. The Arnold trench () shows this broad folding, along with a clear liquefaction feature towards the eastern end (between 7 and 9 m in ) and a small fracture/fault at the western end (37–38 m in ). The Ryland trench also demonstrates a clear broad fold, as well as several smaller faults (2–13 m in ) and pervasive liquefaction features in the unit layers (8–16 m in ).
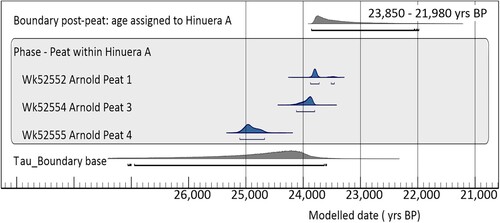
Three radiocarbon samples were positioned to provide a reliable age for the Hinuera surface at the trenching sites (). Note that most radiocarbon samples were collected from the Arnold trench and hence we have assigned similar ages to layers in the Ryland trench based on stratigraphic correlations. An exception is sample Wk52561 that returned an age of c. 11,500 cal yr BP on post-Hinuera alluvial deposits in the Ryland trench, enabling them to be assigned a Holocene age and correlated with the Waitoa Formation of Houghton and Cuthbertson (Citation1989). Samples Wk52552 (Arnold peat 1), Wk52554 (Arnold peat 3), and Wk52555 (Arnold peat 4, leaf material) were all peat samples obtained from the south wall of the Arnold trench (). The three samples date a thin (< 10 cm) and continuous peat horizon that is located about 80 cm below the top of the Hinuera Formation (between Units A and B). This peat probably represents a brief hiatus, and a low spot topographically such as a flood basin or abandoned braided channel with a high water table, in alluvial deposition during which organic matter accumulated (as described for lithofacies E by Hume et al. Citation1975). The peat therefore pre-dates the end of deposition of the Hinuera Formation, because the finer-grained upper Unit A material overlies this boundary. However, the precise length of time it pre-dates Hinuera Formation by is not constrained. To use the three radiocarbon ages to provide a maximum age for the Hinuera surface at the Arnold site we used a phase and Tau boundary sequence within OxCal (v. 4.4, Bronk Ramsey Citation2001, Citation2009; supplementary material S2). The Tau boundary function builds into the model an assumption that the radiocarbon ages cluster toward the end of the phase and the modelled event (i.e. end of Hinuera deposition) is close to the end of the phase. The three radiocarbon ages are placed in a phase together (because we cannot be certain of the stratigraphic ordering of the samples) and the boundary probability distribution function (PDF) that post-dates this phase is used to approximate the age of upper units of the Unit A deposit (). The 95% age range of the boundary PDF in the Oxcal model is 23,850–21,980 cal yrs BP (median age 23,385 cal yrs BP), which largely overlaps the age given to the surface by other authors of c. 24,000–23,500 cal yrs BP as described earlier, and by the likely presence of similarly-aged Okareka tephra overlying the Hinuera surface at the upthrown end of Arnold trench (Hughes Citation2023). The modelled boundary age distribution is then used in the slip rate calculations. Because a similar dating regime to constrain the age of the Unit A surface could not be undertaken at the Ryland site (noted above), the ages from the Arnold site are also applied to the Ryland swath.
Figure 7. The age model used to constrain the age of the Unit A deposits (95.4% probability range). Median age is 23,385 cal yrs BP. Age model derived from OxCal (v. 4.4; Bronk Ramsey Citation2001, Citation2009) using the SHCal20 calibration curve (Hogg et al. Citation2020).
The date of the end of the Hinuera Formation deposition is probably slightly younger than the Unit A–Unit B dated contact but when Unit A1–Unit A2 contact is plotted with the surface profile, both profiles have a vertical offset of 2.3 m. Because the amount of vertical offset for the top of the Hinuera Formation is the same as the surface (), it implies there has not been substantial deposition or erosion of the surface since 23,850–21,980 cal yrs BP, except for the deposition incrementally of <0.65 m-thick composite mantle of thin post-Hinuera tephra beds.
Slip rate
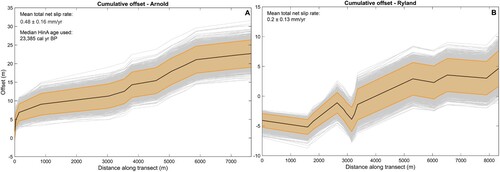
The cumulative net offsets of the ground surface from the two transect swaths across the Te Puninga Fault are displayed in . The average cumulative vertical displacement is 10 and 5 m along the Arnold and Ryland swaths, respectively. Using the age probability distribution we assign to the end of the deposition of the Hinuera Formation of 23,850–21,980 cal yrs BP, we achieve a total vertical slip rate of 0.41 ± 0.13 mm/yr and 0.17 ± 0.10 mm/yr, and a total net slip rate of 0.48 ± 0.16 mm/yr and 0.20 ± 0.13 mm/yr (all down to the southwest) for the Arnold and Ryland sites, respectively. These convert into an extension rate of 0.24 ± 0.12 mm/yr and 0.10 ± 0.1 mm/yr, respectively, for the Te Puninga Fault at each transect.
Figure 8. Profiles of cumulative net offset across the Arnold (A) and Ryland (B) profiling swaths. Down to the southwest is positive and down to the northeast is negative. The bold black line is the mean offset and orange bars reflect the 95% confidence interval. Grey lines are different simulations in the Monte Carlo used to propagate uncertainty.
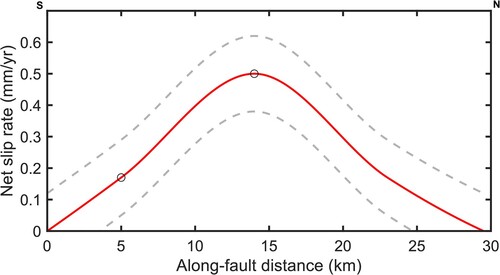
The Arnold and Ryland sites are located at different positions along the Te Puninga Fault. To obtain a mean net slip rate profile for the whole fault (hereafter referred to as along-fault net slip rate), we have assigned a bell-shaped slip rate distribution for the fault constrained by measurements from both the Arnold and Ryland profiling swaths. To do this we assume that slip rate is zero at each end of the fault and rises to a peak midway along the fault. The Arnold profiling swath corresponds to the approximate midpoint of the fault, and therefore we set the maximum slip rate along the Te Puninga Fault to equal the slip rate derived from this swath (). The same methodology is applied to calculate the mean extension rate of the Te Puninga Fault. The resulting along-fault net slip rate is 0.25 mm/yr (95% CI limits of 0.15–0.37 mm/yr) and the extension rate is 0.13 mm/yr (95% CI limits of 0.03–0.25 mm/yr). There could be large uncertainty when fitting only two values to a curve. In the supplementary material S3, we present other options where different types of curves have been used. The results do not differ significantly from those we obtained here and thus we consider this result as reasonable, given its preliminary character with only two slip rate estimates along the fault.
Figure 9. Interpolated along-fault net slip rate profile for the Te Puninga Fault. The red line is the average slip rate whereas the grey dashed lines reflect the two-sigma uncertainties on the net slip rate. Open circles are the net slip rates measured along the Ryland (south part of the fault) and Arnold (middle part of the fault) profiling swaths. The fault is assumed to have 0 mm/yr slip rate at its southern and northern ends.
Maximum magnitude
The maximum mapped surface length of the Te Puninga Fault is 30 km. Applying the scaling relation from Villamor et al. (Citation2001) with the subsurface length (34 km; using a conversion factor of 1.164 to convert surface to subsurface from Villamor et al. Citation2001) of the Te Puninga Fault results in a maximum magnitude of Mw 6.8. With the new scaling relations developed for the NSHM (Stirling et al. Citation2023 accepted) for normal faults, a magnitude of Mw 6.9 ± 0.35 is obtained. This scenario assumes that the fault ruptures along its whole length (30 km) and whole width (using a seismogenic depth of 17 km) (Ellis et al. Citation2021; Seebeck et al. Citation2023). The NSHM Mw value is consistent with Mw calculated using the Villamor et al. (Citation2001) scaling relation. We use the Mw of 6.9 derived from the NSHM scaling relations to model recurrence interval, PGA, and MMI in the following sections.
Recurrence interval
Applying the maximum magnitude calculated in the previous section with scaling laws from Villamor et al. (Citation2001) results in a displacement of 2.2 m (95% CI of 1.2–3.9 m). This reflects a maximum displacement that would result if the entire length of the Te Puninga Fault ruptures during a single earthquake. Such a displacement, along with the along-fault net slip rate (0.25 mm/yr), leads to a mean recurrence interval of 6200 (95% CI of 3000–11,500 years). However, because we do not expect the entire length of the Te Puninga Fault to rupture during each earthquake, we consider this to be a maximum bound on recurrence interval of the Te Puninga Fault. Further work on the paleoearthquake chronology of the Te Puninga Fault is needed to better constrain its recurrence interval.
Expected shaking and damage
The slightly larger new Mw value obtained in this study (Mw 6.9), compared to the Mw value calculated previously (Mw 6.7) by Persaud et al. (Citation2016), has been used to calculate PGA and MMI expected in some of the larger townships or cities from rupture of the Te Puninga Fault.
In we show PGA and MMI values using the new average Mw obtained from scaling relations used in the NZ NSHM (Gerstenberger et al. Citation2022) described in previous sections. We also show the results for Mw 7.25, a value that is suggested by the NZ NSHM for multifault ruptures (see discussion below).
Table 2. Potential Peak Ground Acceleration (PGA) and Modified Mercalli Intensity (MMI) that could be expected in selected townships following rupture of the Te Puninga Fault.
Discussion
Long-term geological vs short-term geodetic extension rate
The most recent estimate of the geodetic extension (widening) rate across the Hauraki Rift is 1.15 ± 0.3 mm/yr (three-year duration from 2015 to 2017; Pickle Citation2019). Assuming a fault dip of 60 ± 15°, we have obtained an average along-fault extension rate for the Te Puninga Fault of 0.13 mm/yr (0.03–0.25 mm/yr), which is slightly larger than the extension rate suggested by Persaud et al. (Citation2016) of 0.09 mm/yr (0.01–0.20 mm/yr; calculated using the slip rate from Persaud et al. Citation2016, and assuming the same fault dip as used here). To assess a late Quaternary extension rate for the Hauraki Rift we add the new Te Puninga Fault extension rate value to that of the Waitoa segment of the Kerepehi Fault (Waitoa segment average extension rate of 0.18 mm/yr; range of 0.06–0.37 mm/yr; calculated from a slip rate of 0.22–0.4 mm/yr in Persaud et al. Citation2016 and assuming the same fault dip; see for location). This sum achieves a total average long term extension rate of 0.33 mm/yr (0.13–0.58 mm/yr). This value is short of the three-year rate of 1.15 ± 0.3 mm/yr (Pickle Citation2019) of rift-perpendicular extension calculated using geodetic data. There could be several reasons for this:
− Faults can have variable slip rates over time (Nicol et al. Citation2006; Zinke et al. Citation2019). The late Quaternary average estimates that we have calculated here result in a long-term geologic extension rate. In contrast, the geodetic estimate from Pickle (Citation2019) provides an estimate of extension rate for only a three-year period. Clustering of earthquakes, which leads to faster slip rates during some periods and slower slip rates during others, may occur and such a scenario has been suggested for the Kerepehi Fault over the period c. 18,000–15,000 cal yrs BP (Persaud et al. Citation2016). The difference in extension rates could be due to changes in slip rate over time where the extension rate established in this study reflects the behaviour of the Te Puninga Fault over longer geologic timescales, while the geodetic extension rate constrained by Pickle (Citation2019) may reflect a more recent period of elevated slip rate along the Te Puninga Fault. A mechanism suggested for this variability is the presence of variable size earthquake ruptures along the fault system (e.g. suggested for Marmara Sea fault system; Hergert and Heidbach Citation2010) rather than a repeated single characteristic rupture.
− There are now more active traces of the Kerepehi Fault than those shown in Persaud et al. (Citation2016). Distributed deformation is common in sedimentary basins where sedimentation rates exceed tectonic rates, as faults continuously break through new sediments (Childs et al. Citation2017). Small fault offsets can be difficult to identify in the absence of high resolution topographic maps. Additional Kerepehi Fault traces were identified here during mapping of the Te Puninga Fault with LiDAR-derived high resolution topographic maps. Persaud et al. (Citation2016) focused mainly on the large escarpment that was trenched. It is possible that mapping new active traces of the Kerepehi Fault, as well as obtaining better constraints on the age of geomorphic surfaces, may result in a different extension rate for the Kerepehi Fault. Our study assigns almost the same slip rate to the Te Puninga Fault as that estimated on the Kerepehi Fault by Persaud et al. (Citation2016). However, the geomorphic expression of the Kerepehi Fault is more prominent than that of the Te Puninga Fault. It is possible that a more detailed study on the Kerepehi Fault will produce a faster slip rate than that already constrained to date, which will bring the long-term geological extension rate closer to the short-term geodetic one.
− Small scale faulting, not detectable in the landscape, and/or distributed aseismic deformation could be missing from the long term deformation records, as suggested for other extensional areas (e.g. western Canada; Mazzotti et al. Citation2011). In the Taupo Rift, a rift with similar sedimentary material to the Hauraki Plains but with more fault exposure, Villamor and Berryman (Citation2001) suggest that undetectable small scale faulting could be contributing to <5% of the total extension, which is still short of the 70% discrepancy in the deformation values.
− We have used a fault dip value of 60 ± 15° on the whole fault width to calculate a net slip rate and extension rate from the vertical slip rate. Extension rate values could be larger than those obtained here if the fault has a listric plane geometry with shallower dip in deep sections of the crust (e.g. Delano et al. Citation2022).
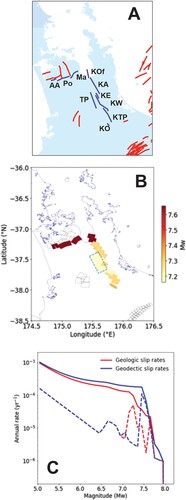
Figure 10. A, Fault sources around the Te Puninga Fault from the NZ Community Fault Model (NZ CFM, Seebeck et al. Citation2023). In blue are active faults that could rupture with the Te Puninga (TP) Fault based on the grand inversion in the 2022 NZ NSHM (Gerstenberger et al. Citation2022), namely: segments of the Kerepehi Fault (KO, Okoroire; KTP, Te Poi; KW, Waitoa; KE, Elstow; KA, Awaiti; KOf, Offshore) and the Mangatangi (Ma), Pokeno (Po) and Aka Aka (AA) faults. In red are other fault sources in the NZ CFM. B, Single-event ruptures of multiple faults that include the Te Puninga Fault (dashed box) are depicted by the filled polygons. The larger magnitude events are superimposed by the smaller magnitude ones. Open polygons denote fault segments (of the Community Fault Model; Seebeck et al. Citation2023) that do not participate in any of the ruptures involving the Te Puninga Fault. C, Participation magnitude frequency distribution of the events associated with the Te Puninga Fault. The event rates include those given by inversion of slip rates and distributed (or background) seismicity. The former accounts for magnitudes larger than Mw 6.8. The event rates derived from the inversion of the geologic slip rates (red lines) show a characteristic event with the mode at Mw ∼7.25, while those derived from the inversion of geodetic slip rates (blue lines) show the mode at Mw ∼7.45. The dataset shown in (B) and (C) was extracted from the 2022 NZ NSHM (Gerstenberger et al. Citation2022).
This discussion highlights the need for a full update of geological slip rates across the Hauraki Rift to enable a sound comparison with geodetic data to be undertaken.
Hazards from the Te Puninga Fault
We have updated the maximum magnitude (average Mw 6.9), slip rate (average 0.25 mm/yr), and recurrence interval (average 6200 years) for the Te Puninga Fault. Although the new values are not substantially different from those assigned previously, they are the first estimates based on geologic data and have explicit uncertainties attached to them. The new average net slip rate is larger than those from Persaud et al. (Citation2016) (average slip rate of 0.16 mm/yr) but it is still characteristic of those of low to moderate seismicity areas. The updated estimates of slip rate and recurrence interval of the Te Puninga Fault are very similar to those calculated for the Kerepehi Fault by previous authors (Persaud et al. Citation2016), which raises the question whether the hazard for the Kerepehi Fault could be somewhat underestimated, as discussed in the previous section. We recommend that the new values for the Te Puninga Fault are used for future editions of the NZ CFM (Seebeck et al. Citation2023) and the NZ NSHM (Gerstenberger et al. Citation2022).
In this study, we have used a characteristic earthquake approach (Schwartz and Coppersmith Citation1984) to calculate the Mw for the Te Puninga Fault from scaling relations. In this section we compare our results to the output from the ‘grand inversion’ (Field et al. Citation2014) undertaken for the 2022 NZ NSHM (Gerstenberger et al. Citation2022), which uses the same scaling relations outlined above, but which also incorporates the possibility that faults rupture in small segments and connect (co-rupture) or participate in ruptures that begin on other nearby faults.
shows that the Te Puninga Fault may participate in larger ruptures, resulting from co-rupture with the Kerepehi (Okoroire, Te Poi, Waitoa, Elstow, Awaiti and offshore segments), Mangatangi, Aka Aka and Pokeno faults (A,B). Note that these co-ruptures only include an offshore segment of the Kerepehi Fault, immediately close to the onshore, also included in the NZ CFM (Seebeck et al. Citation2023) and in the 2022 NZ NSHM (Gerstenberger et al. Citation2022). Offshore segments of the Kerepehi Fault further north have been defined based on geophysical data (e.g. Hochstein and Nixon Citation1979; Ferguson et al. Citation1980; Hochstein et al. Citation1986; Chick et al. Citation2001) and used by Persaud et al. (Citation2016). However, those offshore segments are not included in the NZ CFM or the NZ NSHM because the evidence for recent activity is not strong (e.g. no disruption of the Hinuera Formation; Willem de Lange, pers. comm). Therefore we have not included them in our analysis.
Several events with varying magnitudes are associated with the Te Puninga Fault depending on the connectivity with the surrounding faults. The discrete curves in C show the recurrence rates (rupture participation rates) for different magnitudes (single and multi-fault rupture events). The event rates derived from the inversion of the geologic slip rates (red lines) show a characteristic event with the mode at Mw ∼7.25, whereas those derived from the inversion of geodetic slip rates (blue lines) show the mode at Mw ∼7.45. These ruptures build most of the seismic moment associated with the fault. If we use Mw 6.9 and 7.25 from our results above, the 2022 NZ NSHM assigns recurrence intervals ranging from 4736 to 6762 years (similar to our results) and from 5656 to 10,398 years for Mw ≥6.9 and Mw ≥7.25 events, respectively. The lower bound of the recurrence times is obtained using fault slip rates from the geodetic data and the upper bound from the geologic data. This difference reflects larger strain displayed by the geodetic data.
In summary, our results are similar to the geological derived results from the 2022 NZ NSHM and single fault rupture for the Te Puninga Fault. However, the NSHM approach includes the potential of larger multi-fault ruptures (with recurrence periods in order of 5500–10,000 years) than those explored in this study.
Ground shaking: do our new data change previous estimates?
Our estimates of MMI associated with rupture of the Te Puninga Fault () are around one unit larger than those previously published by Persaud et al. (Citation2016). This increase is mainly related to the larger average Mw estimated here because the attenuation models used (Dowrick and Rhoades Citation2005). Small differences in soil mechanics class assignation at each site (i.e. Vs30 assumed at the sites) and number of simulations performed to estimate mean MMI values could also slightly contribute to this difference.
The average Mw 6.9 obtained here will result in ground shaking intensities of MMI 9 + in Morrinsville and MMI 9 in Te Aroha (). Tauranga and Hamilton will experience MMIs of 6 + and 8, respectively. Based on New Zealand MMI descriptors (Dowrick Citation1996), Tauranga would experience substantial damage to fragile contents of buildings, cracks in unreinforced stone and brick walls (some substantially damaged), small slides and rock falls and minor liquefaction. In Hamilton, shaking would potentially have the following consequences: unreinforced masonry would be heavily damaged and some could collapse; reinforced masonry or concrete buildings could sustain important damage; unreinforced domestic chimneys would be damaged; and small to moderate slides and some liquefaction may occur. Te Aroha would see many unreinforced buildings fully destroyed and other reinforced masonry and concrete buildings and bridges damaged (some collapsed), substantial cracking of the ground, sliding on steep slopes, and liquefaction. Finally, the closest township to the fault, Morrinsville, would be slightly more adversely affected than Te Aroha with most unreinforced masonry buildings destroyed and reinforced masonry, concrete buildings and some bridges substantially damaged; some timber buildings could be moderately damaged; landsliding would occur; and liquefaction and lateral spreading would be widespread and potentially severe. If a larger (Mw 7.25), multi-fault rupture event occurred the damage would be somewhat larger (see ) but the probability of occurrence of this larger earthquake is smaller (see section above).
These shaking effects can be devastating for the communities, and for the agricultural businesses on which much of the region’s wealth depends. It is important to note that this damage would occur simultaneously in different cities during a large earthquake on the Te Puninga Fault, which will stretch the regional and national resources for response and recovery. Planning for response and recovery needs to be undertaken across the district and regional councils with support from nearby regions to avoid resource exhaustion.
The Hauraki Plains and Hamilton lowlands region is an area of increasing population growth and development. Planning for such an event is important, despite the rarity of its occurrence (see also Kluger et al. Citation2023). Shaking levels for moderate earthquakes for this area are already incorporated in the current New Zealand Building Code. Once the new Te Puninga Fault seismic parameters are incorporated into the NZ NSHM, we do not expect large changes to the design levels needed of residential construction. Also, the large recurrence interval of the fault will likely not affect development of residential housing close to the fault (see Ministry for the Environment guidelines for ‘Building on, or close to, active faults’; Kerr et al. Citation2003). However, it is important to ensure that the design of critical facilities considers the possibility of a rare but larger event. A large earthquake would cause substantial damage to residential, industrial, and power-generating facilities, and could affect groundwater quality and distribution. New development of critical facilities, such as hospital, emergency centres, etc., could be undertaken to successfully mitigate earthquake risk, using the mapping and new fault characterisation here. Also citizens can greatly contribute towards mitigation by following recommendations on how to prepare for a large earthquake (e.g. https://www.eqc.govt.nz/be-prepared/). In addition, cascading hazards may be a major consequence of a large earthquake in the Hauraki Plains, as in the following examples: (1) flood defence infrastructure could be damaged directly by shaking, or by ground compaction/subsidence associated with the strong shaking itself or with permanent ground deformation (fault rupture or liquefaction; Dellow et al. Citation2011; Green et al. Citation2011); (2) flooding hazard can also occur by damage of storm water systems (Cavalieri et al. Citation2016) or alteration of the natural drainage (Cavalieri et al. Citation2023); (3) landsliding may occur in the adjacent steep terrain by strong shaking or by liquefaction at the toes of landslides (Carey et al. Citation2017); (4) landslides can produce stream blockage (landslide dams) that may cause flooding weeks to months after the earthquake (Fan et al. Citation2020); (5) tsunami hazard can be altered by permanent tectonic subsidence of the coast on the hanging wall of the fault.
With this paper we want to enhance the community awareness of the earthquake hazard in an area typically perceived as having low hazard due to a lack of historical large earthquakes in the region. From the science perspective, further work is needed to resolve the exact timing of individual earthquakes on the Te Puninga Fault; the time since the last event; and to identify whether there is geological evidence of co-rupture with the Kerepehi Fault.
Conclusions
In this study we provide the first field-based assessment of the seismic potential of the Te Puninga Fault, Hauraki Plains, Waikato. The fault was previously considered a segment of the Kerepehi Fault (Persaud et al. Citation2016) and its slip rate was based on comparison with the Kerepehi Fault (Seebeck et al. Citation2023). New detailed mapping shows that the fault dips to the west, different from previous results, and thus the Te Puninga Fault can now be considered an independent fault to the Kerepehi Fault (i.e. they may not join at depth).
The new slip rate values, based on geomorphic data and stratigraphic and chronological evidence from two paleoseismic trenches, show that the fault is slightly more active than previously considered, with an average along-fault net slip rate of 0.25 mm/yr. This new value and a new estimate of Mw for the fault of 6.9 ± 0.35 have been used to derive the first, but still preliminary, rupture recurrence interval of 6200 years (with a range of 3000–11,500 years). Comparisons of geomorphic expression and slip rate values between the Kerepehi and Te Puninga faults, and with the Hauraki Rift geodetic extension rates, suggest that the slip rate currently assigned to the Kerepehi Fault could be underestimated.
The earthquake magnitude estimated here for the Te Puninga Fault of Mw 6.9 ± 0.35 is based on a characteristic earthquake model and is similar to the previously assigned value of Mw 6.8 (Persaud et al. Citation2016). If we consider the new methods used in the 2022 NZ NSHM, which allow for multi-fault ruptures, the Te Puninga Fault could rupture with the Kerepehi, Mangatangi, Aka Aka, and Pokeno faults in ruptures that generate earthquakes of Mw 7.25−7.45.
The new PGA and MMI estimates for a Mw 6.9 earthquake are only slightly larger than those published prior to this study. This Mw would produce shaking levels of MMI 9 + in Morrinsville, 9 in Te Aroha, 6 + in Tauranga, and 8 in Hamilton. If a larger, multi-fault rupture occurred, the damage would be somewhat larger () but the probability of occurrence of this larger earthquake is smaller.
Although ruptures of the Te Puninga Fault are infrequent and will not affect the calculations by engineers for seismic loads of most building types, they may affect seismic load estimates and building location decisions for development of new critical facilities such as hospitals and emergency response centres. With this paper we want to enhance the community awareness of the earthquake hazard in an area typically perceived as having low seismic hazard due to a lack of historical large earthquakes in the region. We recommend that this new information is added to the next generation of the CFM (Seebeck et al. Citation2023) and the NZ NSHM (Gerstenberger et al. Citation2022).
Acknowledgements
Ki a tātou te hunga ora, tēnā tātou. E mihi kau ana Ngati Haua, Ngati Hako he papā te whatitiri, hikohiko te uira, kia kotahi ai ngā maunga. Ngā tohu me nga mahitahi ngā e ki ai I te tangata he rangatira. We acknowledge the dominion of mana whenua Ngāti Hauā, Ngāti Hako. We work across many disciplines to increase our research engagement based on generative systems of knowledge alongside and with Mātauranga Māori experts. We are grateful to landowners and farm managers for permission to access their land to undertake field reconnaissance and excavate trenches, and their support during this study. We thank local Māori, Ngāti Haua and Ngāti Hako, for their support with kaitiakitanga and mātauranga Māori knowledge share. Diane Bradshaw facilitated Iwi engagement and in-depth knowledge of tikanga Māori. Thanks also to colleagues who helped with the trench study: Kelvin Berryman, Phillipa Morris, Yaasameen Shalla, Olivia Mark, Rob Langridge, George McQuillan, and Brent Alloway. This study has been co-funded by Earthquake Commission (Toka Tū Ake) grant number 20790; GNS Science (SSIF funds); and University of Waikato’s Marsden Fund Te Pūtea Rangahau a Marsden grant UOW1902 and MBIE Endeavour Fund Smart Ideas grant UOWX1903 (these last two grants supporting the ‘Tephra-Seismites project’: https://tephra-seismites.com/). Waikato Regional Council provided LiDAR data and generously supported the Tephra-Seismites project with additional funding in the form of a PhD student scholarship. We especially thank an anonymous referee and Gabor Kereszturi (editor) for their helpful comments that have enabled us to improve the paper. Regine Morgenstern and Robert Langridge are thanked for reviewing an early version of this paper.
Disclosure statement
No potential conflict of interest was reported by the author(s).
Data availability statement
The authors confirm that the data supporting the findings of this study are available within the article and its supplementary materials [https://doi.org/10.21420/bh9t-fr52]. Active fault traces are currently in the processed of being incorporated into the publicly available NZ Active Fault Database [https://www.gns.cri.nz/data-and-resources/new-zealand-active-faults-database/].
Additional information
Funding
References
- Adams RD, Muir MG, Kean R. 1972. Te Aroha earthquake, 9 January 1972. Bull N Z Soc Earthq Eng. 5(2):54–58. doi:10.5459/bnzsee.5.2.54-58.
- Barker SJ, Wilson CJ, Illsley-Kemp F, Leonard GS, Mestel ER, Mauriohooho K, Charlier BL. 2021. Taupō: an overview of New Zealand’s youngest supervolcano. New Zeal J Geol Geop. 64:320–346. doi:10.1080/00288306.2020.1792515.
- Barrell DJA, Almond PC, Vandergoes MJ, Lowe DJ, Newnham RM, NZ-INTIMATE Members. 2013. A composite pollen-based stratotype for inter-regional evaluation of climatic events in New Zealand over the past 30,000 years (NZ-INTIMATE project). Quat Sci Rev. 74:4–20. doi:10.1016/j.quascirev.2013.04.002.
- Brathwaite RL, Christie AB. 1996. Geology of the Waihi area 1:50,000: part sheets T13 and U13. Lower Hutt (NZ): Institute of Geological & Nuclear Sciences. 1 sheet + 64p.
- Broermann J, Bennett RA, Kreemer C, Blewitt G, Pearthree PA. 2021. Geodetic extension across the southern Basin and Range and Colorado Plateau. J Geophys Res Solid Earth. 126(6):e2020JB021355. doi:10.1029/2020JB021355.
- Bronk Ramsey C. 2001. Development of the radiocarbon calibration program. Radiocarbon. 43:355–363. doi:10.1017/S0033822200038212.
- Bronk Ramsey C. 2009. Bayesian analysis of radiocarbon dates. Radiocarbon. 51:337–360. doi:10.1017/S0033822200033865.
- Cabral J, Moniz C, Batlló J, Figueiredo P, Carvalho J, Matias L, Teves-Costa P, Dias R, Simão N. 2013. The 1909 Benavente (Portugal) earthquake: search for the source. Nat Hazards. 69:1211–1227. doi:10.1007/s11069-011-0062-8.
- Carey JM, McSaveney MJ, Petley DN. 2017. Dynamic liquefaction of shear zones in intact loess during simulated earthquake loading. Landslides. 14:789–804. doi:10.1007/s10346-016-0746-y.
- Cavalieri F, Franchin P, Giovinazzi S. 2016. Earthquake-altered flooding hazard induced by damage to storm water systems. Sustain Resilient Infrastruct. 1(1-2):14–31. doi:10.1080/23789689.2016.1178560.
- Cavalieri F, Franchin P, Giovinazzi S. 2023. Multi-hazard assessment of increased flooding hazard due to earthquake-induced damage to the natural drainage system. Reliab Eng Syst Saf. 237:109348. doi:10.1016/j.ress.2023.109348.
- Chick LM, De Lange WP, Healy TR. 2001. Potential tsunami hazard associated with the Kerepehi Fault, Firth of Thames, New Zealand. Nat Hazards. 24:309–318. doi:10.1023/A:1012210314609.
- Childs C, Holdsworth RE, Jackson CAL, Manzocchi T, Walsh JJ, Yielding G. 2017. Introduction to the geometry and growth of normal faults. Geol Soc London Spec Publ. 439(1):1–9. doi:10.1144/SP439.24.
- Clayden B, Hewitt AE. 1989. Horizon notation for New Zealand soils. Lincoln (NZ): Manaaki Whenua Press.
- Cox SC, Stirling MW, Herman F, Gerstenberger M, Ristau J. 2012. Potentially active faults in the rapidly eroding landscape adjacent to the Alpine Fault, central Southern Alps, New Zealand. Tectonics. 31(2):1–24. doi:10.1029/2011TC003038.
- Delano JE, Stahl T, Howell A, Clark K. 2022. 3D coseismic surface displacements from historical aerial photographs of the 1987 Edgecumbe earthquake, New Zealand. J Geophys Res Solid Earth. 127(11):e2022JB024059. doi:10.1029/2022JB024059.
- Dellow G, Yetton M, Massey C, Archibald G, Barrell DJA, Bell D, Bruce Z, Campbell A, Davies T, De Pascale G, Easton M. 2011. Landslides caused by the 22 February 2011 Christchurch earthquake and management of landslide risk in the immediate aftermath. Bull N Z Soc Earth Eng. 44(4):227–238. doi:10.5459/bnzsee.44.4.227-238.
- Dempsey D, Eccles JD, Huang J, Jeong S, Nicolin E, Stolte A, Wotherspoon L, Bradley BA. 2021. Ground motion simulation of hypothetical earthquakes in the upper North Island of New Zealand. New Zeal J Geol Geop. 64(4):570–588. doi:10.1080/00288306.2020.1842469.
- Dowrick DJ. 1996. The modified Mercalli earthquake intensity scale: revisions arising from recent studies of New Zealand earthquakes. Bull N Z Soc Earthq Eng. 29(2):92–106.
- Dowrick DJ, Rhoades DA. 2005. Revised models for attenuation of modified Mercalli intensity in New Zealand earthquakes. Bull N Z Soc Earthq Eng. 38(4):185–214. doi:10.5459/bnzsee.38.4.185-214.
- Edbrooke SW. 2001. Geology of the Auckland area. Lower Hutt (NZ): Institute of Geological and Nuclear Sciences. 1 sheet + 74p. 1:250,000 Geological Map 3.
- Edbrooke SW. 2005. Geology of the Waikato area. Lower Hutt (NZ): Institute of Geological and Nuclear Sciences. 1 sheet + 68p. 1:250,000 Geological Map 4.
- Ellis S, Bannister S, Van Dissen R, Eberhart-Phillips D, Boulton C, Reyners M, Funnell R, Mortimer N, Upton P. 2021. New Zealand Fault Rupture Depth Model v1.0: a provisional estimate of the maximum depth of seismic rupture on New Zealand’s active faults. Lower Hutt (NZ): GNS Science. GNS Science report: 2021/08. doi:10.21420/4Q75-HZ73.
- Fan X, Dufresne A, Subramanian SS, Strom A, Hermanns R, Stefanelli CT, Hewitt K, Yunus AP, Dunning S, Capra L, Geertsema M. 2020. The formation and impact of landslide dams–state of the art. Earth-Sci Rev. 203:103–116.
- Ferguson SR, Hochstein MP, Kibblewhite AC. 1980. Seismic refraction studies in the northern Hauraki Gulf, New Zealand. New Zeal J Geol Geop. 23(1):17–25. doi:10.1080/00288306.1980.10424189.
- Field EH, Arrowsmith RJ, Biasi GP, Bird P, Dawson TE, Felzer KR, Jackson DD, Johnson KM, Jordan TH, Madden C, Michael AJ. 2014. Uniform California earthquake rupture forecast, version 3 (UCERF3)—The time-independent model. Bull Seismol Soc Am. 104(3):1122–1180. doi:10.1785/0120130164.
- Foster K, Bradley BA, McGann CR, Wotherspoon LM. 2019. A VS 30 map for New Zealand based on geologic and terrain proxy variables and field measurements. Earthq Spectra. 35(4):1865–1897. doi:10.1193/121118EQS281M.
- [GEM] Global Earthquake Model. 2019. OpenQuake Engine 3.16. doi:10.13117/openquake.engine.
- Gerstenberger MC, Bora S, Bradley BA, DiCaprio C, Van Dissen RJ, Atkinson GM, Chamberlain C, Christophersen A, Clark KJ, Coffey GL, et al. 2022. New Zealand National Seismic Hazard Model 2022 revision: model, hazard and process overview. Lower Hutt (NZ): GNS Science. GNS Science report: 2022/57. doi:10.21420/TB83-7X19.
- Green RA, Allen J, Wotherspoon L, Cubrinovski M, Bradley B, Bradshaw A, Cox B, Algie T. 2011. Performance of levees (stopbanks) during the 4 September 2010 Mw 7.1 darfield and 22 February 2011 Mw 6.2 Christchurch, New Zealand, earthquakes. Seis Res Lett. 82(6):939–949. doi:10.1785/gssrl.82.6.939.
- Hergert T, Heidbach O. 2010. Slip-rate variability and distributed deformation in the Marmara Sea fault system. Nature Geos. 3(2):132–135. doi:10.1038/ngeo739.
- Hewitt AE. 2010. New Zealand Soil Classification. Lincoln (NZ): Manaaki Whenua Press. (Landcare Research science series; 1). doi:10.7931/DL1-LRSS-1-2010.
- Hewitt AE, Balks MR, Lowe DJ. 2021a. Allophanic soils. In: The soils of Aotearoa New Zealand. Cham: Springer; p. 21–39.
- Hewitt AE, Balks MR, Lowe DJ. 2021b. Gley Soils. In: The soils of Aotearoa New Zealand. Cham: Springer; p. 73–85.
- Hochstein MP, Ballance PF. 1993. Hauraki Rift: a young, active, intra-continental rift in a back-arc setting. South Pacific sedimentary basins. Sediment Basins World. 2:295–305.
- Hochstein MP, Nixon IM. 1979. Geophysical study of the Hauraki Depression, North Island, New Zealand. New Zeal J Geol Geop. 22(1):1–19. doi:10.1080/00288306.1979.10422550.
- Hochstein MP, Tearney K, Rawson S, Davey FJ, Davidge S, Henrys S, Backshall D. 1986. Structure of the Hauraki Rift (New Zealand). R Soc N Z Bull. 24:333–348.
- Hogg AG, Heaton TJ, Hua Q, Palmer JG, Turney CSM, Southon J, Bayliss A, Blackwell PG, Boswijk G, Bronk Ramsey C, et al. 2020. SHCal20 Southern Hemisphere calibration, 0–55,000 years cal BP. Radiocarbon. 62(4):759–778. doi:10.1017/RDC.2020.59.
- Hogg AG, Higham TFG, Lowe DJ, Palmer J, Reimer P, Newnham RM. 2003. A wiggle-match date for Polynesian settlement of New Zealand. Antiquity. 77:116–125. doi:10.1017/S0003598X00061408.
- Hogg AG, Lowe DJ, Hendy CH. 1987. University of Waikato radiocarbon dates I. Radiocarbon. 29:263–301. doi:10.1017/S0033822200056976.
- Hogg AG, Lowe DJ, Palmer JG, Boswijk G, Bronk Ramsey CJ. 2012. Revised calendar date for the Taupo eruption derived by 14C wiggle-matching using a New Zealand kauri 14C calibration data set. Holocene. 22:439–449. doi:10.1177/0959683611425551.
- Hogg AG, Wilson CJN, Lowe DJ, Turney CSM, White P, Lorrey AM, Manning SW, Palmer JG, Bury S, Brown J, et al. 2019. Wiggle-match radiocarbon dating of the Taupo eruption. Nat Commun. 10(1):4669. doi:10.1038/s41467-019-12532-8.
- Houghton BF, Cuthbertson AS. 1989. Sheet T14 BD: Kaimai. Geological map of New Zealand 1:50,000. Wellington (NZ): New Zealand Geological Survey, Department of Scientific and Industrial Research. 1 sheet + 35p.
- Howell A, Nissen E, Stahl T, Clark K, Kearse J, Van Dissen R, Villamor P, Langridge R, Jones K. 2020. Three-dimensional surface displacements during the 2016 MW 7.8 Kaikōura earthquake (New Zealand) from photogrammetry-derived point clouds. J Geophys Res Solid Earth. 125(1):e2019JB018739. doi:10.1029/2019JB018739.
- Hughes JW. 2023. Late Quaternary paleoseismic history of the Te Puninga Fault, Hauraki Plains, northern New Zealand [unpublished MSc thesis]. Hamilton (NZ): University of Waikato.
- Hume TM, Sherwood AM, Nelson CS. 1975. Alluvial sedimentology of the Upper Pleistocene Hinuera Formation, Hamilton Basin, New Zealand. J R Soc N Z. 5:421–462. doi:10.1080/03036758.1975.10419362.
- Kear D, Schofield JC. 1978. Geology of the Ngaruawahia Subdivision. Wellington (NZ): New Zealand Geological Survey. Bulletin 88. Multiple sheets + 168p.
- Kerr J, Nathan S, Van Dissen RJ, Webb P, Brunsdon D, King AB. 2003. Planning for development of land on or close to active faults: a guideline to assist resource management planners in New Zealand. Lower Hutt (NZ): Institute of Geological & Nuclear Sciences. Client Report 2002/124. 71 p.
- Kluger MO, Lowe DJ, Moon VG, Chaneva J, Johnston R, Villamor P, Ilanko T, Melchert R, Orense RP, Loame RC, et al. 2023. Seismically-induced down sagging structures in tephra layers (tephra-seismites) preserved in lakes since 17.5 cal ka, Hamilton lowlands, New Zealand. Sediment Geol. 445:106327. doi:10.1016/j.sedgeo.2022.106327.
- Leonard GS, Begg JG, Wilson CJN. 2010. Geology of the Rotorua area. Lower Hutt (NZ): GNS Science. 1 sheet + 102p. Institute of Geological and Nuclear Sciences 1:250,000 Geological Map 5.
- Leonard GS, Townsend DB, Wilson CJN (compilers). Forthcoming 2024. Geology of the Taupō Volcanic Zone. Lower Hutt (NZ): GNS Science. 1 sheet + xx p. GNS Science Geological Map 8.
- Lowe DJ. 1988. Stratigraphy, age, composition, and correlation of late Quaternary tephras interbedded with organic sediments in Waikato lakes, North Island, New Zealand. New Zeal J Geol Geop. 31(2):125–165. doi:10.1080/00288306.1988.10417765.
- Lowe DJ. 2011. Tephrochronology and its application: a review. Quat Geochron. 6:107–153. doi:10.1016/j.quageo.2010.08.003.
- Lowe DJ, Green JD. Forthcoming 2024. Origins and ages of Waikato lakes. In: Özkundakci D, Grainger N, Dean-Speirs T, editors. Hidden gems of the Waikato – the history, ecology and management of Waikato lakes. Hamilton (NZ): Waikato Regional Council.
- Manville V, Hodgson KA, Nairn IA. 2007. A review of break-out floods from volcanogenic lakes in New Zealand. New Zeal J Geol Geop. 50:131–150. doi:10.1080/00288300709509826.
- Manville V, Wilson CJN. 2004. The 26.5 ka Oruanui eruption, New Zealand: a review of the roles of volcanism and climate in the post-eruptive sedimentary response. New Zeal J Geol Geop. 47:525–547. doi:10.1080/00288306.2004.9515074.
- Mazzotti S, Leonard LJ, Cassidy JF, Rogers GC, Halchuk S. 2011. Seismic hazard in western Canada from GPS strain rates versus earthquake catalog. J Geophys Res Solid Earth. 116(B12):B12310. doi:10.1029/2011JB008213.
- Meigs A. 2013. Active tectonics and the LiDAR revolution. Lithosphere. 5(2):226–229. doi:10.1130/RF.L004.1.
- Milne D, Clayden B, Singleton P, Wilson A. 1995. Soil description handbook: revised edition. Lincoln (NZ): Manaaki Whenua Press.
- Nicol A, Walsh J, Berryman K, Villamor P. 2006. Interdependence of fault displacement rates and paleoearthquakes in an active rift. Geology. 34(10):865–868. doi:10.1130/G22335.1.
- Niemi NA, Wernicke BP, Friedrich AM, Simons M, Bennett RA, Davis JL. 2004. BARGEN continuous GPS data across the eastern basin and range province, and implications for fault system dynamics. Geoph J Inter. 159(3):842–862. doi:10.1111/j.1365-246X.2004.02454.x.
- Persaud M, Villamor P, Berryman KR, Ries W, Cousins WJ, Litchfield N, Alloway BV. 2016. The Kerepehi Fault, Hauraki Rift, North Island, New Zealand: active fault characterisation and hazard. New Zeal J Geol Geop. 59:117–135. doi:10.1080/00288306.2015.1127826.
- Petersen MD, Zeng Y, Haller KM, McCaffrey R, Hammond WC, Bird P, Moschetti M, Shen ZK, Bormann J, Thatcher WR. 2014. Geodesy-and geology-based slip-rate models for the western United States (excluding California) national seismic hazard maps. U.S. Geological Survey. Open-File Report. 2013–1293. doi:10.3133/ofr20131293.
- Peti L, Hopkins JL, Augustinus P. 2021. Revised tephrochronology for key tephras in the 130-ka Ōrākei Basin maar core, Auckland Volcanic Field, New Zealand: implications for the timing of climatic changes, New Zealand. New Zeal J Geol Geop. 64:235–249. doi:10.1080/00288306.2020.1867200.
- Pickle R. 2019. Nature and potential origins of the low-rate tectonics of the Hauraki Rift and north-western New Zealand: a geophysical investigation [PhD thesis]. Auckland (NZ): University of Auckland.
- Pullar WA, Birrell KS. 1973. Age and distribution of late Quaternary pyroclastic and associated cover deposits of the Rotorua and Taupo area, North Island, New Zealand. Wellington (NZ): Department of Scientific and Industrial Research. New Zealand Soil Survey Report 1.
- Quigley M, Van Dissen R, Litchfield N, Villamor P, Duffy B, Barrell D, Furlong K, Stahl T, Bilderback E, Noble D. 2012. Surface rupture during the 2010 Mw 7.1 Darfield (Canterbury) earthquake: implications for fault rupture dynamics and seismic-hazard analysis. Geology. 40(1):55–58. doi:10.1130/G32528.1.
- Schofield JC. 1965. The Hinuera Formation and associated Quaternary events (with an appendix on experimental alluviation). New Zeal J Geol Geop. 8:772–791. doi:10.1080/00288306.1965.10422116.
- Schwartz DP, Coppersmith KJ. 1984. Fault behavior and characteristic earthquakes: examples from the Wasatch and San Andreas fault zones. J Geophys Res Solid Earth. 89(B7):5681–5698. doi:10.1029/JB089iB07p05681.
- Seebeck H, Nicol A, Giba M, Pettinga J, Walsh J. 2014a. Geometry of the subducting Pacific plate since 20 Ma, Hikurangi margin, New Zealand. J Geol Soc. 171(1):131–143. doi:10.1144/jgs2012-145.
- Seebeck H, Nicol A, Villamor P, Ristau J, Pettinga J. 2014b. Structure and kinematics of the Taupo rift, New Zealand. Tectonics. 33(6):1178–1199. doi:10.1002/2014TC003569.
- Seebeck H, Van Dissen RJ, Litchfield NJ, Barnes PM, Nicol A, Langridge RM, Barrell DJA, Villamor P, Ellis SM, Rattenbury MS, et al. 2023. The New Zealand Community Fault Model–version 1.0: an improved geological foundation for seismic hazard modelling. New Zeal J Geol Geop. doi:10.1080/00288306.2023.2181362.
- Stirling M, Fitzgerald M, Shaw B, Ross C. Accepted 2023. New magnitude – area scaling relations for the New Zealand National Seismic Hazard Model 2022. Bulletin of the Seismological Society of America. doi:10.1785/0120230114.
- Stirling M, McVerry G, Gerstenberger M, Litchfield N, Van Dissen R, Berryman K, Barnes P, Wallace L, Villamor P, Langridge R, et al. 2012. National seismic hazard model for New Zealand: 2010 update. Bull Seismol Soc Am. 102(4):1514–1542. doi:10.1785/0120110170.
- Vandergoes MJ, Hogg AG, Lowe DJ, Newnham RM, Denton GH, Southon J, Barrell DJ, Wilson CJ, McGlone MS, Allan AS, et al. 2013. A revised age for the Kawakawa/Oruanui tephra, a key marker for the Last Glacial Maximum in New Zealand. Quat Sci Rev. 74:195–201. doi:10.1016/j.quascirev.2012.11.006.
- Van Dissen RJ, Johnson KM, Seebeck H, Wallace LM, Rollins C, Maurer J, Gerstenberger MC, Williams CA, Hamling IJ, Howell A, DiCaprio CJ. Accepted 2023. Upper plate and subduction interface deformation models of the 2022 revision of the Aotearoa New Zealand national seismic hazard model. Bull Seis Soc Am. doi:10.1785/0120230118.
- Villamor P, Berryman K. 2001. A late Quaternary extension rate in the Taupo Volcanic Zone, New Zealand, derived from fault slip data. New Zeal J Geol Geop. 44(2):243–269. doi:10.1080/00288306.2001.9514937.
- Villamor P, Berryman KR, Ellis SM, Schreurs G, Wallace LM, Leonard GS, Ries WF. 2017. Rapid evolution of subduction-related continental intraarc rifts: The Taupo Rift, New Zealand. Tectonics. 36(10):2250–2272. doi:10.1002/2017TC004715.
- Villamor P, Berryman KR, Webb TH, Stirling MW, McGinty PJ, Downes GL, Harris JS, Litchfield NJ. 2001. Waikato seismic loads - Task 2.1: revision of seismic source characterisation. Lower Hutt (NZ): Institute of Geological & Nuclear Sciences. Client Report 2001/59.
- Villamor P, Litchfield N, Barrell D, Van Dissen R, Hornblow S, Quigley M, Levick S, Ries W, Duffy B, Begg J, Townsend D. 2012. Map of the 2010 Greendale Fault surface rupture, Canterbury, New Zealand: application to land use planning. New Zeal J Geol Geop. 55(3):223–230. doi:10.1080/00288306.2012.680473.
- Villamor P, Van Dissen RJ, Alloway BV, Palmer AS, Litchfield NJ. 2007. The Rangipo Fault, Taupo rift, New Zealand: an example of temporal slip-rate and single event displacement variability in a volcanic environment. Geol Soc Am Bull. 119(5/6):529–547. doi:10.1130/B26000.1.
- Wilson AN. 1980. Soils of the Piako County. Wellington (NZ): Department of Scientific and Industrial Research. New Zealand Soil Survey Report 39.
- Wilson CJN. 2001. The 26.5 ka Oruanui eruption, New Zealand: an introduction and overview. J Volcanol Geotherm Res. 112:133–174. doi:10.1016/S0377-0273(01)00239-6.
- Zinke R, Dolan JF, Rhodes EJ, Van Dissen R, McGuire CP, Hatem AE, Brown ND, Langridge RM. 2019. Multimillennial incremental slip rate variability of the Clarence fault at the Tophouse Road site, Marlborough fault system, New Zealand. Geophys Res Lett. 46(2):717–725. doi:10.1029/2018GL080688.