
ABSTRACT
The aim of the study was to identify genotypes with superior phenotypic performance, level and pattern of phenotypic diversity, and major contributing traits to the diversity of the test materials. Sixteen phenotypic traits of 81 sugarcane genotypes were analyzed using univariate and multivariate statistical methods. The genotypes were planted across two locations using a partially balanced lattice design with two replications. The study depicted the existence of substantial variation among the test materials in all the studied traits. The selected top 5% clones for cane yield, sucrose content and sugar yield were as follows: B694–11, B658–10, B707–1 and B572–1; B552–11, B498–9, B552–21 and B564–1; and B552–11, B549–10, B658–10 and B572–1, respectively. Sugarcane genotypes of clusters V and VII were the most divergent as demonstrated by their greatest intercluster distances, while sugar yield, cane yield and recoverable sucrose percent were the major contributors for the diversity of the test materials as revealed by PCA based on all of the studied traits. This suggests that the most divergent genotypes could be used as donor for hybridization, while those with greater mean values of the major contributing traits could be targeted for selection breeding.
Introduction
Sugarcane, a tall, perennial monocotyledonous grass, thrives in regions with ample sunlight, high temperatures and consistent water supply (Blume Citation1985). It has a C4 photosynthesis system that can convert up to 2% of solar energy into sucrose and biomass (Augstburger et al. Citation2001; Birru Citation2016). This plant species is remarkable not only for its high sucrose synthesis and accumulation abilities, as noted in Wang et al. (Citation2013), but also for its exceptional potential in biomass production compared to other cultivated plants, which is attributed to its distinctive capacity to produce numerous tillers with incredible ratooning ability and rapid growth rates (Heaton et al. Citation2008; Racedo et al. Citation2016; Kandel et al. Citation2018). Globally, sugarcane is a crucial source of food and energy, providing 80% of sugar and 60% of ethanol through its exceptional sucrose synthesis, accumulation and biomass production potential (Yang et al. Citation2020).
In Ethiopia, sugarcane is the sole raw material for the Ethiopian sugar factories, which play an immense role in the national economy. With a large (1.39 million ha) irrigable area specifically identified for sugarcane farming (Rezene Citation2009), Ethiopia has a climate and soil types that are favourable for sugarcane production (Embassy of Federal Democratic Republic of Ethiopia Citation2014; Semie et al. Citation2019). Expansion of existing sugarcane farms and development of new sugarcane plantations with the building of high-capacity sugar mills have been carried out in order to take advantage of these potentials, meet local sugar demand and export the surplus. Recently, the country has increased the size of its sugarcane plantations from 37,000 hectares to over 100,000 hectares, and the number of sugar mills has grown from three to seven. However, despite these efforts, the nation is still unable to meet its sugar demand due to declining cane and sugar productivity and steadily rising domestic consumption.
Between 1998 and 2019, the annual sugar production per hectare at Finchaa, Wonji and Metahara sugar estates experienced a significant decrease. Finchaa’s annual cane yield production decreased from 166 to 84, Wonji’s decreased from 140 to 101, and Metahara’s decreased from 165 to 157 t ha−1 (Tolera et al. Citation2023b). The cane production at Fincha sugar farms decreased by about 26.63% from 1997 to 2008, by 49.03% at Metahara from 1969 to 2008, and by 48.63% at Wonji Shoa from 1954 to 2008 (Tesfaye Citation2021). According to a recent study conducted in Wonji-shoa sugar estate, spanning from 1954 to 2022, it was found that nearly 69% of the sugarcane plantation fields experienced a decrease in yield. The decline rate was observed to be higher in the older sugarcane varieties, with a reduction of 8.4 tonnes per hectare per year in comparison with the newer ones (Dengia et al. Citation2023). Wonji and Metahara sugar estates experience reduced sucrose content and sugar yield (Ayele et al. Citation2021). Ethiopian sugar farms are experiencing a reduction in yield due to a shortage of improved generation sugarcane varieties (Kebede et al. Citation2013; Tena et al. Citation2016a; Dengia et al. Citation2023; Tolera et al. Citation2023b).
Although there is no empirical evidence of climate change-induced sugarcane productivity decline in Ethiopia, reports from various sugarcane-producing countries around the world have highlighted significant decreases in sugar yield. These declines have been attributed to the lack of climate-resilient sugarcane varieties, as well as the adverse effects of climate change such as drought, flooding and disease (USDA Citation2023).
Improved sugarcane varieties have been shown to significantly increase sugar yield. Studies conducted in different counties have reported substantial improvements, such as a 0.64% increase in Barbados (Simmonds Citation1979), 77.85 kg ha−1 a−1 in Brazil (Cursi et al. Citation2022), 5-12t ha−1 in Colombia (Cock Citation2001), 1.1% in Hawaii (Plucknett and Smith Citation1986), 20% in Queensland (Cox and Hansen Citation1995) and 31% in Australia. Globally, the use of improved sugarcane varieties has contributed to annual productivity gains of about 1% (Hogarth Citation1976; Berding et al. Citation2004), 1.0% to 1.5% (Jackson Citation2005a; Waclawovsky et al. Citation2010), and up to three-fold (Seema et al. Citation2020). Overall, the use of improved sugarcane varieties remains a well-established and effective strategy for enhancing sugar yield.
Most of the gains have come from improved cane yield rather than sucrose contents (Jackson, Citation2005b). Sugar yield improvement through sucrose content improvement is more preferable than via cane yield (Verma et al. Citation2019). Sucrose is the primary product in sugarcane cultivation and thus an important breeding target; however, its improvement remains very low in many breeding programmes (Wang et al. Citation2013; Chen et al. Citation2019) because of the limited variability in biochemical traits of sugarcane (Breaux Citation1984). Cane yield and sucrose percent are the components of sugar yield, and an improvement in either one of these characters or both at once, increases sugar production. However, improvement in these traits to increase sugar yield necessitates the existence of substantial diversity for the traits. It is vital to identify genotypes that can be used as best parental combinations for agro-morphological traits, which can enhance cane yield; biochemical traits, which can improve sucrose content; and both that can concurrently boost cane yield and sucrose content and thereby result in higher sugar yield.
Genetic variation that can lead to phenotypic variation in observable traits within a population is imperative in the improvement of agricultural and industrial crops (Swarup et al. Citation2021). Genetic variation refers to the genetic differences between individuals for a given attribute, whereas genetic diversity can be referred to as the range of trait variations in a crop or species (Hasan and Abdullah Citation2015), and thus genetic variation is the building block for genetic diversity. Genetic differences often lie in one or more DNA sequences and could occur due to variations in DNA sequence (Salgotra and Chauhan Citation2023), caused by mutation and recombination during sexual reproduction (Raffard et al. Citation2019). The creation of genetic variability through crossing two or more divergent parents and selection of the subsequent offspring to identify genotypes with superior performance of the desired traits is one of the most common existing breeding techniques.
The amount of genetic diversity in the available germplasm resources determines the ability to develop improved varieties that are more productive, resistant to yield-limiting factors and resilient to environmental changes (Hughes et al. Citation2008; Mondini et al. Citation2009; Hoban et al. Citation2021). Phenotypic diversity, which is often used as an indirect approach of measuring genetic diversity, represents the variation in the genic region of the genome that results in phenotypic manifestation. In sugarcane, agro-morphological and biochemical traits are the most commonly used phenotypic traits to estimate genetic diversity. Phenotypic traits are the most direct and the strongest predictors of a crop’s agronomic value as well as reflections of the true genetic potential of the genotypes under actual growing conditions (Govindaraj et al. Citation2015). Estimates of genetic diversity from phenotypic mean performances values could usually be carried out using univariate and multivariate statistical methods.
In Ethiopia, several studies have been carried out using morphological and biochemical traits to investigate sugarcane phenotypic diversity. The characterization and phenotypic diversity of various sugarcane genotypes in Ethiopia have been studied using quantitative morphological and biochemical traits (Abdul et al. Citation2017; Tena et al. Citation2018), biochemical traits (Tena et al. Citation2016b), and qualitative morphological traits (Abdul et al. Citation2017; Tena et al. Citation2018). However, phenotypic diversity is influenced by the study population, test environment and their combination. Among the 81 sugarcane genotypes evaluated, 77 of them (95%) were F1 generations germinated from hybrid seeds, which were introduced in 2014 from Barbados, were not evaluated elsewhere, and their performances were unknown. Therefore, this study was intended to select sugarcane genotypes with superior yield and yield attributing traits, identify the most divergent genotypes, and traits contributing the most to the diversity that could be used for selection and hybridization.
Materials and methods
Test environment
The study was conducted at Metahara and Tana-Beles sugarcane plantations of Ethiopia during May, 2021 to November, 2023. Metahara is situated in the Fantale Woreda of the Oromia Regional Government State, Eastern Shewa Zone, 210 km from Addis Ababa and 10 km south of Metahara town. Its coordinates are 8°51’N and 39°52’E, and its elevation is 950 m.a.s.l. With a mean annual rainfall of 554 mm and minimum and maximum annual temperatures of 17.5°C and 32.6°C, respectively, the area has a semi-arid climate. Tana Beles is located in the Amhara regional state, 650 km from the capital city, Addis Ababa, and 225 km from Bahir Dar town. With an elevation of 1110 m.a.s.l., Tana-Beles is located at 11°30 latitude and 36°41 longitude. The area receives a mean annual rainfall of 1447 mm, with mean maximum and minimum temperatures of 32.5°C and 16.4°C, respectively. The two study locations are 850 km apart.
Plant materials, experimental design and management
The study consisted of 81 sugarcane genotypes. With the exception of four genotypes, two Ethiopian (Tafach ageda and Kay shenkora), one South African (NCo-334) and one standard check variety from Barbados (B52–298), all of the remaining (77 of the 81) were genotypes germinated from hybrid seeds introduced from Barbados. The experiment was arranged in a partially balanced lattice design with two replications. The spacing between adjacent plots, incomplete blocks and border spacing were 1.5 m, 2.9 m and 5 m, respectively. The size of each plot was 21.75 m2 (three furrows of 5 m in length with 1.45 m in width). The planting materials were 7-month-old cane cut into three bud setts with an end-to-end planting pattern. The experiment was carried out on the light (Cambisol) soil types of the sugarcane plantation fields. Agronomic management practices recommended at the estate were used throughout the growth period.
Data collection
The study made use of the USDA-ARS’ (GRIN Citation2004) descriptors for quantitative agro-morphological and biochemical parameters for Saccharum species. Sixteen quantitative traits, including 11 agro-morphological and 5 biochemical traits, were collected at the appropriate plant growth stages.
Agro-morphological traits
For each genotype, data on the number of sprouted buds at 45 days after planting (SPN45), number of tillers at three (TL3MAP), four (TL4MAP) and five (TL5MAP) months after planting, number of millable stalks (NMS), stalk length (SL) (m), stalk diameter (SD) (cm), single cane weight (SCW) (kg), number of internodes per stalk (NI), internode length (IL) (cm) and cane yield (CYTPH) (t ha−1) at 18 months after planting (at harvest) were collected. For the number of sprouted buds, number of tillers, and number of millable stalks, leaving the two border rows as border effect, data were taken from the middle row, and calculated on a plot basis. Data for SL, SD, SCW, NI, IL and CYTPH were taken from 10 randomly tagged middle plants from the middle row. Data for CYTPH were calculated from [(Cane yield per plot/Net Plot Area) × 10,000 m2] where cane yield per plot is computed as a product of SCW and NMS per plot [Average SCW × NMS per plot].
Biochemical traits
Data for brix percent (Brix), pol percent (Pol) and purity percent (Purity) in juice were measured from the composite juice of 10 cane stalk samples at harvest. Brix (total soluble solids content in juice): At Metahara and Tana-Beles Research Stations, the juice was extracted using a Jeffco cane crusher. Then, the method outlined by Meade and Chen (Citation1977) was used to determine the Brix in juice. A 150 ml sample of the extracted composite juice was taken, and it was filtered using Whatman No. 91 filter paper and filter aid (kieselghur). The Brix was then calculated using the juice filter (clear juice) and a precision refractometer set at 20°C, which provides a direct reading of the refractometric dry substance (Brix) from the refraction angle in juice. The refractometer reading is equivalent to the Brix of the juice.
Pol percent (Pol): The concentration of pol in juice was determined using Horne’s dry lead acetate method described by Meade and Chen (Citation1977). The composite juice sample at 300 ml was mixed with lead acetate (1 g/100 mL) before being allowed to flocculate for around 30 s. The flocculated sample is filtered via filter paper from which 200-ml clear juice was polarized at 20°C in order to obtain the pol reading using a precision polarimeter. Then, the Polarimeter reading was multiplied by the corresponding Brix and Pol readings values from Table.
Purity percent in juice (Purity): Purity in juice was derived from ratio of Pol to Brix. Recoverable sucrose percent (RS) was estimated based on the Winter Carp formula described by Hundito (Citation2010) for the indirect method of cane juice analysis. Thus, RS = [Pol - ((Brix – Pol) × (0.7)) × 0.75]. Where 0.75 represents the correction factor between theoretical yields of molasses mixed juice as established by milling test, and 0.7 represents the quantity of sucrose lost in the final processing. Then, sugar yield (SYTPH) data were computed from the product of CYTPH (t ha−1) and RS (%).
Statistical data analysis
Analysis of variance
The acquired data were checked for conformity with the ANOVA assumptions for each site prior to doing a univariate and multivariate analysis. Then, the homogeneity of error variance for each trait was then tested prior to the combined analysis of variance using the F-max approach of Hartley (Citation1950), which is based on the ratio of the larger mean square error (MSE) from the separate analysis of variance to the smaller MSE. The test results confirmed that the ratio of larger MSE to smaller MSE value for all studied traits was less than three, indicating the homogeneity of environmental variance, suggesting the possibility to carry out combined analysis of data sets from the two locations. Thus, an analysis of variance was performed using the combined over location data using the partial balanced incomplete block design procedure of R statistical software version 4.2.3, 2023 (RStudio Core Team Citation2023).
The statistical model used for the analysis of variance (ANOVA) was Yijk = µ + gi + ej + bk (j) + (ge) ij + Eijk, where Yijk is the response variable measured for the kth replicate at the jth location for the ith genotype, µ represents the overall mean effect, gi is the effect of genotype i, ej is the effect of the jth location, bk(j) is the effect of kth block in jth replication, (ge) ij is the interaction of the ith genotype within the jth location, and Eijk is the random error. Tukey’s multiple range test (HSD) at a probability threshold of 1% was used to analyze how location, replication, block within replication, genotype and genotype by location interaction effect the average performances of the test material’s phenotypic variables.
Welch’s t-test
To evaluate the average performance of local landraces against introduced sugarcane genotypes, as well as the mean of the test population with the mean of the top 5% selected sugarcane genotypes, a two-sample t-test, also known as student’s t-test, was conducted. This test accounts for uneven variance and unequal sample size (Welch Citation1947).
Principal component and cluster analysis
Prior to principal component analysis (PCA) and cluster analysis (CA), the means of the agro-morphological and biochemical variables were standardized using the scale function in R programming language to a mean of zero and variance of one in order to prevent variations resulting from differences in data measurement units. The standardized data were then used to compute PCA and CA using FactoMineR, version 2.7 and Factoextra version 1.0.7 packages in R statistical software program version 4.2.3, 2023, following the procedure outlined by Kassambara (Citation2017).
The average linkage approach with the unweighted pair group method based on arithmetic average (UPGMA) was used in cluster analysis to do agglomerative hierarchical CA based on Euclidean distance. Estimates of genetic distance between genotypes were carried out based on the mean performance of phenotypic traits using the Euclidean distance as described by Gan et al. (Citation2007). Following the Euclidean distance matrix, agglomerative hierarchical CA was computed using the method described by Lance and Williams (Citation1967). Then, for each trait inside each cluster, intera- and intercluster distances as well as cluster means were computed using the ‘clv’ package version 0.3–2.2 of the R statistical software package.
Results and discussion
Agro-morphological and biochemical traits’ variability
Supplemental Table S1 presents the results of variability based on the analysis of variance, mean, range and range unit values for the pooled data from the two locations for 16 phenotypic traits of 81 sugarcane genotypes.
The test location, replication, block within replication, genotype and genotype by location interaction had a substantial effect on most of the studied traits, as demonstrated by their significant mean square values from the variance analysis. The effect of test location on TL5MAP, NMS and Brix was non-significant, indicating that these traits were little influenced by environmental factors or stable across test sites. This could imply that these characters could be used as suitable selection criteria in sugarcane variety improvement programmes. Likewise, all the remaining traits were under influence of environmental factors, as demonstrated by the very highly significant mean square values. The non-significant effect of test location on Brix was reported (Tena et al. Citation2016c, Citation2016b), which agrees with this result.
The effects of replication on IL and Purity, and the effects of blocks nested under replication on SPN45, TL5MAP, NI and SCW were non-significant. This indicates that these traits were less influenced by field variability and could reflect the variation due to difference in the genetic potential of the test materials. Likewise, the remaining traits varied significantly across replications and blocks nested under replication, implying these traits were highly influenced by field variability. Non-significant effects of replication on IL and Purity, and non-significant effects of blocks within replication on TL5MAP, NI and SCW were reported (Tolera et al. Citation2023b; Tena et al. Citation2016b, Citation2016c), which is concurrent with this finding.
In addition, the sugarcane genotypes exhibited substantial variation in all traits measured, as demonstrated by their very highly significant (p < 0.001) mean square values. This shows that there are enough differences among the clones in the trial for selection to be effective. Furthermore, the effects of genotype-by-location interaction on all the traits considered was very highly significant (p < 0.001). This indicates rank order change in the phenotypic performance of the evaluated sugarcane genotypes across test locations, implying that these materials could further be evaluated under different locations with diverse environmental conditions for the selection of potential and stable genotypes for commercialization and hybridization. Significant effects of genotype-by-location interaction on phenotypic traits in sugarcane were also reported (Tena et al. Citation2016b), which agrees with this result.
Mean performances of the sugarcane genotypes
Among the studied sugarcane genotypes, 38 and 37 of them had higher mean CYTPH and SYTPH performance values, respectively, over the mean of the population, while 60 and 62 of them were superior in CYTPH and SYTPH over the mean of the three standard check varieties, in that order (Supplemental Figure S1A and 1B). The superior mean performance values of the test materials over the means of the population and standard check varieties in CYTPH and SYTPH indicate their greater genetic potential for these traits that could be exploited to develop improved sugarcane varieties of these traits via selection and hybridization.
The mean comparison results of the test materials across test locations revealed that the performance of the test materials across location varied significantly for all the phenotypic traits evaluated (Supplemental Table S2). The very highly significant genotype-by-location interaction, as demonstrated by ANOVA, coupled with the substantial difference among the test materials across locations for studied traits elucidates a rank order change in genotypes’ performance across locations. This suggests that these materials could be evaluated over locations under diverse environmental conditions to select superior and stable genotypes for commercial release. It is also evident that the mean performance of the test materials were significantly greater at Metahara than at Tana-Beles, indicating that the environmental conditions of Metahara were more conducive for the phenotypic expression of these traits than that of the Tana-Beles.
Supplemental Table S3 presents the performance of the top 5% cane yielder and sugar yielder genotypes in comparison with the bottom 5% cane yielder and sugar yielder genotypes, the overall mean of the population, and the mean of the three standard check varieties.
The study findings elucidated that except for SPN45, NI and Brix, the top 5% cane yielder sugarcane genotypes had superior mean values over the means of the corresponding test population in all the studied traits. However, these genotypes were inferior to the corresponding means of the standard check varieties in all the studied traits, except for TL3MAP,TL4MAP,NMS,SL,IL,CYTPH and SYTPH.
Similarly, except for SPN45, the top 5% sugar yielder genotypes had superior mean values in all the studied traits to the corresponding means of the test population and had greater mean values than the comparable means of the standard check varieties in all the studied traits, except for SPN45, TL3MAP, SD, SCW and Purity. The superior mean performance values of the top 5% cane yielder and sugar yielder sugarcane genotypes for the particular traits over their corresponding means of the standard check varieties indicate that these genotypes could be important sources of variations for the traits that could be exploited.
Supplemental Table S4 presents the mean performances of 16 phenotypic traits for the top 5% cane yielder and sugar yielder genotypes of sugarcane. The sugarcane genotypes B694–11, B658–10, B707–1 and B572–1, respectively, were the first, second, third,and fourth best cane yielders, which exhibited the highest mean values for TL3MAP, TL4MAP and IL; TL5MAP and NMS; Brix, Pol, Purity, and RS; and SL, in that order. Whereas the sugarcane genotypes B552–11, B549–10, B658–10 and B572–1, respectively, ranked first, second, third and fourth as sugar yielders, and had the highest mean values for SD, SCW, Brix, Pol, and RS; NI and Purity; TL5MAP and NMS; and SL, in that order. Additionally, the genotype B658–10 ranked as the fourth best for sugar yielder and second-top cane yielder, while the genotype B572–1 was the fourth best for SYTPH and CYTPH. Generally, in addition to their greater potential for CYTPH and SYTPH, the superior mean performance values of these sugarcane genotypes for the other traits indicate their greater genetic potential for the particular traits that could be exploited.
Supplemental Table S5 presents the percent advantage of the top 5% cane yielder and sugar yielder sugarcane genotypes over the means of the test population and the three standard check varieties. The findings revealed that in terms of SPN45, TL3MAP, TL4MAP, TL5MAP and NMS, the best 5% sugarcane genotypes of these traits were superior to their respective means of the study population by 68.57–77.03%, 33.0–45.20%, 37.73–74.48%, 39.39–72.12% and 33.14–62.74%, respectively, and to the corresponding means of the standard check varieties by 59.21–84.55%, 21.31–32.44%, 17.97–49.44%, 19.46–47.51% and 2.07–24.76%, in that order.
In addition, in terms of NI, IL, SL, SD, SCW and CYTPH, the top 5% sugarcane genotypes outperformed their corresponding means of the test population by 21.40–32.0%, 16.22–27.93%, 25.73–44.19%, 15.12–22.09%, 25.60–36.0% and 36.24–41.98%, respectively, and to their comparable mean values of the standard check varieties by 21.40–32.0%, 27.72–40.59%, 42.59–63.53%, 3.13–9.38%, 11.35–20.57% and 13.64–18.42%, in that order. Furthermore, in terms of Brix, Pol, Purity, RS and SYTPH, the best 5% selected sugarcane genotypes were superior to the corresponding means of the study population by 6.54–10.54%, 8.98–13.18%, 4.02–6.27%, 11.79–15.09% and 41.94–56.33%, respectively, and to the respective means of the standard checks by 6.65–10.65%, 7.21–11.35%, 2.14–4.35%, 8.65–11.86% and 19.48–31.59%, in that order.
Generally, the study elucidated that the top 5% sugarcane genotypes had a greater advantage over the mean performances of the population and the standard check varieties in all traits studied that could be exploited to develop improved sugarcane varieties with superior phenotypic traits through the selection of the best genotypes of these traits. In addition, the greater SYTPH advantage of the best 5% sugar yielder genotypes over the mean SYTPH value of the standard check varieties indicates their greater potential for SYTPH that could be tested over seasons for commercial use at both study location to increase sugar production.
The phenotypic traits mean performance values of the selected subsets of the best 5% sugarcane genotypes were significantly greater than their comparable mean values of the study population in all considered traits, as demonstrated by the t-test (Supplemental Table S6)
The best 5% cane yielder sugarcane genotypes, namely, B694–11, B658–10, B707–1 and B572–1, had 36.24–41.98% and 13.64–18.42% more CYTPH than the means of the test population and standard check varieties, respectively, and advanced the CYTPH trait by 38.59% over the mean of the population. With 11.79–15.09% and 8.65–11.86% more RS than the means of the population and standard check varieties, respectively, the best 5% sugarcane genotypes for RS, namely, B552–11, B498–9, B552–21 and B564–1, advanced RS by 13.27% over the mean of the base population. The best sugar yielder genotypes, B552–11, B549–10, B658–10 and B572–1, showed 41.94–56.33% and 19.48–31.59% more SYTPH than the mean SYTPH of the population and standard check varieties, respectively, and advanced the SYTPH trait by 48.37% as compared to the mean SYTPH of the population. The greater mean values of these sugarcane genotypes for the respective traits indicate their greater genetic potential for the particular traits and suggest using them as potential parents for hybridization. In addition, the best sugar yielder genotypes could be evaluated over seasons for commercial use at the two test locations.
Principal component analysis
Principal component analysis (PCA), the most commonly used multivariate statistical analysis method, is used usually to estimate the genetic relationship between test materials, association among traits and identify the traits most responsible for the diversity. It offers guidance on selecting appropriate parental lines for hybridization and provides information on the specific traits that should be prioritized for selection and hybridization. Studies by several researchers have used PCA to achieve these goals (Jombart et al. Citation2010; Tena et al. Citation2016b). With this perspective, PCA was performed using standardized data of 16 phenotypic traits.
The first four principle component axes with Eigen values larger than 1.21 explained 87.10% of the total agro-morphological diversity in the test materials (Supplemental Table S7 and ). In contrast to this study, Sally and Eltson (Citation2021) found five principal components accounting for 83.56% of the total variation in sugarcane.
Among the agro-morphological traits evaluated, exception NI, IL and SD, all showed significantly contributing factor loadings on PC1 axis. Notably, CYTPH displayed the highest (0.86) contributing factor loading, suggesting that selecting the best cane yielder sugarcane genotypes from the test materials clustered along PC1 axis would lead to the development of improved sugarcane varieties with higher cane yield. Tena et al. (Citation2016b) also identified CYTPH and NMS as significant contributors to the diversity among sugarcane genotypes grouped along PC1 axis, which aligns with this study.
PC2 (20.80%), PC3 (16.23%) and PC4 (10.97%) axes captured different levels of diversity. The remaining PCs (<1 eigenvalue) accounted for the minor variation (12.9%). Sally and Eltson (Citation2021) found 20.09%, while Tena et al. (Citation2016b) discovered 16.06% of the total variation in PC2 axis in sugarcane, which aligns with this result. PC2 axis distinguished the sugarcane genotypes on the basis of SD, SCW, IL, SPN45, SL and NMS, while PC3 axis clustered the test genotypes based on SL, SCW, SPN45, IL, NI and TL5MAP. However, significant contributing factor loadings on PC4 axis come only from NI and IL.
Generally, in PCA, a trait with a higher contributing factor loading values of an absolute magnitude close to one indicates that the trait is the major contributor to the overall diversity of the test materials. Therefore, the traits with higher contributing factor loadings could be given greater emphasis to target the materials for selection (De Lacky and Cooper Citation1990). Therefore, SD (−0.90), CYTPH (0.86) and NI (−0.85) exhibited great influence on the overall agro-morphological trait diversity of the test materials and could be targets of selection breeding.
PCA loading plots based on agro-morphological traits is presented in Supplemental Figure S2. The traits: TL3MAP, TL4MAP, TL5MAP, NMS, NI and IL were clustered closely with each other and with CYTPH. This indicates that these pairs of traits are positively associated, as demonstrated by the acute angles between them, suggesting improvement in these traits leads to CYTPH improvement and there by SYTPH enhancement. The shortest arrows for NI and IL indicate their little contribution to the diversity of the genotypes grouped along PC1 axis. Conversely, the longer arrows for CYTPH and NMS; and SD and SCW, respectively, along PC1 and PC2 axes, indicate the contribution of these traits to the diversity of the genotypes clustered along the respective PC axes was relatively larger. Similar findings strong positive association between TL3MAP, TL4MAP, TL5MAP, NMS and CYTPH and their greater contribution to the agro-morphological diversity of sugarcane genotypes grouped along PC1 axis were reported earlier (Tolera et al. Citation2023a).
PCA based on biochemical traits showed that only the first PC had an Eigen value greater than one (Supplemental Table S8). PC1 axis alone explained 72.3% of the total biochemical variations. RS had the highest contributing factor loading and was the major contributor to the variability of genotypes grouped along PC1 axis. This implies selection of genotypes with higher mean values of RS from the genotypes clustered along PC1 could lead to the development of sugarcane varieties with higher RS and thereby SYTPH. In addition, the biochemical traits: Brix, Pol, Purity and RS had a strong positive association with each other and SYTPH, as demonstrated by their acute angles from PCA loading plot (Supplemental Figure S3). This indicates that improvement in one or more of them leads to enhancement of the other. Similar findings were reported in sugarcane (Tolera et al. Citation2023a).
PCA based on all studied traits revealed that the first five PCA axes with significant Eigen values (≥1.0) explained 84.71% of the total phenotypic diversity ( and ). Ittah and Obok (Citation2019) and Tena et al. (Citation2016b) found six PCs with 99.91% and 79.26% of the total variations, respectively, which differed from the current study result. PC1 axis explained 31.4% of the total phenotypic variation. The traits SYTPH, CYTPH, TL3MAP, NMS, TL4MAP, SCW, TL5MAP, SL, RS, Pol, Brix, Purity and NI had notable contributions to the variability among genotypes grouped along PC1 axis, as demonstrated by their significant contributing factor loadings. Similarly, Tena et al. (Citation2016b) also reported NMS, CYTPH and SYTPH as major contributors to the variations of sugarcane genotypes grouped along PC1 axis.
Figure 1. Principal component biplot of 81 sugarcane genotypes based on 16 phenotypic traits data pooled over two locations.
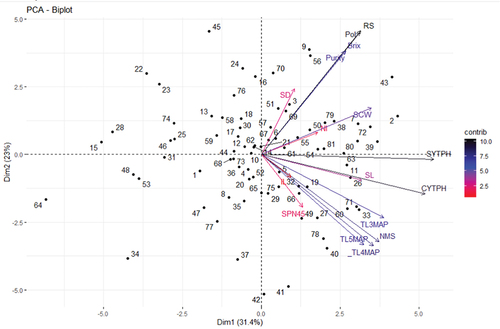
Table 1. Eigen values and vectors and extent of variation for pooled data of all considered phenotypic traits of 81 sugarcane genotypes evaluated at Metahara and Tana-Beles during 2021–2023.
With significant factor loadings from RS, Pol, Brix, Purity, SD, SPN45, TL3MAP, NMS, TL5MAP and TL4MAP, PC2 axis explained 23.0% of the total phenotypic diversity among the test materials. Similar results were also reported for SCW, SD, Brix, Pol, Purity and RS by Tena et al. (Citation2016b). With significant factor loadings from IL, SPN45.SL and SCW, PC3 axis accounted for 13.23% of the total variation, while PC4 explained 7.61% of the total variation and exhibited significant contributing factor loadings from SCW, SL, TL5MAP, Brix and IL. PC5 axis was responsible for 7.61% of the overall variations, and showed high contributing factor loadings from NI and IL.
Generally, SYTPH, CYTPH and RS stood out with higher contributing factor loadings, indicating their significant influence on the diversity observed. Therefore, by selecting the best sugarcane genotypes that exhibit higher mean values for SYTPH, CYTPH and RS, it is possible to develop improved sugarcane varieties of these traits. Ittah and Obok (Citation2019) found the highest contributing factor loading from CYTPH and Brix, which partly agrees with the current study result. Furthermore, PCA loading plot revealed that all studied traits were closely clustered to each other and with SYTPH, as demonstrated by the smaller acute angle between them, indicating improvement in either of them leads to enhance SYTPH.
Cluster analysis and its implication for selection and hybridization
The Dendrogram from multivariate hierarchical cluster analysis based on unweighted pair group with arithmetic mean (UPGMA) using Euclidean distance and average linkage method clustering technique from 11 agro-morphological traits of 81 sugarcane genotypes evaluated over two locations is presented in (Supplemental Figure S4). Results revealed that the entire sugarcane genotypes were grouped into four distinct clusters. Cluster I had the largest number of genotypes (60), while clusters II, III and IV consisted of only 18, 1 and 2 genotypes, respectively. Among the 60 genotypes of cluster I, two of them (Kay shenkora, a newly released standard check variety designated by 2, and Tafach shenkora designated by 1) are landraces from Ethiopia, while one was the standard check variety NCo-334 designated by 81 obtained from South Africa. Likewise, the remaining 57 sugarcane genotypes were all from Barbados.
The grouping of the sugarcane genotypes from different geographical locations into the same cluster demonstrates their close similarity in their agro-morphological traits. The similarity in agro-morphological features due to genetic resemblance among the sugarcane genotypes obtained from various nations may be due to shared parentage in their ancestry. Similar findings in sugarcane were reported by numerous researchers (Tena et al. Citation2016b; Karpagam and Alarmelu Citation2017; Sumbele et al. Citation2021) using phenotypic diversity as an indirect measure of genetic diversity. Disparity between geographical diversity and molecular genetic diversity in sugarcane was reported (Tena et al. Citation2014; Tazeb et al. Citation2017), which support the current study.
Except for the standard check variety B52–298, designated by 25, 17 of the 18 sugarcane genotypes of cluster II were F1 hybrids. The genotype B519–1, designated by 22, was the only member of cluster III. The autonomous cluster formation of this genotype indicates its distinctive agro-morphological traits. The genotypes B549–11 and B549–30, represented by the numbers 40 and 42, respectively, made up cluster IV and were both from Barbados.
Intercluster distance analysis based on agro-morphological traits revealed that the intercluster distance values ranged from 4.26 to 5.38 units (Supplemental Table S9). The highest distance value was found between clusters II and III, followed by between I and II (4.94), III and IV (4.85), II and IV (4.59), and I and IV (4.50), while the lowest was between clusters I and III. The highest intercluster distance value between the genotypes of the two clusters (II and III) indicates the presence of highly contrasting and complementary agro-morphological traits between the genotypes of the two clusters. This implies that the use of divergent genotypes from the two distant clusters could lead to the development of new sugarcane varieties with superior agro-morphological traits.
However, the lowest intercluster distance values between clusters I and III indicate the existence of close genetic similarity between the sugarcane genotypes of the two pairing clusters, as a result of limited agro-morphological traits’ variation among the genotypes of the two clusters. This suggests that hybridization between the genotypes of these clusters is not advisable.
The results of cluster mean analysis-based pooled data of 11 agro-morphological traits of 81 sugarcane genotypes tested over two locations are presented in (Supplemental Table S10). Among the four clusters, the sugarcane genotypes grouped in cluster I had the largest SPN45, followed by cluster IV and cluster III, while the lowest was recorded for the sugarcane genotypes of cluster II. Based on these findings, it appears that the sugarcane genotypes of cluster I possess exceptional capabilities for sprouting. This implies that selection of sugarcane genotypes with superior mean values for sprout from cluster I genotypes could lead to the development of genotypes with further enhanced sprouting potential.
The genotype B519–1, which is designated by 22 formed cluster III, had the second highest mean values for TL3MAP,TL4MAP, TL5MAP, NMS, NI, IL, SL and CYTPH; this indicates the superior genetic potential of this genotype for these traits and suggests its importance as potential parent for hybridization to further improve these traits. The two sugarcane genotypes, B549–11 and B549–30, which formed cluster IV, exhibited the highest mean values for SD and SCW, while the sugarcane genotypes of cluster II had the lowest mean values for these traits. The highest mean values of the sugarcane genotypes of cluster IV for these traits indicate the superior genetic potential of these genotypes that could be exploited to improve these traits through hybridization.
Results of dendrogram, intra- and intercluster Euclidean distances, and cluster means based on five biochemical traits of 81 sugarcane genotypes evaluated over two locations are presented in Supplemental Figure S5, Supplemental Table S1 and Table 12, respectively. Based on their biochemical compositions, the entire sugarcane genotypes were grouped into four clusters. Cluster I consisted of 33 sugarcane genotypes. Except the genotype Tafach Ageda, an Ethiopian landrace designated by 1, all of the sugarcane genotypes were from Barbados. Two standard check varieties, NCo-334 from South Africa designated by 81, and Kay Shenkora, an Ethiopian landrace designated by 1, along with 40 sugarcane genotypes from Barbados, were grouped in cluster II. The clustering together of these sugarcane genotypes from different source countries indicate their close biochemical trait similarity, suggesting to avoid crossing between the genotypes of the two clusters.
Cluster III comprised five Barbados genotypes. The fourth cluster consisted of only one sugarcane genotype, namely, B552–11, designated by 43. The separate cluster formation of the sugarcane genotype B552–11 indicates its distinct biochemical composition from the remaining 80 sugarcane genotypes evaluated. Generally, the study elucidated that biochemical diversity has weak association with geographical diversity. Tai and Miller (Citation2001) discovered 11 clusters of 147 sugarcane genotypes based on their biochemical composition, while Ekpelikpeze et al. (Citation2016) categorized 42 sugarcane genotypes into three groups, which differed from the current findings. This could be due to variation in the test materials and or environment.
The intercluster distance values based on five biochemical traits namely, Brix, Pol, Purity, RS and SYTPH ranged from 2.44 to 8.82 units. The largest intercluster distance value was between cluster III and IV, followed by between cluster II and III, clusters I and IV, cluster II and IV and cluster I and III, while the lowest was between clusters I and II. The greater distance value between clusters III and IV indicates the presence of higher biochemical traits differentiation between the genotypes of the two pairing clusters and hence substantial phenotypic divergence between them. This implies that crossing between the sugarcane genotype of the two clusters could result in development of sugarcane genotypes with superior biochemical traits.
The results of cluster mean analysis revealed that the sugarcane genotypes grouped in cluster II had the highest mean values for all the biochemical traits, followed by cluster I and III, while the lowest was observed for the sugarcane genotypes of cluster IV. The greatest biochemical traits’ mean values for the sugarcane genotypes of cluster II indicates their greater potential for the traits that could be exploited.
Cluster analysis results based on standardized data of all the phenotypic traits revealed that the 81 sugarcane genotypes were grouped into seven clusters (Figure S2). In contrast to the current findings, Bakshi and Hemaprabha (Citation2022) classified 153 sugarcane genotypes into five clusters, while Tena et al. (Citation2016b) categorized 400 sugarcane genotypes into 20 clusters. The disparity in the level of phenotypic diversity could be due to the variations in the test populations, environment and their interaction.
Cluster I contained a total of 42 sugarcane genotypes; among these, except for three sugarcane genotypes (two Ethiopian landraces: Tafach ageda and Kay shenkora designated by 1 and 2, respectively, and the South African genotype NCo-334 designated by 81), 39 of the 42 genotypes were all from Barbados. Cluster II comprised of 21 sugarcane genotypes, all of which were originated from Barbados. Similarly, cluster III, IV, V, VI, and VII, respectively, comprised of seven, one, six, three and one sugarcane genotypes of Barbados origin.
Cluster IV and VII were singletons, consisting of only one sugarcane genotype. The sugarcane genotype B519–1 designated by 22 formed cluster IV, while genotype B572–11 designated by 64 formed cluster VII. The separate clustering of genotypes B519–1 and B572–11 indicates their distinct agro-morphological and biochemical traits arising from their genetic divergence from the rest of the test materials.
The intercluster Euclidean distance values ranged from 2.83 to 10.12 (). The wide ranges of distance values indicates the existence of greater agro-morphological and biochemical traits diversity among the test materials. Ftwi et al. (Citation2016) found an intercluster Euclidean distance value ranging from 2.83 to 8.98, which concurs with the current study. Cluster V and VII had the largest distance value, followed by clusters IV and V, IV and VI, I and VI, VI and VII and II and VII, while the lowest was between clusters I and II, followed by I and V. The largest Euclidean distance value between the clusters V and VII indicates the presence of high genetic divergence between the genotypes of the pairs of clusters. On the other hand, clusters I and II had the shortest intercluster Euclidean distance values. This indicates that the existence little phenotypic divergence between the genotypes of two clusters.
Figure 2. Dendrogram using hierarchical cluster analysis based on UPGMA clustering method from the Euclidean distance matrix following the average linkage method for 81 sugarcane genotypes pooled data of 11 agro-morphological and 5 biochemical traits.
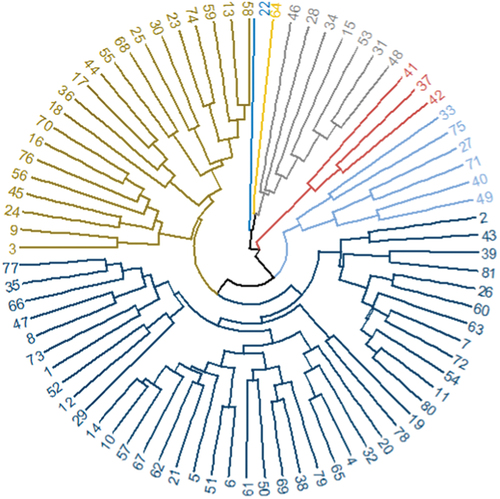
Table 2. Average intra (diagonal) and inter (off-diagonal) cluster distance (Euclidean) among seven clusters of 81 sugarcane genotypes grown under two locations’ pooled data of 16 phenotypic traits.
As demonstrated by cluster mean analysis (), cluster I genotypes had the highest mean values for NI, SD, SCW, CYTPH, Pol, Purity, RS, and SYTPH. Similarly, cluster II, IV (B519–1), V, and VI genotypes exhibited highest mean values for SPN45; NI, and IL; TL5MAP and MSN; and Brix, respectively. In addition, cluster V genotypes had moderate Brix, Pol, Purity, and RS values, thus ranking second in SYTPH.
Table 3. Cluster means for 16 phenotypic traits of 81 sugarcane genotypes evaluated over two locations.
Furthermore, cluster VI genotypes had the second-highest mean values for Pol, Purity, and RS, but exhibited the second-lowest mean value for SYTPH due to their least mean values in CYTPH and NMS. However, cluster VII genotypes had moderate mean values for all traits, while cluster III genotypes had the lowest means for SPN45, TL3MAP, SCW, and SYTPH. The higher mean values of cluster I genotypes for the traits indicate their superior potential for traits with high general combining ability (GCA). This potential can be exploited through selection of the genotypes with higher mean values of the traits from the genotypes of cluster I and hybridization with genotypes from a different cluster with the lowest mean values of the respective traits to develop improved sugarcane varieties specifically focused on those traits. Conversely, genotypes with lower cluster mean values demonstrate lower performance potential and, therefore, might hold limited value for GCA targeted improvement through selection breeding methods. Variations in cluster mean values based on phenotypic traits provide valuable insights into phenotypic performance potential, breeding strategy, and program success within the field of sugarcane improvement (Yang et al. Citation2018; Menéndez et al. Citation2019).
Conclusions and recommendations
Phenotypic diversity caused by genetic variation is basic requirement to develop sugarcane varieties with desirable economic traits via selection and hybridization. The study revealed the existence of marked phenotypic variations among the test materials, between replications, locations, blocks within replications and genotype by location interactions for most of the studied traits, as demonstrated by their significant mean square values. PCA based on agro-morphological and biochemical attributes and combined, the first four, one, and five PCs explained 87.10%, 72.30%, and 84.71% of the total variations, respectively. Based on agro-morphological and biochemical parameters and combined, CA divided the 81 sugarcane genotypes into four, four, and seven distinct groups, respectively, with intercluster distance values ranging from 4.26 to 5.38, 2.44 to 8.82, and 2.83 to 10.12, in that order. Clusters II and III, III and IV, and V and VII exhibited the highest intercluster distance values based on the analysis of agro-morphological and biochemical traits and combined, respectively. The greatest intercluster distance value between these clusters indicates that the genotypes of the two clusters have a higher degree of phenotypic divergence as a result of their highly complementing and contrasting traits, and could be used as potential parents for hybridization to produce heterosis. The sugarcane genotype B519–1 from cluster III had the highest mean number of NMS, NI, IL, and CYTPH, while the genotypes B549–11 and B549–30 exhibited the highest SD and SCW as demonstrated by cluster mean analysis based on agro-morphological traits. Sugarcane genotypes of cluster II had the highest mean values for all the studied biochemical variables, while genotypes of cluster I exhibited the highest cluster mean values for most of the agro-morphological and biochemical traits. This indicates the superior phenotypic performance potential of the sugarcane genotypes for the traits. This suggests that the best genotypes of these traits could be selected and used as potential donors for hybridization. Generally, the study identified genotypes with superior agro-morphological and biochemical mean performances, divergent parents and major contributing traits to the diversity of genotypes that could be exploited. Moreover, while analysis of plant cane data offers valuable insights into genotype performance, a comprehensive evaluation across ratoon crops remains essential for robust conclusions. Thus, the selected genotypes could be evaluated over seasons and locations for further selection of superior and stable genotypes for commercial use at Metahara and Tana-Beles.
Supplemental Material
Download PDF (536 KB)Acknowledgements
The authors gratefully acknowledge the institutional collaboration program between the Norwegian University of Life Sciences and Hawassa University for providing financial support, and the Metahara and Tana-Beles Research Centres for their material and technical support.
Disclosure statement
No potential conflict of interest was reported by the author(s).
Data availability statement
The dataset collected and analyzed on the course of the present study are available from the corresponding author on reasonable request.
Supplementary Material
Supplemental data for this article can be accessed online at https://doi.org/10.1080/03650340.2024.2344484
Additional information
Funding
References
- Abdul QK, Kiya AT, Berhanu LR. 2017. A study on morphological characters of introduced sugarcane varieties (Saccharum spp. hybrid) in Ethiopia. Int J Plant Breed Genet. 11(1):1–12. doi: 10.3923/ijpbg.2017.1.12.
- Augstburger F, Berger J, Censkowsky U, Heid P, Milz J, Streit C. 2001. Organic farming in the tropics and subtropics.Exemplary descriptions of 20 crops. Sugarcane. https://www.naturland.de/images/01_naturland/_en/Documents/Technical_Information/Cultivation_guidelines/sugarcane_CD_f.pdf
- Ayele N, Tana T, Heerden PDRV, W/Tsadik K, Alemayehu Y, Merah O. 2021. Ripening response of sugarcane varieties to chemical ripeners and economic benefits during the early period of harvesting at Wonji-Shoa and Metahara sugarcane Plantations, Central Rift Valley of Ethiopia. Int J Agron. 2021:1–9. doi: 10.1155/2021/6645913.
- Bakshi B, Hemaprabha G. 2022. Genetic divergence of sugar yield and its components in flowering type Saccharum officinarum clones. Agric Sci Digest. 25(2):118–120.
- Berding ND, Hogarth M, Cox MC. 2004. Plant improvement of sugarcane. In: Glyn J., editor. Sugarcane. Oxford, U.K: Blackwell Science; p. 20–53.
- Birru E. 2016. Sugarcane industry overview and energy efficieny considerations, literature survey document. KTH School of Industrial Engineering and Management, p. 4–61. SE–100 44 Stockholm.
- Blume H. 1985. Smallholders. Geography of Sugar Cane. Berlin: Verlag Dr. Albert Bartens; p. 230–236.
- Breaux RD. 1984. Breeding to enhance sucrose content of sugarcane varieties in Louisiana. Field Crops Res. 9:59–67. doi: 10.1016/0378-4290(84)90006-6.
- Chen Z, Qin C, Wang M. 2019. Ethylene-mediated improvement in sucrose accumulation in ripening sugarcane involves increased sink strength. BMC Plant Biol. 19:1–17. doi: 10.1186/s12870-019-1882-z.
- Cock JH. 2001. Sugarcane growth and development. Int Sugar J. 105:5–15.
- Cox MC, Hansen PB. 1995. Productivity trends in southern and central regions and the impact of new varieties. In Proceedings of the Australian Society of Sugar Cane Technologists 17; Bundaberg, Australia. p. 1–7.
- Cursi DE, Hoffmann H, Barbosa GVS, Bressiani JA, Gazaffi R, Chapola RG, Fernandes Junior AR, Balsalobre TWA, Diniz CA, Santos JM, et al. 2022. History and current status of sugarcane breeding, germplasm development and molecular genetics in brazil. Sugar Tech. 24(1):112–133. doi: 10.1007/s12355-021-00951-1.
- De Lacky IH, Cooper M. 1990. Pattern analysis for the analysis of regional variety trials. In: Kang M., editor. Genotype-by-environment interaction and plant breeding. Baton Rouge: Louisiana State University; p. 301–334.
- Dengia A, Dechassa N, Wogi L, Amsalu B. 2023. Analysis of declining trends in sugarcane yield at Wonji-Shoa Sugar Estate, Central Ethiopia. Life Sci Biomed Exp Results. 4(e13):1–19. doi: 10.1017/exp.2023.13.
- Ekpelikpeze OS, Dansi A, Agbangla C, Akoegninou A, Sanni A. 2016. Biochemical characterization of sugarcane varieties cultivated in Benin. Int J Curr Microbiol Appl Sci. 5(2):368–379. doi: 10.20546/ijcmas.2016.502.042.
- Embassy of Federal Democratic Republic of Ethiopia. 2014. Investment opportunity in sugar cane plantation in Ethiopia. New Delhi, India. http://www.ethiopianembassy.org.in/investment/Opportunity%20in%20Sugar%20Cane%20Plantation%202014.pdf.
- Ftwi M, Mekbib F, Abraha E. 2016. Multivariate analysis of sugar yield contributing traits in Sugarcane (Saccharum officinarum.L), in Ethiopia. Afr J Plant Sci. 10(8):145–156. doi: 10.5897/AJPS2016.1419.
- Gan G, Ma C, Wu J. 2007. Data clustering theory, algorithms, and applications. ASA SIAM series on Statistics and Applied Probability, Philadelphia.
- Govindaraj M, Vetriventhan M, Srinivasan M. 2015. Importance of genetic diversity assessment in crop plants and its recent advances: an overview of its analytical perspectives. Genet Res Int. 2015:1–14. doi: 10.1155/2015/431487.
- GRIN, 2004. The Germplasm Resources Information Network (GRIN). http://www.ars-grin.gov.
- Hartley HO. 1950. The maximum F-ratio as a short-cut test for heterogeneity of variance. Biometrika. 37(3/4):308–312. doi: 10.1093/biomet/37.3-4.308.
- Hasan M, Abdullah HM. 2015. Plant genetic resources and indigenous knowledge: an emerging needs for conservation. In: Salgotra R.K., and Gupta B.B., editors. Plant Genetic Resources and Traditional Knowledge for Food Security. Berlin/Heidelberg, Germany: Springer; p. 105–120.
- Heaton EA, Frank GD, Stephen PL. 2008. Meeting US biofuel goals with less land: The Potential of Miscanthus. Global Change Biol. 14(9):2000–2014. doi: 10.1111/j.1365-2486.2008.01662.x.
- Hoban S, Campbell CD, da Silva JM, Ekblom R, Funk WC, Garner BA, Godoy JA, Kershaw F, MacDonald AJ, Mergeay J. 2021. Genetic diversity is considered important but interpreted narrowly in country reports to the Convention on biological diversity: current actions and indicators are insufficient. Biol Conserv. 261:109233. doi: 10.1016/j.biocon.2021.109233.
- Hogarth DM. 1976. New varieties lift sugar production. Producers Rev. 66(10):21–22.
- Hughes AR, Inouye BD, Johnson MTJ, Underwood N. 2008. Vellend M. Ecological consequences of genetic diversity. Ecol Lett. 11:609–623. doi: 10.1111/j.1461-0248.2008.01179.x.
- Hundito K. 2010. Handbook of laboratory methods and chemical control for Ethiopian Sugar factories. Ethiopia: Ethiopian Sugar Development Agency Research Directorate.
- Ittah MA, Obok EE. 2019. Breeding potential and multivariate analyses of morphological and yield traits in industrial sugarcane (Saccharum officinarum L.) accessions in a humid tropical agroecology. Int J Plant Soil Sci. 27(5):1–10. doi: 10.9734/IJPSS/2019/v27i530087.
- Jackson PA. 2005a. Breeding for improved sugar content in sugarcane. Field Crops Res. 92(2–3):277–290. doi: 10.1016/j.fcr.2005.01.024.
- Jackson PA. 2005b. Progress and prospects in genetic improvement in sucrose accumulation. Field Crops Res. 92(2–3):277–290. doi: 10.1016/j.fcr.2005.01.024.
- Jombart T, Devillard S, Balloux F. 2010. Discriminant analysis of principal components: a new method for the analysis of genetically structured populations. BMC Genet. 94(1):1–15. doi: 10.1186/1471-2156-11-94.
- Kandel A, Yang X, Song J, Wang J. 2018. Potentials, challenges, and genetic and genomic resources for sugarcane biomass improvement. Front Plant Sci. 9(151):1–14. doi: 10.3389/fpls.2018.00151.
- Karpagam E, Alarmelu S. 2017. Morphological characterization and genetic diversity analysis of interspecific hybrids of sugarcane. Ind J Gen Plnt Bree. 77(4):531–539. doi: 10.5958/0975-6906.2017.00070.0.
- Kassambara A. 2017. Practical guide to principal component methods in R, multivariate analysis II. First ed. Sthda; p. 1–125. https://www.google.com/search?q=http%3A%3Awww.sthda.com&rlz=1C1GCEB_enIN1096IN1096&oq=http%3A%3Awww.sthda.com&gs_lcrp=EgZjaHJvbWUqBggAEEUYOzIGCAAQRRg70gEHNzgzajBqN6gCCLACAQ&sourceid=chrome&ie=UTF-8&safe=active.
- Kebede S, Ambachew D, Firehun G. 2013. Trends of sugar industry development in Ethiopia: challenges and prospects. Ethiopian Science Academy; 2013 Apr; Adiss Ababa, Ethiopoia.
- Lance GN, Williams WT. 1967. A general theory of classificatory sorting strategies II. Clustering Syst Comput J. 10(3):271–277. doi: 10.1093/comjnl/10.3.271.
- Meade GP, Chen JCP. 1977. Cane Sugar Handbook. New York: John Wiley and Sons.
- Menéndez CM, Roca VM, Arencibia A, González R. 2019. Assessment of genetic diversity in sugarcane (Saccharum spp.) germplasm using cluster and principal component analysis. Sugarcane Int. 37(1):1–12. doi: 10.18814/SCIENTI.V37I1.1.
- Mondini L, Noorani A, Pagnotta MA. 2009. Assessing plant genetic diversity by molecular tools. Diversity. 1:19–35. doi: 10.3390/d1010019.
- Plucknett DL, Smith NJH. 1986. Sustaining agricultural yields. BioScience. 36(1):40–45. doi: 10.2307/1309796.
- Racedo J, Gutiérrez L, Francisca Perera M, Ostengo S, Mariano Pardo E, Inés Cuenya M, Welin B, Pedro Castagnaro A. 2016. Genome-wide association mapping of quantitative traits in a breeding population of sugarcane. BMC Plant Biol. 6(142):1–16. doi: 10.1186/s12870-016-0829-x.
- Raffard A, Santoul F, Cucherousset J, Blanchet S. 2019. The community and ecosystem consequences of intraspecific diversity: a meta-analysis. Biol Rev. 94:648–661. doi: 10.1111/brv.12472.
- Rezene F. (2009). The status of biofuels in Ethiopia: opportunities and challenges. In IUCN Regional Workshop on Bio-fuel Production and Invasive Species; 2009 Apr 20–22; Nairobi, Kenya.
- RStudio Core Team, Boston, RStudio, 2023. Integrated development for R. RStudio, 2023. PBC, MA. http://www.rstudio.com/.
- Salgotra RK, Chauhan BS. 2023. Genetic diversity, conservation, and utilization of plant genetic resources. Genes. 14(174):1–20. doi: 10.3390/genes14010174.
- Sally S, Eltson A. 2021. Characterization of sugarcane germplasm collection. Afr J Agric Res. 17(2):273–282. doi: 10.5897/AJAR2020.14799.
- Seema Y, Phillip J, Wei XM, Elizabeth MR, Karen A, Emily D, Felicity A, Ben JH, Kai PV. 2020. Accelerating genetic gain in sugarcane breeding using genomic selection. Agronomy. 585(7):1–21. doi: 10.3390/plants11162139.
- Semie TK, Thapat S, Shabbir HG. 2019. The impact of sugarcane production on biodiversity related to land use change in Ethiopia. Global Ecol Conserv. 18(2019):1–10. doi: 10.1016/j.gecco.2019.e00650.
- Simmonds NW. 1979. Principles of crop improvement. London: Longman Group Limited.
- Sumbele SA, Fonkeng E, Akongte P, Ndille NC, Henry A. 2021. Characterization of sugarcane germplasm collection and its potential utilization for evaluation of quantitative traits. Afr J Agric Res. 17(2):273–282. doi: 10.5897/AJAR2020.14799.
- Swarup S, Cargill EJ, Crosby K, Flagel L, Kniskern J, Glenn KC. 2021. Genetic diversity is indispensable for plant breeding to improve crops. Crop Sci. 16(2):1–14. doi: 10.1002/csc2.20377.
- Tai PYP, Miller JD. 2001. A core collection for Saccharum spontaneum L. from the world collection of sugarcane. Crop Sci. 41(3):879–885. doi: 10.2135/cropsci2001.413879x.
- Tazeb A, Haileselassie T, Tesfaye K. 2017. Molecular characterization of introduced sugarcane genotypes in Ethiopia using inters simple sequence repeat (ISSR) molecular markers. Afr J Biotechnol. 16(10):434–449. doi: 10.5897/AJB2016.
- Tena E, Mekbib F, Ayana A. 2014. Analysis of genetic diversity and population structure among exotic sugarcane (Saccharum Spp.) cultivars in Ethiopia using simple sequence repeat molecular markers. Afr J Biotechnol. doi: 10.1058/AJB2014.13849.
- Tena E, Mekbib F, Ayana A. 2016a. Correlation and path coefficient analyses in sugarcane genotypes of Ethiopia. Am J Plant Sci. 7(10):1490–1497. 710141. doi: 10.4236/ajps.2016.710141.
- Tena E, Mekbib F, Ayana A. 2016b. Genetic diversity of quantitative traits of sugarcane genotypes in Ethiopia. Am J Plant Sci. 7:1498–1520. doi: 10.4236/ajps.2016.710142.
- Tena E, Mekbib F, Ayana A. 2016c. Heritability and correlation among sugarcane (Saccharum spp.) yield and some agronomic and sugar quality traits in Ethiopia. AJPS. 7(10):1453–1477. doi: 10.4236/ajps.2016.710139.
- Tena E, Mekbib F, Ayana A. 2018. Sugarcane landraces of Ethiopia: Germplasm collection and analysis of regional diversity and distribution. Adv Agric. 2018:1–18. doi: 10.1155/2018/7920724.
- Tesfaye W. 2021. Long term sugarcane cultivation effect on selected physical and hydraulic properties of soils at three Ethiopian Sugarcane Estates. Adv Crop Sci Technol. 9(8):1–7. ajpb. 20210603.14. doi:10.1164/8j.
- Tolera B, Gedebo A, Tena E. 2023a. Genetic diversity of sugarcane (Saccharum spp.) genotypes based on agro-morphological and biochemical traits. Cogent Food & Agriculture. 9(1):1–27. doi: 10.1080/23311932.2023.2254141.
- Tolera B, Gedebo A, Tena E. 2023b. Variability, heritability and genetic advance in sugarcane (Saccharum spp. hybrid) genotypes. Cogent Food & Agriculture. 9(1):1–16. doi: 10.1080/23311932.2023.2194482.
- USDA (2023). Sugar: world markets and trade. United States Department of Agriculture Foreign Agricultural Service [accessed 2024 Apr 5]. https://gain.fas.usda.gov/Pages/Default.aspx.
- Verma I, Roopendra K, Sharma A, Chandra A, Kamal A. 2019. Expression analysis of genes associated with sucrose accumulation and its effect on source–sink relationship in high sucrose accumulating early maturing sugarcane variety. Physiol Mol Biol Plants. 25(1):207–220. doi: 10.1007/s12298-018-0627-z.
- Waclawovsky AJ, Sato PMS, Lembke CG, Moore PH, Souza GM. 2010. Sugarcane for bioenergy production: An assessment of yield and regulation of sucrose content. Plant Biotechnology Journal. 8(3):263–276. doi: 10.1111/j.1467-7652.2009.00491.x.
- Wang J, Nayak S, Koch K, Ming R. 2013. Carbon partitioning in sugarcane (Saccharum species). Front Plant Sci Section Plant Biotechnol. 4:1–18. doi: 10.3389/fpls.2013.00201.
- Welch BL. 1947. The generalization of Student’s problem when several different population variances are involved. Biometrika. 34(1–2):28–35. doi: 10.1093/biomet/34.1-2.28.
- Yang L, Li L, Xu C, Li J, Li X. 2018. Genetic diversity analysis of sugarcane germplasm using cluster and principal component analysis. J Genet. 97(1):189–196.
- Yang X, Luo Z, Todd J, Sood S, Wang J. 2020. Genome-wide association study of multiple yield traits in a diversity panel of polyploid sugarcane (Saccharum spp.). Plant Genome. 13(1):1–16. doi: 10.1002/tpg2.20006.