
 ?Mathematical formulae have been encoded as MathML and are displayed in this HTML version using MathJax in order to improve their display. Uncheck the box to turn MathJax off. This feature requires Javascript. Click on a formula to zoom.
ABSTRACT
Background and Context
Feedback on one’s progress is essential to new programming language learners, particularly in out-of-classroom settings. Though many study materials offer assessment mechanisms, most do not examine the accuracy of the feedback they deliver, nor give evidence on its validity.
Objective
We investigate the potential use of a preexisting set of C code snippets as the basis for a high-quality C programming ability assessment tool.
Method
We utilize the Rasch Model and the Linear Logistic Test Model to evaluate the validity and accuracy of the code snippets and to determine which C operations contribute most to their overall difficulty.
Findings
Our results show that these code snippets yield accurate assessments of programming ability and reveal the degree of difficulty associated with specific programming operations.
Implications
Our results suggest that the code snippets could serve as the basis for sophisticated, valid, and fair code comprehension skill assessment tools.
1. Introduction
With the increasing complexity of software codebases and the emergence of interconnected devices to handle everyday tasks, the demand for proficient programmers has steadily grown. The U.S. Bureau of Labor Statistics reported that, between 2020 and 2030, the demand for programmers will grow by 22%, substantially higher than the average growth rate of 8% for other job categories (Bureau of Labor Statistics, U.S. Department of Labor, Citation2022). Keeping up with this demand is challenging, largely because of the difficulty of mastering programming languages.
Though there is currently no shortage of books, education platforms, and videos that can teach almost any programming language, many may not provide sufficient repetition to help learners internalize new concepts. More importantly, these resources often lack a way to give accurate and reliable feedback so students can judge if they are making progress. In a classroom setting, test taking can provide such feedback, and can enhance learning performance and achievement (McDaniel & Fisher, Citation1991; Vollmeyer & Rheinberg, Citation2005). A novice developer can also find online tools and resources to test acquired skills (see, e.g. Brusilovsky & Sosnovsky, Citation2005; Dancik & Kumar, Citation2003; Lobb & Harlow, Citation2016). The question is how accurate are the assessments these resources provide, and how representative are the results? To date, little work has been done to verify the validity of these educational tools (i.e. whether they actually measure the targeted ability) and the reliability of the generated measures in terms of accuracy.
In this paper, we evaluate an existing set of student test performance data, originally collected as responses to a series of C code snippets (Gopstein et al., Citation2017), to judge the set’s ability to yield fair, valid, and accurate measurements of student performance. Employing Item Response Theory (IRT) – specifically the Rasch Model and the Linear Logistic Test Model – we assessed two different groups of student responses to these snippets. We also were able to pinpoint the components within the code that contribute to the overall difficulty of the snippets.
Our initial results not only suggest that the snippet set could be used to measure programmers’ C skills, but can also provide insights into which C operations are most difficult for novice programmers to comprehend. With the insights from this work, we envision an ability to design adaptive tools for programming languages that can automatically adjust to advanced programming topics as students demonstrate their mastery of previous concepts. These snippets could help more accurately assess a student’s comprehension of programming topics in a way that existing performance-based tools cannot.
2. Background and related work
In designing our study, we reviewed previous work in code comprehension theories and approaches, and strategies for measuring latent abilities. In this section we identify and summarize these approaches and offer some background on the dataset of C code snippets used in the analysis.
2.1. Code comprehension studies
Program comprehension, or code comprehension, is a broad topic that has been studied from an extensive number of perspectives. Some of these studies look at factors within the code itself, while others look towards identifying programmer perceptions when engaging with a piece of code.
In the former category are studies like Hofmeister et al. (Citation2019), who looked at the effect of different identifier naming styles (single letters, abbreviations, and words) on program comprehension. Hofmeister et al. (Citation2019) asked 72 professional C# developers to locate defects in source code snippets. They found that code is more difficult to comprehend when identifier names contain only letters and abbreviations, as opposed to words. Bauer et al. (Citation2019) updated an earlier study on whether different levels of indentation in code played a role in developer comprehension. Buse and Weimer’s work Buse and Weimer’s work (Buse & Weimer, Citation2008) studied local code features of small program snippets.
A few of the specific code patterns investigated by Gopstein et al. (Citation2017) were also the subject of earlier investigations. Elshoff and Marcotty’s (Citation1982) work introduced the idea of clarifying transformations to improve the readability of source code. Dolado et al. (Citation2003) tested whether code that contained side-effects was more likely to cause subjects to misinterpret its function.
In the latter category of work that focused more on developer perceptions, there are studies like Duran et al. (Citation2018), that proposed assessing the complexity of a program from a learning point of view. Using a number of short programs as case studies, the authors applied this approach as a way to illustrate why one program or construct is perceived as more complex than another. Tashtoush et al. (Citation2013) also designed a model of software readability by asking programmers questions about what features they found confusing. Jones (Citation2006) looked for a correlation between developers’ knowledge of relative binary operator precedence and the amount of actual experience they have had handling the respective binary operator pair.
Lastly, several of these studies provide a rationale for the importance of developing code comprehension skills. Izu et al. (Citation2019) observed that “Novice programmers should develop program comprehension skills as they learn to code so that they are able both to read and reason about code created by others, and to reflect on their code when writing, debugging or extending it”. Towards this end, Izu’s study collects and defines learning activities that explicitly address key components of program comprehension. On a more practical note, improving code comprehension skills can reduce the amount of time software developers must spend on this task. Feitelson (Citation2023) cited two different studies (Minelli et al., Citation2015; Xia et al., Citation2018) that found, on average, developers spend between 58% and 70% of their time on code comprehension activities. Thus, a better understanding of code could free programmers to spend more time and resources on other tasks.
2.2. Assessment tools
Novice learners can choose from a number of web-based auto-gradable assessment tools. Dancik and Kumar’s web-based C++ tutor (Dancik & Kumar, Citation2003) even allows users to specify the preferred level of explanations about the correct answer (no feedback, correct/incorrect feedback, or detailed explanations about the correct answer). Other tools, such as those in Lister et al. (Citation2004) use a multiple choice format or ask participants to fill a blank in the code assignment with the correct statement. A limitation of these tools is that, unlike similar instruments used for personality tests (e.g. DeYoung et al., Citation2007) and intelligence tests (e.g. Cooper & Petrides, Citation2010), many programming skill tests do not examine the quality of the measurements they generate. However, several exemplary approaches do exist (see Margulieux et al. (Citation2019) for a comprehensive review of validated instruments in Computing Education Research). For example, FCS1 (Tew & Guzdial, Citation2011) and SCS1 (Bockmon et al., Citation2019; Parker et al., Citation2016) are multi-lingual validated instruments for content knowledge assessment. In addition, results generated by Bergersen et al. (Citation2014) instrument for measuring Java programming skills, and Herman et al. (Citation2014) evaluation of the digital logic concept inventory were both extensively evaluated. Yet, many other tools implicitly assume that their measurements are reliable and fair, but use no formal mechanisms to test these assumptions. Measurement models, such as the ones defined in Section 2.3, enable researchers to examine whether crucial assumptions about the measurement process are met. If the assumptions are valid, researchers can trust that the measurements generated are accurate (Molenaar, Citation1995b, p. 11f).
2.3. Measuring abilities: item response theory
Assessing a student’s ability at solving any particular task is difficult because human personality traits and abilities cannot be measured or observed directly. Instead, these latent or hidden constructs can only be inferred through human behavior. Generally, a student’s progress is measured by performance on tests. The higher the score a student receives, the higher we assume their capabilities in that subject. During performance testing, we also infer that solving harder itemsFootnote1 requires a higher level of ability than solving easier items. Yet, even the most capable students might make mistakes, for example, if they read the problem incorrectly. Conversely, students with limited abilities might get a few difficult items correct by making lucky guesses. Therefore, a student’s test performance does not reflect their actual latent ability perfectly. There likely will be some statistical noise in their results.
One method to deal with “noise” when measuring constructs like ability is Item Response Theory (IRT; Ayala, Citation2022; De Boeck & Wilson, Citation2004; van der Linden, Citation2016). IRT assumes the correctness of a test taker’s response to an item is probabilistic rather than deterministic. Given a test item with a specific difficulty, a student with a higher latent ability should be more likely to solve it correctly than a student with a lower latent ability in the respective subject. By modeling the response process as probabilistic, we naturally take into account the existence of “noise” in the answers. Conversely, we expect that answers from students with a specific latent programming ability are more likely to be correct for easy items than for difficult items. Therefore, the probability to correctly answer an item depends on both item difficulty and a student’s abilities. In the following, we introduce two IRT models used in our study, the Rasch Model and Linear Logistic Test Model.
2.3.1. Rasch Model
In our study, we used two IRT models to evaluate responses to a dataset of C code snippets, described in more detail below. The first is the Rasch Model (RM), which allows for estimation of both latent abilities and item difficulties based on a set of binary data , i.e. correctness/incorrectness of subjects’ answers on items (Molenaar, Citation1995b; Rasch, Citation1960). In the RM, the probability that a person
(
) with a latent ability
(e.g. programming skill) gives a correct response to item
(
, e.g. coding task) with a difficulty of
is defined as:
Researchers can obtain estimates for both subjects’ ability parameters () and the item difficulty parameters (
) (Mair & Hatzinger, Citation2007a; Molenaar, Citation1995a) by using Maximum Likelihood Estimation, a common statistical estimation method. However, the RM is based on a series of assumptions, such as:
Local stochastic independence, i.e. the probability that a person can solve an item correctly does not depend on whether this person solved another item correctly;
Measurement invariance between subgroups. This means for each subgroup of persons (e.g. grouped by sex or nationality), the items measure the construct equally, i.e. “fairness” in the measurement;
Equal discriminatory power of all items, i.e. all items measure the respective ability with equal precision;
Unidimensionality, or all items measure the same latent ability, i.e. comprehending C code.
Validating these assumptions requires several likelihood-ratio tests (LRT; Andersen, Citation1973) with different split criteria, such as by sex, lower/higher ability group, or nationality. For any given item set, all of the model’s assumptions would need to be met for the model to hold (Fischer, Citation1995a). Should the RM be deemed valid for an instrument, one can derive several valuable properties. First, the unweighted sum test scores of a group of participants are sufficient estimates to judge their abilities (Fischer, Citation1995a, p. 17); that is, it is statistically admissible to interpret a person’s total sum score as representative of their ability level. Second, ability parameter estimates are metrically scaled instead of being ordered categorical or nominal values. Therefore they can be treated as metric values in further analyses. Third, item scores given by the participants are sufficient estimates to judge an item’s difficulty level, and the instrument measures fairly so no subgroups of participants are being discriminated against. Finally, the measure is specifically objective, which means that no matter the subset of items a person was given during a test, the ability estimate is still valid (Fischer, Citation1995a, p. 27ff).
The specific objectivity of RM also allows for adaptive testing (van der Linden & Glas, Citation2010). In adaptive testing procedures, test takers start off with an item of moderate difficulty and, depending on the correctness of their answer, the following item will be either easier or harder. By always adapting the item difficulty of the subsequent item based on one’s ability demonstrated in previous items, test takers will only be confronted with items suiting their ability levels (van der Linden & Glas, Citation2010). This is in contrast to conventional procedures in which test takers have to answer a multitude of items, including many that will either be too easy or too hard. This under- or overload in conventional procedures can lead to fatigue or annoyance in test takers. In contrast, adaptive testing can counteract these issues and result in more accurate assessments.
2.3.2. Linear logistic test model
To take a closer look at which operations make an item difficult, we used a second IRT model called the Linear Logistic Test Model (LLTM; Fischer, Citation1995b; Scheiblechner, Citation1971, Citation1972). In essence, the LLTM is an RM that confines itself to estimating only the difficulty parameters of reoccurring item properties. For any given item, such as the code snippets examined in this study, LLTM models its estimated level of difficulty as a result of the individually challenging properties (i.e. “subtasks”) that must be completed. Our work refers to these individual properties as basic components. For example, if a math equation involves an addition and a multiplication, the entire equation is an item, and addition and multiplication are its basic components. However, these two distinct operations may differ in their levels of difficulty (for an extensive example, see Anderson et al., Citation2022). Using LLTM, we can identify which components make an item difficult to solve. As this decomposition of item properties entails additional explanatory power, the model is discussed as an item explanatory IRT model (De Boeck & Wilson, Citation2004).
Using LLTM, item ’s difficulty parameters
in an RM are decomposed into a number of basic components
(
) that each adds a degree
to item
’s difficulty
. In LLTM, the RM-formula given in (1) is employed with the following substitution:
Identifying basic components in LLTM occurs a priori through a theory-based or rational investigation of the items. As illustrated in our previous example of a math equation, researchers need to go through all items and identify what operations are present. The basic components constituting each item are then summarized in a matrix containing weights
, where
is the number of items and
is the number of basic components across all items. Typically, the value of
is 1 or 0, indicating whether or not a specific component
is present in item
.
Since an LLTM is an RM with additional restrictions, the validity of the underlying RM needs to be examined first. As noted by De Boeck and Wilson (Citation2004, p. 62), the item difficulty parameters retrieved by an LLTM will not perfectly equal the difficulty parameters estimated by the RM. Therefore, we need to test statistically if the LLTM parameters (depicting our “explanation”,
, for the item difficulties) describe the respective dataset equally well as the RM parameters. The restrictions imposed by LLTM can be tested using likelihood-ratio tests (LRTs) and graphically inspected by plotting the models’ parameters against each other (Fischer, Citation1995b, p. 147).
2.4. C code snippets: atoms of confusion
The C code snippets used in this work had previously served as the dataset in a series of studies designed to identify elements in code that can cause programmers to misjudge outputs (Gopstein et al., Citation2017, Citation2018, Citation2020). Gopstein et al. (Citation2017) developed an item set of C code snippets, initially selected from the International Obfuscated C Code Contest, and therefore acknowledged as difficult to understand. The research team labeled them as “atoms of confusion” (or atoms for short), because they consisted of the smallest possible snippets of code (–
lines of code on average) capable of confusing a programmer about its output. For each of these atoms they created a transformed, non-confusing version. An example pair of confusing and non-confusing code snippets can be found in .
Figure 1. Example for a snippet pair that is supposed to be non-confusing (a) or confusing (b), depending on whether there is an assignment of a constant inside the while condition.
Gopstein et al. (Citation2017) conducted a study in which participants from the US hand evaluated the code snippets, and found most of the items considered confusing were indeed harder to answer correctly. Subsequently, Zhuang et al. (Citation2023) conducted the same experiment with a group of participants from China in order to investigate perception and performance differences between the American and the Chinese population.
In the original studies, the authors were primarily concerned with identifying types of confusing coding patterns. While these types mostly referred to one specific operation within the item that was expected to cause the confusion, the categories did not account for all the operations present in the respective code snippet. For example, to correctly answer the item posed in , subjects would need to have a mastery of the method of a while loop itself, the not (!) operator, and the while condition.Footnote2 In this study, we investigate the item set created by Gopstein et al. (Citation2017) from a more detailed perspective. As a result, we contribute novel insights by disentangling the operations in these C snippets that must be correctly completed for an accurate response.
The real-world presence of C patterns from the dataset ranges from very common to infrequent (Gopstein et al., Citation2018). Gopstein et al. (Citation2018) also stated that the ubiquitousness of these patterns within open source projects seems to be determined by their acceptance (or rejection) among developers within particular software engineering specializations. As to what the students were or were not taught prior to our testing, it would have been impossible to collect syllabi at the time of data collection since the tests were conducted at different sites and times. Yet, based on the experience of the authors from their own campuses, it is believed most of the patterns invoke programming language constructs that would be taught (operators, order of operations and executions, etc) in most CS1 and CS2 classes.
3. Research goals
In our study, we employ the Rasch Model to evaluate whether the code snippets from Gopstein et al. (Citation2017) could serve as a basis for a C skills assessment tool. If the RM holds, we can reasonably assume the beneficial properties outlined in Section 2.3.1 to be valid. Thus, we can assume that responses to the snippets can provide an adequate assessment of C programming skills.
Using RM to assess the quality of measurement and LLTM to examine different properties of the code snippets (e.g. logical operations or loops used in the snippet), we seek answers to the following questions:
Can we affirm the quality of the items in terms of how accurately they measure comprehension?
How difficult for novices are the various C operations in the snippets?
If our RM and LLTM analyses yield satisfying results, we can use these items for adaptive testing and automated test construction. Moreover, the results may provide insights for further improvement of the item pool, which we discuss in Section 7.
4. Instrument, dataset and study methods
4.1. Instrument and study sample
The instrument for this study utilizes the original “atoms of confusion” developed by Gopstein et al. (Citation2017). Half of the snippets are considered non-confusing to subjects while the second half are considered confusing (see for an example). Although the confusing snippets were derived from the International Obfuscated C Code Contest, a later study revealed that these code patterns were prevalent in actual open source projects. “There are over 3.6 million atoms in 14 popular open source C/C++ projects and 4.38% of lines have an atom” (Gopstein et al., Citation2018, p. 1). Considering this high prevalence of confusing atoms in real world projects, and that 50% of the snippets in the item set are also transformed/non-confusing, we hypothesize the items are worth examining as a possible assessment tool. It should be noted though that 18 of the 71 code snippets we finally analyzed were designed to be answered with a true/false response. This type of item is not ideal for the IRT analysis we would conduct because it increases the chance of responses based on pure guessing. However, we decided to keep them in our dataset as the aim of our research is to analyze the current set of code snippets and its measurement properties as is.
Our study used two data samples, one from US participants ( participants; Gopstein et al., Citation2017) and one from Chinese participants (
participants; Zhuang et al., Citation2023). In the latter sample, our analysis excludes data from five subjects who did not report their amount of programming experience. We only considered items that met the following criteria:
They were exactly the same code snippets in both samples: In the original studies, subjects had only received a random subset (66%) of all the items in order to prevent fatigue. To ensure comparability, we only included snippets that completely matched in both samples.
They were shown to more than
of the subjects: Same as the reason above, the two datasets contain missing values. To avoid imprecision in estimation, we excluded items with too many missing values.
They did not result in all correct or all wrong answers across participants: When all participants got their answer right (or wrong) for an item, the estimation algorithm would have to calculate the logarithm of 0 (or divide by zero in case all answers are incorrect), which is undefined. Thus, one can not determine a valid difficulty estimate for these items.
The dataset analyzed in the current study therefore consisted of answers of subjects on 71 items. Demographically, the sample consisted of participants from the US (
) and from China (
). Of our 128 subjects,
were self-reported as male, and the rest self-reported as female. Subjects had an average experience with C programming of
(
) months and a median experience of
(
,
) months. At the time of the study,
of the participants were in Computer Science and Engineering bachelor’s degree programs. On average, subjects correctly answered
(
) of the atoms they were shown. There was a low correlation between months of experience in C programming and the accuracy rate with
,
.
4.2. Research methods
4.2.1. Decomposition into basic components
The first step in our study was to conduct an a priori decomposition of the C-code itemsFootnote3 (“atoms”) created by Gopstein et al. (Citation2017) to assess the basic components of each item. We acknowledge that there are several approaches to decomposing programming code, e.g. Soloway’s (Citation1986), Schulte’s Block Model (Schulte, Citation2008), or the model of hierarchical complexity (Commons et al., Citation1998; Duran et al., Citation2018). While these models offer a profound understanding of code complexity, they emphasize hierarchical structures of code operations and their dependencies and interactions. However, our study aimed to analyze the difficulty of underlying basic components. So, for this purpose, we followed the approach developed and used by Luxton-Reilly et al. (Citation2017), in which a group of experts analyzed already small pieces of code to see how they could be decomposed into even smaller tokens. They do so because they found that “seemingly straightforward questions can involve a relatively large number of tokens, and that misunderstanding any of these tokens can prevent students from answering the original question” (Luxton-Reilly et al., Citation2017, p. 62). As this conception is fully in line with the theoretical assumptions of LLTM, we decided to follow this principle.
Utilizing the approach of Luxton-Reilly et al. (Citation2017), we manually and sequentially went through all the code snippets with the following procedure. We started with a table listing each snippet in a row. Beginning with the first snippet, we identified which tokens (i.e. basic operational components) are present, added a column for each unique component, and marked the component in the column with a 1. We repeated this process for all the snippets (rows) in the table. Whenever a new component is identified that doesn’t fall within an existing column, we added a new one and placed a 1 in the cell accordingly. Iterating this process for all snippets several times to ensure the correctness of the matrix, we obtained our final table. It comprises the established item characteristics in a binary weight matrix, where indicates the presence of component
in item
, and
indicates its absence. Our a priori defined matrix consisted of
basic components occurring in the
items we used for our analysis, resulting in a
weight matrix. The matrix is available as supplementary material.Footnote4 The 26 basic operational components we identified are listed and described in .
Table 1. The 26 basic operational components we identified in the items and short descriptions of the challenges that arise from each of them. These components represent the columns of our weight matrix.
4.2.2. Analysis
We began by estimating an RM and looking for any potential violations of its assumptions. We tested the hypothesis that “the RM holds” through likelihood-ratio test (LRTs). If the RM does not hold, it indicates that one or several of the model’s assumptions, such as dependency between items, varying measurement precision of items, or unfairness of measurement across subgroups, have been violated (Fischer, Citation1995a). We then graphically inspected the distribution of item difficulties and ability parameters. Following that, we estimated an LLTM based on our weight matrix and compared the model against the RM using an LRT (Fischer, Citation1995b, p. 147). The correlations between RM parameters and LLTM parameters served as additional indicators of how well our LLTM (specifically our weight matrix) recovers the RM parameters and therefore serves as goodness-of-fit measures. We chose a level of for conducting significance tests. In order not to inflate alpha when testing multiple times, we corrected
to
, where
is the number of tests conducted at one time.
Both the RM and the LLTM are estimated using conditional maximum likelihood estimation (CML; Mair & Hatzinger, Citation2007a; Molenaar, Citation1995a; Scheiblechner, Citation1971). We used the statistical software R (R Core Team, Citation2021) to analyze the data, and the R package eRm (Extended Rasch Modelling; Mair & Hatzinger, Citation2007b; Mair et al., Citation2021) for further analysis of the estimated RM and LLTM. Any structural values that were missing because subjects did not see every single item were handled by having the eRm package compute separate parameters for each item subgroup with the same missing patterns. Estimates were then “aligned” using items that the subgroups have in common (Fischer & Ponocny, Citation1994; Mair & Hatzinger, Citation2007b).
5. Analyses results
Below we present the results of our two rounds of analysis. Section 5.1 describes how we tested the validity of our Rasch model, and what it revealed about participant abilities and the relative difficulty of the snippets. In Section 5.2, we enumerate what the LLTM model revealed about the snippet components, and compare the relative validity of the two models.
5.1. Rasch model analysis
5.1.1. Rasch model validity
To assess the RM’s validity, we conducted LRTs for the three different split criteria: (1) median person score (i.e. higher/lower ability group), (2) population (US vs. China), and (3) median programming experience (i.e. high/low experience group). The results are shown in . None of the LRTs showed significantly different parameter estimates for the investigated data subsets for the significance level where is corrected for
conducted tests. Therefore, the RM holds for this dataset.
Table 2. Results of the conducted LRTs for the split criteria of median of person score, population, and median of experience. The columns refer to the test statistic (LR), the degrees of freedom
, the critical
value for a corrected significance level
of the respective test distribution, as well as the associated
-value.
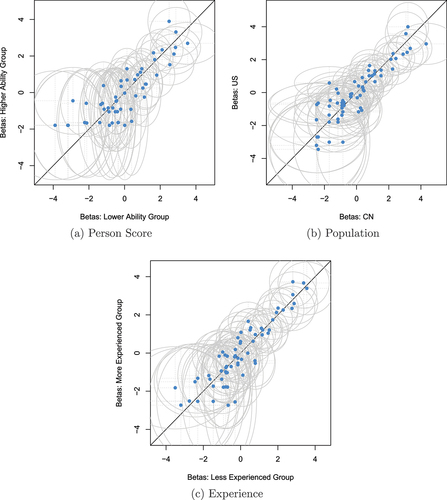
The item difficulty estimates for both subgroups in all three split criteria are depicted in , which was created using the GMX package (Alexandrowicz, Citation2022a, Citation2022b). This graphical model allows us to inspect item difficulties across subgroups. By relating each item’s difficulty in both subgroups, we gain insights as to whether the items are equally difficult in both groups. Item difficulty estimates lying on the 45° line are equally difficult for both groups in the comparison. In , all confidence ellipses, or two-dimensional confidence intervals overlap with the 45° diagonal line. This indicates that, statistically, the items are equally difficult for all subgroups and the code snippets do not discriminate against subgroups. Thus, a first analysis of our RM does not reveal violations of the model assumptions and we can retain the null hypothesis “The RM holds”.
Figure 2. Graphical model checks for the three LRTs. Each plot depicts item difficulty parameter estimates (“betas”) for the subgroups of each LRT (person score, population, and experience). Blue dots represent item difficulty estimates, grey ellipses represent the two-dimensional confidence intervals () associated with the item estimates.
5.1.2. Person and item parameters
The RM yielded well-balanced distributions of person and item parameters, as depicted in . The upper section shows the distribution of the subjects’ ability parameters, where larger values on the horizontal axis indicate higher C programming ability. Similarly, larger values on the horizontal axis of the lower section indicate the greater difficulty of an item. Note that the upper and lower sections of ’s horizontal axis are aligned at the same values. If a person has an ability parameter equal to the difficulty parameter of a specific item, said person has a 50% chance of mastering that item. Those with less ability have a lower chance of giving a correct answer, whereas those with higher ability have a significantly better chance of doing so.
Figure 3. Person-item map of our RM. The upper histogram reflects the distribution of our subjects’ ability parameters. The lower part of the figure depicts the item difficulty for every item in our dataset. The items are marked by horizontal ticks on the left and are ordered by difficulty (from easy items on top to difficult items on the bottom).
From , we can see that the distribution of item difficulty parameters and subject ability parameters cover slightly different ranges. Many items fall into the lower spectrum of item difficulty and, thus, are quite “easy items” for our sample. In , we find some items with a difficulty lower than . All persons in our sample have programming abilities clearly exceeding the ability required to solve these items. On the other hand, some subjects in our sample have very high programming abilities (e.g. subject ability parameters greater than
), but there are little to no items that fall within this spectrum. Although the snippets are indeed capable of assessing subject abilities outside their item difficulty range, measurement precision is higher for subjects within the overall range of item difficulties (Ayala, Citation2022, p. 31ff.). Thus, we find the item set to be rather easy for the present sample (who, on average, had more than one year of programming experience) and the distributions suggest that our item set would be even more suitable for subjects who are less experienced in C programming.
5.2. LLTM analysis
5.2.1. Component analysis
Based on our theoretically established, pre-specified weight matrix of item components, the LLTM estimation yielded the data shown in . These parameters indicate the amount of (latent) difficulty the respective basic component introduces to an item. Low/negative values for these parameters indicate that the respective component introduces little difficulty (i.e. easy operations), while high/positive values indicate more difficult operations. For example, consider the atom shown in (a). In this item, the components include condition equals zero, NOT operator and while-loop.Footnote5 Therefore, our predefined weight matrix contains only for these three operations, but
for all other operations. Substituting into (2), we multiply each basic component’s difficulty with its respective weight
(0 or 1) and summarize. As all the components not present in the atom become zero due to their weight, the atom’s difficulty is only the sum of the present components’ estimates (
). Thus, this code snippet would have an item difficulty of
. We can see that the components macro (
) and octal numerals (
) introduce the highest level of difficulty to the items. Conversely, the operations zero based numbering (
) and comma separator (
), and the concept of logical expression (
) added the least amount of difficulty.
Table 3. Estimates of parameters (basic components) of our LLTM, their standard errors (
), the respective 99% confidence interval, as well as the number of atoms containing the respective component (
).
5.2.2. Comparing RM with LLTM
Our last task was to compare the validity of our DM model with the LLTM model. Using an LRT, we found a significant difference between the two models with ,
, indicating that we cannot fully recover the RM item difficulty parameters with LLTM, as shown in . As already noted in Section 2.3 and through the work of De Boeck and Wilson (Citation2004) and Fischer (Citation1995b), this result is not surprising. Therefore, we pursued other means to further assess the usefulness and appropriateness of our LLTM.
Table 4. Model fit of the estimated RM and LLTM as well as results of a difference test for model comparison.
logLikelihood;
number of model parameters;
likelihood ratio, also denoting a
value;
the difference in degrees of freedom between the models.
An investigation of the correlation between RM item difficulty parameters and the retrieved item parameters in the LLTM revealed a coefficient of ,
between the two models, as shown in . This means that
of variance in our RM item parameters can be explained by the LLTM’s basic parameters
and our weight matrix. Thus, by only considering the different operations present in each item, we can explain a great amount of item difficulty. The relationship of subject ability parameters estimated by the two models yields a correlation of
,
. Hence, the subject ability parameters of the RM and the LLTM almost perfectly correspond with each other. This means we can obtain virtually the same ability estimates with both models.
Figure 4. Estimated RM item difficulty parameters plotted against the (mean-centered) item difficulty parameters reconstructed by LLTM’s estimated basic parameters. The 45° line indicates the hypothetical line the dots would be at if parameters were perfectly equal.
To validate our weight matrix, we used an approach proposed by Baghaei and Hohensinn (Citation2017), who suggested a validation method that follows the logic of parallel analysis (Horn, Citation1965). To obtain an estimate of the expected lower bound of correlation between LLTM item parameters and RM item parameters, we simulated weight matrices with the same dimensions as our matrix (
). For these matrices, we randomly chose each element of the matrix to be
or
, with the probability to be
equal to the overall proportion of
’s in our original matrix. Each simulated matrix was used to estimate an LLTM with our dataset, and for each we attained the (simulated) correlation
between original RM parameters and simulated LLTM parameters. Comparing our originally obtained correlation of
to the distribution of the correlations of the simulated matrices yielded a significant
-score of
,
. This provides evidence for the validity of our basic operational components: Our weight matrix that defines the “structure” of the operational components in the snippets fits the data better than the random weight matrices do (i.e. better than would be expected by chance). Thus, the structure we assume to underlie item difficulties is capable of capturing an underlying pattern.
Overall, we found our RM to be valid. Thus, the results do show that we can perceive the (unweighted) sum of correct items as a valid measure of programming ability. This makes the item set suitable for adaptive testing. Analysis of the LLTM revealed highly satisfactory recovery of the RM item and subject ability parameters, indicating that the mere consideration of operational code components yields valid results in terms of assessment. Although the comparison of the model fit of RM and LLTM was significantly in favor of RM, our additional LLTM analyses indicate its great practical relevance. The highly satisfactory correspondence of the models’ subject ability parameters indicate that automated test construction based on the LLTM’s operational components is viable, as LLTM and RM yield basically equal estimates of a person’s abilities.
6. Discussion
In the present study we (1) investigated the C code snippets’ measurement quality by means of analyzing their conformity with RM, and (2) conducted a first attempt to reveal the differences in the difficulty of operations in the C programming language. In the following section, we discuss the implications of the results presented in Section 5, answer the research questions in Section 3, and discuss our methodology and results in the context of other studies that have used IRT to evaluate assessment tools.
6.1. Evaluation of the code snippets’ measurement accuracy
To assess the measurement quality of the items, we deployed the RM and tested its validity. Analysis of the RM did not reveal violations of the model’s assumption and therefore the model is considered valid. This first investigation showed that the C code snippets tested seem to fulfill the requirements for accurate measurement. We also found evidence that the snippets used in the study would measure even more precisely in a sample set with lower programming abilities, as compared to our rather experienced sample set. While this evidence does not impair our results, it does indicate the value of the present item set in evaluating the comprehension levels of a less experienced target group, such as those just starting to program.
Comparing the LLTM to the RM, we found the RM fit the data significantly better than the LLTM. Although this indicates that our restricted model (LLTM) does not describe the data as well as the unrestricted model (RM), it was highly satisfactory in retrieving the original RM item parameters (, explaining
of variance) and our predefined weight matrix significantly outperformed random weight matrices. Additionally, we obtained virtually the same subject ability parameters comparing the RM with the LLTM (
), indicating that both models yield equivalent results regarding ability parameters. This is in line with previous research showing that despite differing LLTM and RM item difficulty parameters, subject ability parameter estimates are largely unaffected by this difference (Alexandrowicz, Citation2011). As the constraints imposed by LLTM are rather strict (Fischer, Citation1995b) and the LRT is known to be highly sensitive to the differences in model fit, researchers suggest focusing on the theoretical and practical relevance of the results instead of overrating its statistical significance (Alexandrowicz, Citation2011; Fischer & Formann, Citation1982).
Based on our initial results from both the RM and LLTM models, it appears the C code snippets we tested can be relied on to generate accurate measurements of student performance. This answers our first research question in Section 3. With some improvement, these items can be used for adaptive testing and automated test construction (Section 7).
6.2. Difficulty levels of C-Code operations
To estimate the difficulty of various C operations and answer the second research question in Section 3, we used the LLTM model, which exhibited differences in the amount of difficulty each operational component contributed to the snippets. We found that macros, octal numerals, and the comma operator are the most difficult components in our item set. Framed practically, this means that items containing these components will be much harder to solve than items containing components like logical expressions or post in-/decrement operations. While they did not investigate octal numerals separately, Gopstein et al. (Citation2018) found macros and comma operators to occur less frequently in real-life software projects compared to other operations (Gopstein et al., Citation2018). So, it is possible that subjects may simply be less familiar with these operations in comparison to the others identified as atoms. Or perhaps the opposite is true, and macros and comma operators are used less frequently in practice because these operations are hard to grasp. Lack of familiarity might also explain why we found pre in-/decrement operations to be more difficult to subjects than post in-/decrement operations, as the latter are more prevalent in practice (Gopstein et al., Citation2018).
The relationship between experience and program comprehension has been rather extensively addressed over the years, and suggests some insights for future exploration. McKeithen et al. (Citation1981) observed that experienced programmers are able to organize the keywords of a language by the similarity of their functions, e.g. for and while, which makes these properties easier to recall and apply. Shaft and Vessey (Citation1995) emphasized that experienced programmers have an edge over novices because they better understand the problem to which any given program is to be applied. However, Soloway and Ehrlich (Citation1984) caution that even these veteran programmers can lose their advantage if the coding conventions on which they rely are violated in a piece of code.
Experienced programmers are also more likely to be aware of code constructs that over time have been avoided by the programming community (Roehm et al., Citation2012), most notably goto statements (Marshall & Webber, Citation2000), and magic numbers (Kernighan & Pike, Citation1999). Through experience, programmers have also learned to avoid certain patterns that have been dubbed “code smells”, or, as Fowler defined them, “structures in the code that suggest […] the possibility of refactoring” (Fowler, Citation2018). Since there was only a minimal difference in the experience levels of the two groups in our study, an extensive survey of participants’ knowledge of C was not gathered. In future work, we will take these factors into account. Controlling for students’ prior knowledge and their familiarity with these concepts in future studies can help to shed light on this open question.
When it comes to logical operations, we found that the component logical expression, which refers to understanding the general concept of logical operations, was quite easy for our sample. However, the actual logical operators themselves (and, or, greater/less than, equal, not equal) were more difficult for the subjects to solve. One explanation could be that the evaluation of logical operations is error prone. For example, one could confuse the greater than () and greater than or equal to (
) operators. In the latter case the statement also evaluates to true if both numbers to be compared are equal. Confusing these operators could result in an “off-by-one-error” (Rigby et al., Citation2020). In that sense, the concept of logical operations might be easy to grasp, but the accurate execution of a statement takes a lot more effort. Another interesting finding is that indexing itself, including the fact that C uses zero based numbering, seems to be quite easy for subjects, but reversed subscripts are much more of a challenge. One reason for this difference might be that plain indexing is taught early in C education, whereas reversed subscripts are highly uncommon (Gopstein et al., Citation2018).
Lastly, though the code snippets investigated in this study are limited to C, most of the operations we analyzed, such as loops, if-else statements, or logical expressions, are also common in other programming languages. Analyzing multiple other programming languages in a manner similar to what we presented here might help to identify and address operations that are difficult across the board. On the other hand, if operations in other languages varied in perceived difficulty, this might yield additional insights into which syntax is the most intuitive and least error prone for a specific operation (e.g. the syntax of a for loop differs between Python and C). Thus, other research efforts focused on programming syntax comprehension (for example, Brun et al., Citation2023; Stefik & Siebert, Citation2013) could benefit from applying the approach we used in this study.
6.3. Integrating in context: IRT in Computer Science education research
Several researchers in the computer education research community have applied IRT to evaluate the measurement properties and the quality of assessment tools. For example, Bergersen et al. (Citation2014), Berges and Hubwieser (Citation2015) and Davidson et al. (Citation2021) evaluated psychometric properties of code writing exercises (programming performance, source code complexity, and a mix of code-tracing and writing tasks, respectively). Our study, however, focused only on code comprehension, so we examined other strategies specifically used to evaluate assessments for this property. These included FCS1 (Tew & Guzdial, Citation2011) and SCS1 (Parker et al., Citation2016), which were closely examined using IRT both at the time of publication and afterward (Duran et al., Citation2019; Xie et al., Citation2019). However, all of these analyses used either the two- or the three-parameter logistic model (2PL or 3PL; Birnbaum, Citation1968). These IRT models contain additional parameters (one “guessing parameter” per item, capturing the chance the subject guessed, and one “discrimination parameter” per item, capturing the capability of items to differentiate among participants). These options make this model less restrictive than the Rasch Model.
While they can provide great benefits and additional insight, these models also come with limitations. An individual’s total sum score is not a sufficient statistic for estimating a person’s ability due to the added guessing and discrimination parameters incorporated in these models. Furthermore, as the weighting parameters remove specific objectivity from the measure, Andersen’s Likelihood Ratio Test cannot be performed (Andersen, Citation1973; Glas & Verhelst, Citation1995). A re-validation of SCS1, however, used the Rasch Model to test the tool and found similar results to the original study (Bockmon et al., Citation2019). One notable difference between the analyses of FCS1/SCS1 and our study is the item difficulties: While all of the studies mentioned here (Duran et al., Citation2019; Parker et al., Citation2016; Tew & Guzdial, Citation2011; Xie et al., Citation2019) identified the instrument items as very difficult for students, the items in our study were rather easy for our subjects. This difference could possibly be attributed to the pseudocode/multi-lingual nature of FCS1 and SCS1 as compared to C language used for the item set we investigated. Finally, our study employed the additional LLTM to reveal differences in C operations’ difficulties. This model allows researchers to investigate snippets beyond their overall item difficulty and to learn about the varying difficulties of its distinct components.
7. Limitations and future directions
Although we are confident of the overall validity of our results, there are some limiting factors that need to be mentioned. First, the item set used was developed for a different purpose, i.e. to investigate the degree of confusion introduced by C code snippets (Gopstein et al., Citation2017). Therefore, some of the items contained unusual configurations of operations. Indeed, the original authors had chosen many of these snippets for their complex and ornate constructions. As such, the results may be less concrete than they would have been if we were working with more commonplace items. Also, there were some components in our analysis that only occurred in one single item, leading to larger standard errors and less reliable estimation. Another item feature that ran somewhat counter to our purposes is that some atoms, mostly those containing if-else statements, were designed to elicit a true or false answer. These types of items increase the chance of a subject successfully guessing the answer, so a correct answer by a subject does not necessarily reflect true ability. As this is a potential threat to the validity of our model, existing items that elicit only a true or false response should be reformulated. Logical expressions in items (e.g. printf(x < 5) that can only be true/false) should be replaced by an open answer format (e.g. printf(x) could take any value).
Second, our data contains missing values as noted above, because the original study did not present every item to all participants due to concerns about fatigue. Thus, we were not able to perform all possible RM model tests. Although the RM can be estimated regardless of missing values, and LRTs can be conducted, other tests such as the Martin-Löf test for different groups of items (Christensen et al., Citation2002) or the variety of non-parametric tests (Ponocny, Citation2001) currently cannot be conducted with established tools if values are missing (Mair et al., Citation2021). Even in light of the premises on which our analysis was based, we can still obtain valuable insights from our study.
Looking toward future iterations of our study, we recommend making several improvements to the test items as follows: 1) Generate new items that contain components currently underrepresented in the item set, such as macro operators, octal and hexadecimal numerals, or comma operators. This will enable us to more accurately assess difficulties caused by these components; 2) Adapt items to more systematically include a balanced number of components, i.e. items with one single component, as well as ones with two, three, and more in different combinations; 3) Ensure the items contain no missing values to enable the use of different model tests of the RM; and 4) Exclude or reformulate items that require only true or false answers.
If these aspects are taken into account, the development of a C assessment tool could be a highly promising goal for future research. Such a tool could accelerate mastery of C by offering reliable feedback to learners about their progress. Further, if the RM and LLTM hold for a larger and more complete dataset, these results can be used in adaptive testing applications where the difficulty of test items is tailored to the individual test taker’s ability. Testing tools designed in this manner can increase measurement accuracy while also increasing motivation for test takers (van der Linden & Glas, Citation2010), reducing exhaustion, boredom and frustration.
8. Conclusion
The analyzed item set of C code snippets originally created for the Atoms of Confusion project seems to be suitable as an assessment for C programming ability, especially for novice learners. Our tests showed the items measure programming skills precisely, and that the sum of solved items is a valid measure of C programming skills. We found evidence that these items can be applied in an adaptive testing setting, thus preventing test takers from becoming demotivated or exhausted. We identified macros, octal numerals, and comma operators as the C components that introduced the greatest amount of difficulty to items, whereas zero-based numbering, comma separators, and the concept of logical expressions added little difficulty. Additionally, these results could serve as a basis for automated test construction.
Acknowledgement
This work is supported in part by the University of Colorado Faculty Revitalization Fellowship Program and by the National Science Foundation under Award No. 1444827.
Disclosure statement
No potential conflict of interest was reported by the author(s).
Notes
1. In this paper, we use the terms “item” and “test questions” interchangeably, as the former term is commonly used in psychological measurement.
2. Although the code itself contains post in-/decrement operators, subjects do not inevitably need to master these operations to correctly answer the item, as the while loop is never entered in this example.
3. We want to clarify that we decomposed the items prior to statistical analysis, but after data sampling was complete. Thus, participants had no knowledge of the analysis criteria.
5. As already noted in Section 2.4, although the snippet actually contains post in-/decrement operators, these do not necessarily need to be mastered in order to get the item correct because the while loop is not entered in this example.
References
- Alexandrowicz, R. W. (2011). Statistical and practical significance of the likelihood ratio test of the linear logistic test model versus the Rasch model. Educational Research and Evaluation, 17(5), 335–350. 10.1080/13803611.2011.630522
- Alexandrowicz, R. W. (2022a). GMX: Extended graphical model checks. A versatile replacement of the plotGOF() function of eRm. Psychological Test and Assessment Modeling, 64(3), 215–225.
- Alexandrowicz, R. W. (2022b). GMX: Extended graphical model checks of RM/PCM/RSM for multi-group splits [ Computer software manual]. https://osf.io/2ryd8/(R package version 0.8-1)
- Andersen, E. B. (1973). A goodness of fit test for the rasch model. Psychometrika, 38(1), 123–140. https://doi.org/10.1007/BF02291180
- Anderson, S., Sommerhoff, D., Schurig, M., Ufer, S., & Gebhardt, M. (2022). Developing learning progress monitoring tests using difficulty-generating item characteristics: An example for basic arithmetic operations in primary schools. Journal for Educational Research Online, 2022(1), 122–146. https://doi.org/10.31244/jero.2022.01.06
- Ayala, R. J. D. (2022). The Theory and Practice of Item Response Theory (2nd ed.). Guilford Publications .
- Baghaei, P., & Hohensinn, C. (2017). A method of Q-Matrix validation for the linear logistic test model. Frontiers in Psychology, 8, 897. https://doi.org/10.3389/fpsyg.2017.00897
- Bauer, J., Siegmund, J., Peitek, N., Hofmeister, J. C., & Apel, S. (2019). Indentation: Simply a matter of style or support for program comprehension? In 2019 IEEE/ACM 27th international conference on program comprehension (ICPC). IEEE. https://doi.org/10.1109/icpc.2019.00033
- Bergersen, G. R., Sjøberg, D. I., & Dyb°a, T. (2014). Construction and validation of an instrument for measuring programming skill. IEEE Transactions on Software Engineering, 40(12), 1163–1184. https://doi.org/10.1109/TSE.2014.2348997
- Berges, M., & Hubwieser, P. (2015). Evaluation of source code with item response theory. In Proceedings of the 2015 ACM conference on innovation and technology in computer science education. ACM. https://doi.org/10.1145/2729094.2742619
- Birnbaum, A. (1968). Some Latent Trait Models and Their Use in Inferring an Examinee’s Ability. In F. M. Lord, & M. R. Novick (Eds.), Statistical theories of mental test scores (pp. 397–479). Addison-Wesley.
- Bockmon, R., Cooper, S., Gratch, J., & Dorodchi, M. (2019). (Re)validating cognitive introductory computing instruments. In Proceedings of the 50th ACM technical symposium on computer science education. ACM. https://doi.org/10.1145/3287324.3287372
- Brun, Y., Lin, T., Somerville, J. E., Myers, E., & Ebner, N. C. (2023). Blindspots in python and java APIs result in vulnerable code. ACM Transactions on Software Engineering and Methodology, 32(3), 76. https://doi.org/10.1145/3571850
- Brusilovsky, P., & Sosnovsky, S. (2005). Individualized exercises for self-assessment of programming knowledge: An evaluation of quizpack. Journal on Educational Resources in Computing, 5(3), 6–es. https://doi.org/10.1145/1163405.1163411
- Bureau of Labor Statistics, U.S. Department of Labor. (2022). Occupational Outlook Handbook. Retrieved September 13, 2022, from https://www.bls.gov/ooh/computer-and-information-technology/software-developers.htm
- Buse, R. P., & Weimer, W. R. (2008). A metric for software readability. In Proceedings of the 2008 international symposium on software testing and analysis. ACM. https://doi.org/10.1145/1390630.1390647
- Christensen, K. B., Bjorner, J. B., Kreiner, S., & Petersen, J. H. (2002). Testing unidimensionality in polytomous rasch models. Psychometrika, 67(4), 563–574. https://doi.org/10.1007/BF02295131
- Commons, M. L., Trudeau, E. J., Stein, S. A., Richards, F. A., & Krause, S. R. (1998). Hierarchical complexity of tasks shows the existence of developmental stages. Developmental Review, 18(3), 237–278. https://doi.org/10.1006/drev.1998.0467
- Cooper, A., & Petrides, K. V. (2010). A psychometric analysis of the trait emotional intelligence questionnaire–short form (TEIQue–SF) using item response theory. Journal of Personality Assessment, 92(5), 449–457. https://doi.org/10.1080/00223891.2010.497426
- Dancik, G., & Kumar, A. (2003). A tutor for counter-controlled loop concepts and its evaluation. 33rd Annual Frontiers in Education, 2003 Fie 2003, 1, T3C–7. https://doi.org/10.1109/FIE.2003.1263331
- Davidson, M. J., Wortzman, B., Ko, A. J., & Li, M. (2021). Investigating item bias in a CS1 exam with differential item functioning. In Proceedings of the 52nd ACM technical symposium on computer science education. ACM. https://doi.org/10.1145/3408877.3432397
- De Boeck, P., & Wilson, M. (2004). Explanatory item response models. Springer New York. https://doi.org/10.1007/978-1-4757-3990-9
- DeYoung, C. G., Quilty, L. C., & Peterson, J. B. (2007). Between facets and domains: 10 aspects of the big five. Journal of Personality and Social Psychology, 93(5), 880–896. https://doi.org/10.1037/0022-3514.93.5.880
- Dolado, J. J., Harman, M., Otero, M. C., & Hu, L. (2003). An empirical investigation of the influence of a type of side effects on program comprehension. IEEE Transactions on Software Engineering, 29(7), 665–670. https://doi.org/10.1109/TSE.2003.1214329
- Duran, R., Rybicki, J.-M., Sorva, J., & Hellas, A. (2019). Exploring the value of student self-evaluation in introductory programming. In Proceedings of the 2019 ACM conference on international computing education research. ACM. https://doi.org/10.1145/3291279.3339407
- Duran, R., Sorva, J., & Leite, S. (2018). Towards an analysis of program complexity from a cognitive perspective. In Proceedings of the 2018 ACM conference on international computing education research. ACM. https://doi.org/10.1145/3230977.3230986
- Elshoff, J. L., & Marcotty, M. (1982). Improving computer program readability to aid modification. Communications of the ACM, 25(8), 512–521. https://doi.org/10.1145/358589.358596
- Feitelson, D. G. (2023). From code complexity metrics to program comprehension. Communications of the ACM, 66(5), 52–61. https://doi.org/10.1145/3546576
- Fischer, G. H. (1995a). Derivations of the rasch model. In G. H. Fischer & I. W. Molenaar (Eds.), Rasch Models: Foundations, recent developments, and applications (pp. 15–38). Springer.
- Fischer, G. H. (1995b). The linear logistic test Model. In G. H. Fischer & I. W. Molenaar (Eds.), Rasch Models: Foundations, recent developments, and applications (pp. 131–155). Springer New York. https://doi.org/10.1007/978-1-4612-4230-78
- Fischer, G. H., & Formann, A. K. (1982). Some applications of logistic latent trait models with linear constraints on the parameters. Applied Psychological Measurement, 6(4), 397–416. https://doi.org/10.1177/014662168200600403
- Fischer, G. H., & Ponocny, I. (1994). An extension of the partial credit model with an application to the measurement of change. Psychometrika, 59(2), 177–192. https://doi.org/10.1007/BF02295182
- Fowler, M. (2018). Refactoring: Improving the design of existing code (2nd ed.). Pearson International.
- Glas, C. A. W., & Verhelst, N. D. (1995). Testing the Rasch Model. In G. H. Fischer & I. W. Molenaar (Eds.), Rasch Models: Foundations, recent developments, and applications (pp. 69–95). Springer New York. 10.1007/978-1-4612-4230-75
- Gopstein, D., Fayard, A.-L., Apel, S., & Cappos, J. (2020). Thinking aloud about confusing code: A qualitative investigation of program comprehension and atoms of confusion. Proceedings of the 28th ACM Joint Meeting on European Software Engineering Conference and Symposium on the Foundations of Software Engineering, Virtual Event USA. https://doi.org/10.1145/3368089.3409714
- Gopstein, D., Iannacone, J., Yan, Y., DeLong, L. A., Zhuang, Y., Yeh, M. K.-C., & Cappos, J. (2017). Understanding misunderstandings in source code. In Proceedings of the 2017 11th joint meeting on foundations of software engineering, Paderborn, Germany. https://doi.org/10.1145/3106237.3106264
- Gopstein, D., Zhou, H. H., Frankl, P., & Cappos, J. (2018). Prevalence of confusing code in software projects: Atoms of confusion in the wild. In Proceedings of the 15th international conference on mining software repositories (p. 281–291). New York, NY, USA: Association for Computing Machinery. https://doi.org/10.1145/3196398.3196432
- Herman, G. L., Zilles, C., & Loui, M. C. (2014). A psychometric evaluation of the digital logic concept inventory. Computer Science Education, 24(4), 277–303. https://doi.org/10.1080/08993408.2014.970781
- Hofmeister, J. C., Siegmund, J., & Holt, D. V. (2019). Shorter identifier names take longer to comprehend. Empirical Software Engineering, 24(1), 417–443. https://doi.org/10.1007/s10664-018-9621-x
- Horn, J. L. (1965). A rationale and test for the number of factors in factor analysis. Psychometrika, 30(2), 179–185. https://doi.org/10.1007/BF02289447
- Izu, C., Schulte, C., Aggarwal, A., Cutts, Q., Duran, R., Gutica, M. Heinemann, B., Kraemer, E., Lonati, V., Mirolo, C. and Weeda, R. (2019). Fostering program comprehension in novice programmers – learning activities and learning trajectories. In Proceedings of the working group reports on innovation and technology in computer science education. ACM. https://doi.org/10.1145/3344429.3372501
- Jones, D. M. (2006). Developer beliefs about binary operator precedence. Open Standards. Retrieved 2023-10-23, from. https://www.open-std.org/jtc1/sc22/wg23/docs/ISO-IECJTC1-SC22-WG23N0036-parenart.pdf
- Kernighan, B. W., & Pike, R. (1999). The practice of programming (1st ed.). Addison-Wesley Professional.
- Lister, R., Adams, E., Fitzgerald, S., Fone, W., Hamer, J., Lindholm, M. McCartney, R., Moström, J.E., Sanders, K., Seppälä, O. and Simon, B., Thomas, L. (2004). A multi-national study of reading and tracing skills in novice programmers. ACM SIGCSE Bulletin, 36(4), 119–150. https://doi.org/10.1145/1041624.1041673
- Lobb, R., & Harlow, J. (2016). Coderunner: A tool for assessing computer programming skills. ACM Inroads, 7(1), 47–51. https://doi.org/10.1145/2810041
- Luxton-Reilly, A., Becker, B. A., Cao, Y., McDermott, R., Mirolo, C., Mühling, A. Petersen, A., Sanders, K.,and Whalley, J. (2017). Developing assessments to determine mastery of programming fundamentals. In Proceedings of the 2017 ITiCSE conference on working group reports. ACM. https://doi.org/10.1145/3174781.3174784
- Mair, P., & Hatzinger, R. (2007a). CML based estimation of extended Rasch models with the eRm package in R. Psychology Science, 49(1), 26–43.
- Mair, P., & Hatzinger, R. (2007b). Extended rasch modeling: The eRm package for the application of IRT models in R. Journal of Statistical Software, 20(9). https://doi.org/10.18637/jss.v020.i09
- Mair, P., Hatzinger, R., & Maier, M. J. (2021). ERm: Extended rasch modeling [computer software manual]. https://cran.r-project.org/package=eRm ( R package Version 1.0-2)
- Margulieux, L., Ketenci, T. A., & Decker, A. (2019). Review of measurements used in computing education research and suggestions for increasing standardization. Computer Science Education, 29(1), 49–78. https://doi.org/10.1080/08993408.2018.1562145
- Marshall, L., & Webber, J. (2000). Gotos considered harmful and other programmers’ taboos. In Proceedings of the 12th annual workshop of the psychology of programming interest group (ppig) (pp. 171–177). Memoria. https://ppig.org/files/2000-PPIG-12th-marshall.pdf
- McDaniel, M. A., & Fisher, R. P. (1991). Tests and test feedback as learning sources. Contemporary Educational Psychology, 16(2), 192–201. https://doi.org/10.1016/0361-476X(91)90037-L
- McKeithen, K. B., Reitman, J. S., Rueter, H. H., & Hirtle, S. C. (1981). Knowledge organization and skill differences in computer programmers. Cognitive Psychology, 13(3), 307–325. https://doi.org/10.1016/0010-0285(81)90012-8
- Minelli, R., Mocci, A., & Lanza, M. (2015). I know what you did last summer – an investigation of how developers spend their time. In 2015 IEEE 23rd international conference on program comprehension. IEEE. https://doi.org/10.1109/icpc.2015.12
- Molenaar, I. W. (1995a). Estimation of item parameters. In G. H. Fischer & I. W. Molenaar (Eds.), Rasch models: Foundations, recent developments, and applications (pp. 39–51). Springer. https://doi.org/10.1007/978-1-4612-4230-7
- Molenaar, I. W. (1995b). Some background for item response theory and the rasch model. In G. H. Fischer & I. W. Molenaar (Eds.), Rasch models: Foundations, recent developments, and applications (pp. 3–14). Springer. https://doi.org/10.1007/978-1-4612-4230-7
- Parker, M. C., Guzdial, M., & Engleman, S. (2016). Replication, validation, and use of a language independent CS1 knowledge assessment. In Proceedings of the 2016 ACM conference on international computing education research. ACM. https://doi.org/10.1145/2960310.2960316
- Ponocny, I. (2001). Nonparametric goodness-of-fit tests for the rasch model. Psychometrika, 66(3), 437–459. https://doi.org/10.1007/BF02294444
- Rasch, G. (1960). Probabilistic models for some intelligence and attainment tests. Nielsen & Lydiche.
- R Core Team. (2021). R: A language and environment for statistical computing [computer software manual]. https://www.R-project.org/(RVersion4.2.0)
- Rigby, L., Denny, P., & Luxton-Reilly, A. (2020). A miss is as good as a mile: Off-by-one errors and arrays in an introductory programming course. In Proceedings of the twenty-second australasian computing education conference (p. 31–38). New York, NY, USA: Association for Computing Machinery. https://doi.org/10.1145/3373165.3373169
- Roehm, T., Tiarks, R., Koschke, R., & Maalej, W. (2012). How do professional developers comprehend software? In Proceedings of the 34th international conference on software engineering (ICSE), Zurich, Switzerland (pp. 255–265). IEEE. https://doi.org/10.1109/icse.2012.6227188
- Scheiblechner, H. (1971). CML-parameter-estimation in a generalized multifactorial version of Rasch’s probabilistic measurement model with two categories of answers. Department of Psychology, University of Vienna.
- Scheiblechner, H. (1972). Das Lernen und Lösen komplexer Denkaufgaben [Learning and solving of complex reasoning items]. Zeitschrift für Experimentelle und Angewandte Psychologie, 19, 476–506.
- Schulte, C. (2008). Block model: An educational model of program comprehension as a tool for a scholarly approach to teaching. In Proceedings of the Fourth International Workshop on Computing Education Research. ACM. https://doi.org/10.1145/1404520.1404535
- Shaft, T. M., & Vessey, I. (1995). The relevance of application domain knowledge: The case of computer program comprehension. Information Systems Research [ Retrieved 2023-09-27, from], 6(3), 286–299. http://www.jstor.org/stable/23010878
- Soloway, E. (1986). Learning to program = learning to construct mechanisms and explanations. Communications of the ACM, 29(9), 850–858. https://doi.org/10.1145/6592.6594
- Soloway, E., & Ehrlich, K. (1984). Empirical studies of programming knowledge. IEEE Transactions on Software Engineering, SE-10(5), 595–609. https://doi.org/10.1109/tse.1984.5010283
- Stefik, A., & Siebert, S. (2013). An empirical investigation into programming language syntax. ACM Transactions on Computing Education, 13(4), 1–40. https://doi.org/10.1145/2534973
- Tashtoush, Y., Odat, Z., Alsmadi, I., & Yatim, M. (2013). Impact of programming features on code readability. International Journal of Software Engineering and Its Applications, 7(6), 441–458. https://doi.org/10.14257/ijseia.2013.7.6.38
- Tew, A. E., & Guzdial, M. (2011). The FCS1. In Proceedings of the 42nd ACM technical symposium on Computer science education. ACM. https://doi.org/10.1145/1953163.1953200
- van der Linden, W. J. (2016). Handbook of item response theory. Chapman and Hall/CRC. https://doi.org/10.1201/9781315374512
- van der Linden, W. J., & Glas, C. A. (2010). Elements of adaptive testing. Springer New York. https://doi.org/10.1007/978-0-387-85461-8
- Vollmeyer, R., & Rheinberg, F. (2005). A surprising effect of feedback on learning. Learning and Instruction, 15(6), 589–602. https://doi.org/10.1016/j.learninstruc.2005.08.001
- Xia, X., Bao, L., Lo, D., Xing, Z., Hassan, A. E., & Li, S. (2018). Measuring program comprehension: A large-scale field study with professionals. IEEE Transactions on Software Engineering, 44(10), 951–976. https://doi.org/10.1109/tse.2017.2734091
- Xie, B., Davidson, M. J., Li, M., & Ko, A. J. (2019). An item response theory evaluation of a language-independent CS1 knowledge assessment. In Proceedings of the 50th ACM technical symposium on computer science education. ACM. https://doi.org/10.1145/3287324.3287370
- Zhuang, Y., Yan, Y., DeLong, L. A., & Yeh, M. K. (2023). Do developer perceptions have borders? Comparing C code responses across continents. Software Quality Journal. https://doi.org/10.1007/s11219-023-09654-0