
Abstract
Phenomenon: Educational activities for students are typically arranged without consideration of their preferences or peak performance hours. Students might prefer to study at different times based on their chronotype, aiming to optimize their performance. While face-to-face activities during the academic schedule do not offer flexibility and cannot reflect students’ natural learning rhythm, asynchronous e-learning facilitates studying at one’s preferred time. Given their ubiquitous accessibility, students can use e-learning resources according to their individual needs and preferences. E-learning usage data hence serves as a valuable proxy for certain study behaviors, presenting research opportunities to explore students’ study patterns. This retrospective study aims to investigate when and for how long undergraduate students used medical e-learning modules. Approach: We performed a cross-sectional analysis of e-learning usage at one medical faculty in the Netherlands. We used data from 562 undergraduate multimedia e-learning modules for pre-clinical students, covering various medical topics over a span of two academic years (2018/19 and 2019/20). We employed educational data mining approaches to process the data and subsequently identified patterns in access times and durations. Findings: We obtained data from 70,805 e-learning sessions with 116,569 module visits and 1,495,342 page views. On average, students used e-learning for 16.8 min daily and stopped using a module after 10.2 min, but access patterns varied widely. E-learning was used seven days a week with an hourly access pattern during business hours on weekdays. Across all other times, there was a smooth increase or decrease in e-learning usage. During the week, more students started e-learning sessions in the morning (34.5% vs. 19.1%) while fewer students started in the afternoon (42.6% vs. 50.8%) and the evening (19.4% vs. 27.0%). We identified ‘early bird’ and ‘night owl’ user groups that show distinct study patterns. Insights: This retrospective educational data mining study reveals new insights into the study patterns of a complete student cohort during and outside lecture hours. These findings underline the value of 24/7 accessible study material. In addition, our findings may serve as a guide for researchers and educationalists seeking to develop more individualized educational programs.
Introduction
Why are lecture theaters empty whilst e-learning is flourishing and becoming an integral part of medical school? Lectures and other educational face-to-face activities are usually scheduled during business hours and have a predetermined duration. These activities can provide several benefits to the learner, such as a distraction-free environment and the opportunity to interact with teachers, improving the efficiency of education. The rigid nature of the educational schedule, however, also has drawbacks. For instance, individual differences in students’ chronotype and, by extension, their preferred study times, are not considered.
A person’s chronotype is their inclination to a certain timing of alertness within the 24-h sleep-wake cycle (e.g., morning or evening type), also known as their diurnal preference. For normal, healthy adults the sleep-wake cycle is slightly longer than 24 h, pre-set by the phase of the brain’s internal biological clock and entrained by environmental cues (zeitgeber, e.g. daylight). In the literature, at least two chronotypes have been described – morning and evening types.Citation1 A mismatch between an individual’s zeitgeber and set daily activities can be disorienting.Citation1 Studies show that evening type adolescents who take a morning university entrance examination perform worse when compared to students with a compatible chronotype.Citation2,Citation3 Chronotype may thus be a fundamental factor in a student’s preferred study time and, as a result, their study performance.Citation4,Citation5
It is thus not surprising that chronotype has numerous effects on education, including performance during morning examinations, but also indirect effects through factors such as energy, conscientiousness, and mood.Citation6–9 One study of 3,160 university students found that 36% of students were evening types, who had higher levels of depression, anxiety and worse sleep quality compared to their peers.Citation10 Notably, chronotype is age-dependent, with young adults around 20 years of age having the latest chronotype, meaning that they wake up and go to bed at the latest times.Citation11 Studies suggest that matching the chronotype and class times is beneficial for students, as delaying school start times can improve academic performance,Citation12 and students provided with flexible start times reported both sleep quality and concentration improvements.Citation13 In essence, differences between students’ inherent chronotype and imposed study schedule, may impact attendance, study effectiveness, and student wellbeing.
Among undergraduate medical students, there is limited understanding of study timing preferences and the potential mismatch between these preferences and the lecture schedule, which might be better aligned with teachers’ chronotype. After all, universities typically schedule lectures and other teaching activities without considering whether these contact hours align with students’ preferences. To support successful study activity, it is crucial to provide students with optimal study means and to cater to their preferences. A promising solution is e-learning, as it enables students to study at their preferred times, thus offering a potential solution for a chronotype-schedule mismatch.Citation14
An important first step in figuring out students’ study timing preferences is to identify students’ study patternsCitation15 and to investigate whether these patterns show a relationship with chronotype. Study resources are increasingly offered electronically, allowing students to learn anytime and anywhere. E-learning not only facilitates flexible educational access, but also automatically generates a valuable digital trace when students interact with content. This trace can be stored and analyzed, offering a powerful unobtrusive and inconspicuous research tool. As a large amount of unfiltered data of different types gets created, however, traditional statistical methods are insufficient.
The state-of-the-art method to procure such information from raw learning platform data is educational data mining (EDM).Citation16 EDM allows for the extraction of very precise information from the raw data e-learning platforms create. Beyond serving as a useful proxy for certain student learning behaviors, this e-learning usage data offers promising potential of analyzing students’ behaviorCitation17 or predicting student academic performance.Citation18,Citation19 EDM, therefore, seems a promising tool for creating personalized learning experiences and enhancing curriculum design and management.Citation20–22 For now, we aim to answer the questions of when and for how long undergraduate medical students utilize e-learning modules throughout the day and week. To answer our research question, we will first delineate the e-learning system from which our data originated, then detail the educational data mining process we applied, and finally, an examination of the findings and how they might inform strategies to enhance academic outcomes.
Methods
Educational environment
This study was conducted at the medical faculty of the University of Groningen, The Netherlands. At this institution, each year 410 new medical students are admitted based on an entrance exam. The average medical student enters right from secondary education and follows a 6-year blended learning curriculum that places significant emphasis on self-study. E-learning modules are primarily utilized during the Bachelor phase and the first year of the Master program until clinical rotations commence.
Face-to-face activities, such as lectures, typically last 60-120 min and are scheduled on weekdays between 9:00 and 17:00. With 12 h of scheduled activities per week, they constitute a minor portion of total study time. Lecture attendance is not required. E-learnings are not used as lecture material. For self-study, students have the option to access custom-made asynchronous multimedia e-learning modulesCitation23 and textbooks, but are not required to do so. Students can complete the modules at any time, location, and at their own pace. Modules vary in length and content and can link to external resources (YouTube videos, H5P content, etcetera). Almost all modules contain self-assessments, like multiple-choice questions, so that students can test their knowledge, but students are not required to complete these and scores do not count toward any official grade. There are no restrictions to any module or internet access in The Netherlands at any time of day and all students access these modules from the same time zone. This possibility for ubiquitous access provides ideal conditions to gain insight into students’ online learning behavior, as students in this context likely use e-learning according to their needs.
The faculty also offers a dentistry and human movement sciences program as well as some smaller master programs. All enrolled students have access to all the e-learning modules, but non-medical students constitute less than one-quarter of the student population ().
Table 1. Different degree programs at the medical faculty of the University of Groningen, The Netherlands, for the academic years 2018/19 and 2019/20.
In this cross-sectional study, we included all e-learning modules focusing on a medical learning objective. Typically, students needed 30-60 min to complete such a module, depending on the module length. To define “module”, we adopted Smith’s definitionCitation24 of a learning object: materials that are structured meaningfully tied to an educational objective.Citation25 E-learning is, therefore, to be distinguished from other digital services like learning management systems used for sharing organizational information. Moreover, e-learning modules deliver study content akin to textbooks and are often enriched with multimedia materials and provide interactive elements, such as self-tests, enabling students to engage in active learning directed at a learning outcome.
Data collection
The e-learning platform (VersaTest©, ClearCode Solutions, The Netherlands) automatically generates and stores anonymous usage data by logging each module access and each user input, such as navigating through the different pages of a module, with a timestamp. We extracted a subset of these data containing all data points from two academic years (2018/19 and 2019/20) for further analysis. The main access variables we used were the date and time a user logged onto the e-learning platform and the modules and pages that a user visited.
Data processing
The EDM process involves extensive data exploration because there is a large amount of unfiltered raw data that was collected automatically without a specific objective. In our case, the platform logged every single access, irrespective of whether the user is a student or not, and the datasets also included all e-learning modules, regardless of whether the module was relevant to the present analysis. During our exploration, we determined the types of data required, confirmed data integrity, and took the necessary steps to ultimately obtain a dataset that could be used to answer our research question.
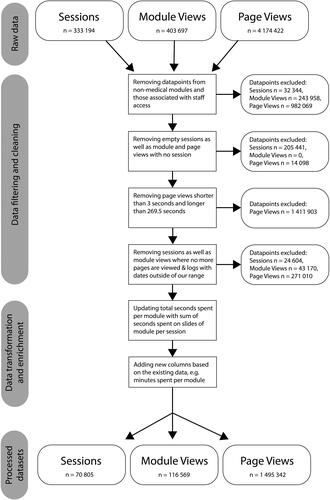
We explored and subsequently filtered and normalized the format of the data to get to the right granularity level for each analysis, employing Romero and Ventura’s EDM approach.Citation26 A schematic overview of our processing steps can be found in . We took these steps sequentially, each step followed by a team review for correctness and potential refinements. This iterative cycle was maintained throughout the data analysis to address issues and to optimize our methods. We started by removing datapoints from non-medical modules and those reflecting staff access to the modules. Within the remaining data, the main challenges were that users skipped pages, presumably because they needed to navigate to a specific page, or that users seemed to be idle (spending a very long time on a page). As such entries could affect our analysis’s accuracy and reliability, we cleaned the data determining a minimum usage time of 3 s per page based on the shortest page available and the maximum reading speed of undergraduate medical students.Citation27 After cleaning the data according to this criterion, the data were positively skewed (see Appendix 1). Considering the non-normal distribution of the data, we employed the central limit theorem, as proposed by Kwak and Kim,Citation28 which states that with a sufficiently large number of random samples the sample means will approximate a normal distribution. Based on 10,000 random samples repeated 200 times, we observed a normal distribution with a mean of 149.5 ± 40 s. Using three standard deviations we determined our maximum cutoff value at 269.5 s. This implied that 99.7% of users were active for less than 4.5 min per page. Any individual page view lasting longer than 4.5 min was therefore considered idle, i.e., representing a lack of active engagement. Consequently, logs of those page views were excluded.
Figure 1. Flowchart showing the EDM data processing steps taken in this study.
We used the filtered data to identify time spent, the time-of-day students studied, and weekly study patterns. For the average daily time spent on the e-learning platform we used the average of all students’ page view durations within 24 h for each user. The same was done for the time spent on any single module. To estimate the time of day at which students prefer to study, we chose the time the first page of the session was accessed by each student. We grouped these by weekday for graphic representation. The faculty administration provided the demographic variables of students.
To investigate the role that chronotype might play in the different patterns observed, we used the logs associated with unique user IDs to identify ‘early bird’ and ‘night owl’ students. Due to the lack of demographic information, we opted for two distinct ‘extreme’ groups on either side of 05:00, which is the mid-sleep time on free days for a typical undergraduate student.Citation11 We defined having started four or more e-learning sessions late at night (00:00 – 05:00) as ‘night owl’ behavior and four or more e-learning sessions early in the morning before university starts (05:00 – 09:00) as ‘early bird’ behavior.
The EDM approach allowed us to get to the appropriate level of detail in the data structure for our analysis. We also created additional data frames where needed, e.g. an overview of all modules, and we created further attributes, a process called data enrichment.Citation29 For the exploration and processing, we used the programming language R (R, version 4.1.2, R foundation, Austria).
Inclusion/exclusion criteria
Included in the final analysis were actively enrolled students of the medical faculty using e-learning modules. Excluded were logs from encrypted user IDs who accessed staff content, views of non-medical modules and individual page views shorter than 3 s or longer than 269.5 s. After exploring the data first to calculate the exact cutoff values, we gathered the following variables: the date and time of the session start, module views, page views, session duration, and encrypted user ID, where available.
Statistical analysis
Numerical data were analyzed using descriptive statistics (mean, standard deviation, median and quartiles). Normality of data distribution was determined using Shapiro-Wilk normality tests. For non-normally distributed data we used the Mann–Whitney U test, assuming a significance level of p > 0.05. The statistical analysis was carried out with the same version of R as mentioned above.
Results
During the two-year period, a total of 4,212 (2018/19) and 4,318 (2019/20) enrolled students had access to the 562 e-learning modules. Each module consisted of 14 pages on average, as the platform contained 7,933 unique pages. The dataset processing resulted in a total of 70,805 medical e-learning sessions for which 116,569 module visits occurred and 1,495,342 pages were viewed.
Due to a progressive rollout of a mandatory sign-in procedure at the time, 31.5% of logs were associated with a unique user ID. The number of unique user IDs was 3,044. We can, therefore, say that more than half of the enrolled students of the medical faculty used e-learning modules at least once, but we cannot provide a specific percentage.
Overall system usage
The usage frequency of e-learning users varied considerably, ranging from once to 104 times. The vast majority of users (98%) used e-learning more than once. There was also a large range of total platform access duration. 33.1% of platform accesses lasted less than 30 min, 13.0% between 30 and 60 min and 53.9% for more than 60 min. Further, when analyzing daily activity levels, we found notable diversity in the duration of student interaction with the e-learning environment. The daily time spent ranged from as brief as 4 sec to as extensive as 6.2 h per day, with an average of 16.8, x̃=7.33, Q25=1.1, Q75=23.6 min, where x̃ denotes the median, Q25 and Q75 the 25%- and 75%- quartiles, respectively. The graphical output can be found in Appendix 1.
Module and page usage
The extent of individual module access by signed-in users also varied. On average, students engaged with 12 different modules with a range of 1 to 216 modules (x̃=7, Q25=3, Q75=16 modules), and an average of 128.4 pages (range: 1 to 2091, x̃=48.0, Q25=10, Q75=171 pages). Whilst active within individual modules, time spent varied between 4 s and 2.9 h, with an average of 10.2 min (x̃=4.0, Q25=0.6, Q75=13.4 min). The graphical output can be found in Appendix 2. According to our inclusion criteria, time spent per page was between 3 and 269 s. The average time spent on a page was 47.8 s (x̃=21.0, Q25=2.0, Q75=66.0 s).
Time of day usage
With the data visualized in graphs (), we can see that most students chose to view e-learning modules during the day (9:00-18:00). A first activity peak occurred at about 9:00. At almost every full hour, further access peaks were present, suggesting that students chose to start studying at the full hour. Around lunchtime (12:30-13:30), the number of new module views decreased slightly and then increased again during the afternoon. The number of new sessions declined after 16:00 to the evening’s lowest point at around dinnertime (19:00). After that, it increased again, peaking at about 20:30, before decreasing to only a few module views during the overnight hours (02:00-07:00).
Figure 2. Distributions of e-learning session start times per day of the week starting with monday at the bottom. For smoothing, a kernel density estimation with a bandwidth of 300 datapoints was used to depict the data. The total number of sessions per weekday are given as n. The hourly rhythm defines weekday (light grey) studying behavior between 9:00 and 16:00 and a more uniform distribution defines evenings and weekend days (dark grey).
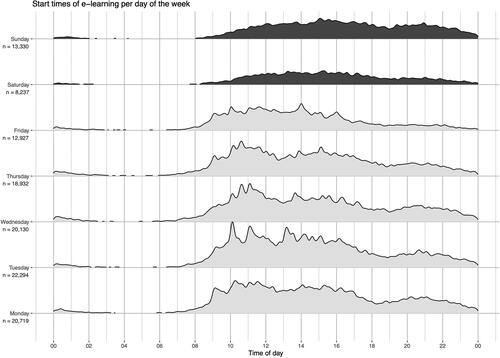
Whilst the weekdays showed hourly peaks between 9:00 and 16:00, both Saturdays and Sundays showed no clearly visible peaks. During the week, most e-learning sessions started after 9:00, but on the weekend most e-learning sessions started after 11:00. Tuesday was the day on which the most e-learning sessions were started (n = 22,294) and show the clearest peaks. Both Monday and Friday were the busiest mornings and Friday and Saturday evenings were the quietest evenings of the week (). Considering the infrequent incidence (n = 9) of public holidays falling on weekdays, we did not exclude them from the analysis. Furthermore, our findings did not indicate any discernible changes in patterns attributable to the COVID-19 pandemic, like changes in the patterns prior to and during times when face-to-face education was suspended.
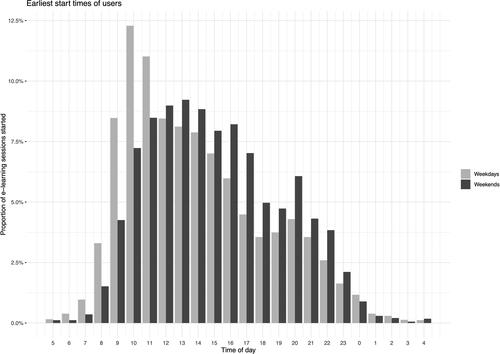
Using the earliest logs of the unique user IDs (n = 3,044) to analyze students’ start times, we found that during the week, 34.5% of students started using e-learning in the morning, 42.6% in the afternoon, and 19.4% in the evening. During weekends, 19.1% of students started using e-learning in the morning, 50.8% in the afternoon, and 27.0% in the evening ().
Figure 3. Earliest start times of users during the week (light grey) and the weekend (dark grey).
Chronotypes
Among the 3,044 users with a user ID, we found that 2.4% exhibited extreme ‘early bird’ tendencies (4 or more sessions started between 5:00 and 9:00, n = 73) and 2.4% of users demonstrated characteristics of extreme ‘night owls’ (4 or more sessions started between 0:00 and 5:00, n = 74). The remaining users were ‘intermediates,’ indicating neither a strong preference toward early morning nor late-night studying ().
Figure 4. Number of e-learning sessions started at each hour of the day, grouped by weekday (upper bar chart) and weekend activity (lower bar chart). ‘early bird’ activity is shown in red and ‘night owl’ activity in blue.
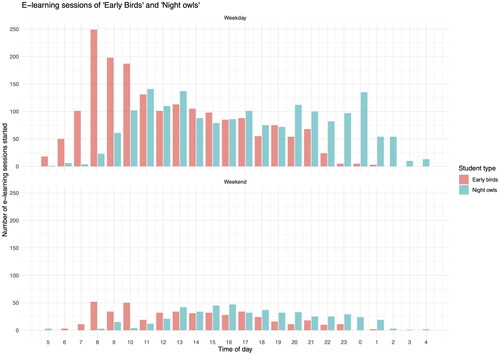
All chronotypes viewed e-learning modules during the day, with everyone being active during university hours, but before 11:00 on both week- and weekend days mostly ‘early bird’ activity occurred. After 21:00 mostly ‘night owl’ activity persisted. Whilst ‘early bird’ activity peaked around 08:00 and then gradually decreased over the day, ‘night owl’ activity seemed to be ‘M’ shaped, with a slight dip in the late afternoon between a morning and midnight peak. This weekday pattern was not visible on the weekend. The descriptive statistics of these distributions can be found in below.
Table 2. Descriptive statistics of time of day (hour) when different students study.
The data followed a non-normal distribution (Shapiro-Wilk normality tests for all patterns resulted in p < 0.05). According to the Mann–Whitney U tests, there was a significant difference between the general times on weekdays and weekends when students used e-learning (W-value = 1476343, p < 0.01) and between the times when ‘early birds’ and ‘night owls’ used e-learning (W-value = 1291974, p < 0.01). Strikingly, there was no significant difference between the weekday and weekend e-learning usage times of ‘night owls’ (W-value = 404558, p-value = 0.10), whilst there was a significant difference for ‘early birds’ (W-value = 342117, p < 0.01).
Discussion
The EDM approach allowed us to identify general e-learning usage patterns of undergraduate medical students. Students used the e-learning modules daily with a distinct hourly pattern on weekdays. During the evenings, overnights, and the weekends, a different, less entrained rhythm appeared. On average, students used the e-learning modules for 16.8 min per day, and on average, stopped using an e-learning module after 10.2 min, with considerable variation in the time spent. We were able to identify ‘early bird’ and ‘night owl’ students in our data and were able to show that they have different study patterns and study differently on weekdays and the weekend.
We employed EDM techniques to extract meaningful patterns of e-learning usage from raw e-learning usage data. This enabled us to operationalize student learning behaviors, such as e-learning usage patterns, that otherwise are typically inferred from questionnaires.Citation30 Most studies dealing with e-learning usage in healthcare education are flawed due to an apparent lack of detail concerning comparable and meaningful findings.Citation15 The amount of data in combination with our methods seems to be a promising tool, but ideally needs to be enhanced through metadata to allow more meaningful insights.
Undergraduate medical students showed consistent e-learning engagement across all days of the week. Surprisingly, Sunday exhibited even more e-learning activity than Friday. Although, understandably, undergraduate students may travel home or prioritize other activities over e-learning on a Friday evening, it is intriguing to observe such significant usage during the weekend. The increase in e-learning activity on Sunday evenings suggests that students may perceive Sunday evening as the start of a new week and as an opportune time to begin reviewing study materials.
On weekdays, the e-learning modules were used with a distinct, approximately hourly pattern between 9:00 and 16:00. During the evenings and the weekends, a different, more smoothly distributed pattern appeared. The observation of distinct patterns serves as a verification of data integrity, substantiating the applicability of EDM within our dataset. Interestingly, there were some students who nevertheless tended to adhere to conventional working hours during the weekend and did not adjust their behavior in free periods, as has been demonstrated in other studies.Citation31 The peaks on weekdays may be due to students opening the e-learning platform at the beginning of a lecture, at the beginning of a free period between lectures, or simply at the beginning of self-scheduled study time. The weekday pattern suggests that the academic schedule may influence students’ e-learning usage in a way that is distinctly different from factors influencing e-learning usage outside university hours.
The study patterns of ‘early birds’ and ‘night owls’ suggests that students align with their chronotype, engaging in learning activities at roughly the same times throughout the week.Citation2,Citation8,Citation14 However, there is a notable difference between chronotypes. ‘Night owls’ tended to consistently study during the night hours of both weekdays and the weekend, without statistical differences in their time patterns, suggesting a natural rhythm based on their chronotype. ‘Early birds’ on the other hand tended to wake up and study about two hours later during weekends when compared to the weekdays. As these ‘early bird’ students did not maintain their rhythm they maybe should not be considered true ‘early birds.’ Their learning behavior timing might simply be a result of the early university schedule that seems to shift e-learning activity forwards by two hours.
Whilst caution should be exercised in drawing general conclusions from such a small sample size, the logs of all students () showed the same shift in session start time from 09:00 to 11:00 on weekend days, whilst the evening and nighttime pattern remained more or less the same throughout the week. Considering previous research findings on the preference and peak performance momentsCitation2–4 of undergraduate students and the observed differences in study patterns between weekdays and weekends, we recommend that face-to-face education does not commence before approximately 11:00. Night owls, potentially due to being required to attend mandatory university meetings in the morning, study throughout the day even though their preference for evening hours is apparent from the density of their activity. There is a substantial amount of studying taking place during the night hours, but not the early morning hours. This observation is in line with the larger proportion of late chronotypes within this student populationCitation11 and suggests that every student, but especially ‘night owls,’ would benefit from a later start time.Citation14 This assumes that e-learning preferences can be translated to face-to-face teaching. Considering that we may reduce the numerous negative consequences of this misalignment,Citation4,Citation5,Citation10 it seems an obvious and necessary thing to try, not only for the sake of academic achievement but also for student wellbeing.
The moment of least e-learning activity coincided with the mid-sleep time of young adults on free days,Citation11 namely 05:00, verifying our data integrity once again. Combined with the distinct patterns of e-learning activity, reflecting students’ intrinsic studying start times, strengthens the suggestion that e-learning is an ideal proxy for certain intrinsic learning behaviors. As e-learning usage seems to align with students’ chronotypes on free days, it suggests the value of considering these natural rhythms in the structuring of academic schedules.
The time spent on e-learning exhibited considerable variation among users. On average, students engaged with e-learning for 16.8 min per day. This average duration encompassed the entire year, including holidays, and only the time actively spent studying. Students devoted around two hours each week to e-learning activities, but certain individuals demonstrated particularly intensive engagement, allocating nearly three hours of their day to a single module, reflecting a substantial commitment to in-depth learning within a short timeframe. Surprisingly, a significant number of logs consisted of very short accesses to the e-learning platform (Appendix 2). The raw e-learning usage study data suggested instances of sequential completion of modules, such as reading a chapter in a textbook and using e-learning as a reference work, where students only looked up bookmarked information on specific pages. This is not surprising considering that students prefer to use provided resources they knowCitation32 and try to find the most relevant information as quickly as possible. However, the different ways in which e-learning might be used also have not been described in detail yet. Additionally, the extent to which e-learning contributes to the overall study process has not been thoroughly investigated. These findings underscore the diverse and individual patterns of e-learning usage, with a mix of regular but brief interactions and instances of concentrated and extensive engagement resulting in a median time per module of four minutes.
In our study, we identified patterns indicating that students ceased studying a module after approximately 10 min, a key finding that sheds new light on student’s e-learning engagement. Notably, most module accesses were shorter than the time expected to complete them (30-60 min). This trend of ceasing e-learning activities after a short period raises critical questions about why students stop or pause and what students are doing during these breaks if they return to e-learning afterwards. While some researchers challenge the notion of diminishing student attention spans 10-15 min into lectures, suggesting that this may be based on subjective data collection methods or vary with teaching styles,Citation33 our data presents a different scenario in the context of e-learning. It showed a consistent pattern where students stopped with a module after 10 min and ceased studying after 16 min, on average. Although our findings do not allow for direct comparisons between face-to-face education and e-learning, they align with emerging recommendations for shorter class durations and incorporating breaks into lectures.Citation34 Perhaps, e-learning experiences should be tailored by including intentional pauses and summaries to better align with medical students’ study preferences.
Limitations
We were able to carry out an extensive analysis of a very large dataset using EDM. Yet, we must also concede that in this retrospective, anonymous study, no additional demographics or user metadata were available. There was also a lack of data from users who did not access the e-learning platform. Due to this sampling bias, we were unable to analyze patterns of individuals or sub-groups, e.g., first-year students.
It is possible that we included data points from instances where students accessed modules that were not applicable to them or where they accessed modules from a different time zone. Students studying during the holidays is another possibility. Whilst we found very little activity during university holiday periods, we did not exclude those few logs as we could not determine vacation days. Public holidays falling on weekdays were also not excluded. Moreover, fluctuations in enrollment numbers throughout the year had to be ignored.
Module usage during class could have influenced the results. This also applies to the time spent on modules, as the average can both include the serious ‘chronologically’ studying students and those merely looking something up briefly. Fortunately, the extensive dataset with a large number of students and modules will outnumber the few possible outliers, with a negligible influence on the results.
When students discontinued module usage on average after 10.2 min, it remains unclear whether they were taking a temporary break of unknown duration, switching to different study materials, using external resources, or completely ceasing their studying activities. Hence, caution should be exercised when interpreting the mean time spent on a module of 10.2 min. Additionally, the analysis did not account for variations in the quality and length of the modules, and we could not investigate the impact of examination periods on studying behavior. Furthermore, without metadata, it was not possible to explore the influence of e-learning patterns on exam outcomes. Finally, the study did not include independent determination of students’ chronotype. These limitations should be taken into consideration when interpreting the findings.
Future directions
Considering the next steps for future research in this area, a key focus should be on why and when students might take a break and the effects of breaks on e-learning. An important aspect to explore are the individual patterns and different user groups. Enhancing data quality by linking metadata, such as exam results, will enable a comprehensive analysis of the effectiveness of various study habits and patterns.
Conclusion
Utilizing the available data from digital learning allowed us to inconspicuously operationalize one aspect of students’ e-learning behavior, making it a promising research tool. We showed that students on average stopped after 10 min with a module and after 16 min with e-learning altogether, which did not match the prescribed module length. Moreover, variations in usage intentions (e.g., using a module as a reference rather than for studying) appeared to influence the observed patterns. Further investigation is needed to understand optimal module length and how e-learning modules need to be adjusted to suit students better. Combining knowledge from the literature with the fact that the weekdays dictated an earlier study pattern, creating ‘early birds’ when compared to the weekend, we found reason to support claims that face-to-face education should not commence before 11:00. Changing face-to-face teaching in such a way would also accommodate late chronotypes,Citation14 assuming e-learning preferences can be translated to face-to-face teaching. To our knowledge, this is the first study that uses EDM with a dataset of over 100,000 data points to determine medical students’ preferred e-learning schedules. This insight can be of value to those who schedule e-learning activities and create digital learning content and systems. We need to explore further aspects of these data and inform our analysis from other sources to gain universally applicable insights. These findings may partially explain why lecture theaters are empty. E-learning offers students the flexibility to study at their own pace and on their own schedule, a feature that may be particularly appealing to those who prefer managing their learning independently, outside of the constraints of scheduled lectures.
Ethical approval
This study lies outside the scope of the Dutch Medical Research Involving Human Subjects Act (WMO). Non-WMO ethical approval was granted (UMCG CTc reference number 202100723).
Acknowledgments
All authors contributed to the conception of the work. They also were involved in drafting or revising the article critically for intellectual content. All approved the final version.
Disclosure statement
No potential conflict of interest was reported by the authors.
Additional information
Funding
References
- Paine S, Gander PH, Travier N. Epidemiology of morningness/eveningness: influence of age, gender, ethnicity, and socioeconomic factors in adults (30-49 years). J Biol Rhythms. 2006;21(1):68–76. doi:10.1177/0748730405283154.
- Beşoluk Ş. Morningness–eveningness preferences and university entrance examination scores of high school students. Personal Individ Differ. 2011;50(2):248–252. doi:10.1016/j.paid.2010.09.038.
- Escribano C, Díaz-Morales JF, Delgado P, Collado MJ. Morningness/eveningness and school performance among Spanish adolescents: further evidence. Learn Individ Differ. 2012;22(3):409–413. doi:10.1016/j.lindif.2011.12.008.
- Evans MDR, Kelley P, Kelley J. Identifying the best times for cognitive functioning using new methods: matching university times to undergraduate chronotypes. Front Hum Neurosci. 2017;11:188. doi:10.3389/fnhum.2017.00188.
- Valdez P, Ramírez C, García A. Circadian rhythms in cognitive processes: implications for school learning. Mind Brain Educ. 2014;8(4):161–168. doi:10.1111/mbe.12056.
- Zerbini G, Merrow M. Time to learn: how chronotype impacts education. Psych J. 2017;6(4):263–276. doi:10.1002/pchj.178.
- Wood C, Magnello ME. Diurnal changes in perceptions of energy and mood. J R Soc Med. 1992;85(4):191–194. doi:10.1177/014107689208500404.
- Enright T, Refinetti R. Chronotype, class times, and academic achievement of university students. Chronobiol Int. 2017;34(4):445–450. doi:10.1080/07420528.2017.1281287.
- Preckel F, Lipnevich AA, Schneider S, Roberts RD. Chronotype, cognitive abilities, and academic achievement: a meta-analytic investigation. Learn Individ Differ. 2011;21(5):483–492. doi:10.1016/j.lindif.2011.07.003.
- Walsh NA, Repa LM, Garland SN. Mindful larks and lonely owls: The relationship between chronotype, mental health, sleep quality, and social support in young adults. J Sleep Res. 2022;31(1):e13442. doi:10.1111/jsr.13442.
- Roenneberg T, Kuehnle T, Juda M, et al. Epidemiology of the human circadian clock. Sleep Med Rev. 2007;11(6):429–438. doi:10.1016/j.smrv.2007.07.005.
- Kelley P, Lockley SW, Kelley J, Evans MDR. Is 8:30 a.m. still too early to start school? A 10:00 a.m. school start time improves health and performance of students aged 13–16. Front Hum Neurosci. 2017;11:588. doi:10.3389/fnhum.2017.00588.
- Winnebeck EC, Vuori-Brodowski MT, Biller AM, et al. Later school start times in a flexible system improve teenage sleep. Sleep (New York, N.Y.) 2020;43(6):1. doi:10.1093/sleep/zsz307.
- Horzum MB, Önder İ, Beşoluk Ş. Chronotype and academic achievement among online learning students. Learn Individ Differ. 2014;30:106–111. doi:10.1016/j.lindif.2013.10.017.
- Chan AK, Botelho MG, Lam OL. Use of learning analytics data in health care-related educational disciplines: systematic review. J Med Internet Res. 2019;21(2):e11241. doi:10.2196/11241.
- Romero C, Ventura S. Educational data mining: a review of the state of the art. IEEE Trans Syst Man Cybern C. 2010;40(6):601–618. doi:10.1109/TSMCC.2010.2053532.
- Gushchina OM, Ochepovsky AV. Data mining of students’ behavior in E-learning system. J Phys Conf Ser. 2020;1553(1):012027. doi:10.1088/1742-6596/1553/1/012027.
- Kukkar A, Mohana R, Sharma A, Nayyar A. Prediction of student academic performance based on their emotional wellbeing and interaction on various e-learning platforms. Educ Inf Technol. 2023;28(8):9655–9684. doi:10.1007/s10639-022-11573-9.
- Aulakh K, Roul RK, Kaushal M. E-learning enhancement through educational data mining with Covid-19 outbreak period in backdrop: a review. Int J Educ Dev. 2023;101:102814. doi:10.1016/j.ijedudev.2023.102814.
- Rabelo A, Rodrigues MW, Nobre C, Isotani S, Zárate L. Educational data mining and learning analytics: a review of educational management in e-learning. IDD. 2023; doi:10.1108/IDD-10-2022-0099.
- Maqsood R, Ceravolo P, Ahmad M, Sarfraz MS. Examining students’ course trajectories using data mining and visualization approaches. Int J Educ Technol High Educ. 2023;20(1):18–55. doi:10.1186/s41239-023-00423-4.
- Mabić M, Dedić F, Bijedic N, Gaspar D. Data mining and curriculum development in higher education, 2017.
- E-learning. Development team U. E-learning development team UMCG. https://sites.google.com/view/elearningdevelopmentteam.
- Smith RS. Guidelines for authors of learning objects. In NMC: The New Media Consortium; Austin, TX: New Media Consortium; 2004. http://www.nmc.org
- Johnson LF. Elusive vision: challenges impeding the learning object economy. New Media Consortium. 2003;1–20.
- Romero C, Ventura S. Data mining in education. WIREs Data Min Knowl. 2013;3(1):12–27. doi:10.1002/widm.1075.
- Klatt EC, Klatt CA. How much is too much reading for medical students? Assigned reading and reading rates at one medical school. Acad Med. 2011;86(9):1079–1083. doi:10.1097/ACM.0b013e31822579fc.
- Kwak SG, Kim JH. Central limit theorem: the cornerstone of modern statistics. Korean J Anesthesiol. 2017;70(2):144–156. doi:10.4097/kjae.2017.70.2.144.
- Romero C, Ventura S. Educational data mining: A survey from 1995 to 2005. Expert Syst Appl. 2007;33(1):135–146. doi:10.1016/j.eswa.2006.04.005.
- Singh HK, Joshi A, Malepati RN, et al. A survey of E-learning methods in nursing and medical education during COVID-19 pandemic in India. Nurse Educ Today. 2021;99:104796. doi:10.1016/j.nedt.2021.104796.
- Zavgorodniaia A, Shrestha R, Leinonen J, Hellas A, Edwards J. Morning or evening? An examination of circadian rhythms of CS1 students. Icse-Seet. 2021: 261–272. doi:10.1109/ICSE-SEET52601.2021.00036.
- Nagel M, Schäfer S, Zlatkin-Troitschanskaia O, et al. How do university students’ web search behavior, website characteristics, and the interaction of both influence students’ critical online reasoning? Front Educ. 2020;5:565062. doi:10.3389/feduc.2020.565062.
- Bradbury NA. Attention span during lectures: 8 seconds, 10 minutes, or more? Adv Physiol Educ. 2016;40(4):509–513. doi:10.1152/advan.00109.2016.
- Sheridan B, Smith B, Pleggenkuhle-Miles E. Short vs. long: cognitive load, retention and changing class structures. Educ. Econom. 2017;25(5):501–512. doi:10.1080/09645292.2017.1305099.
Appendix 1
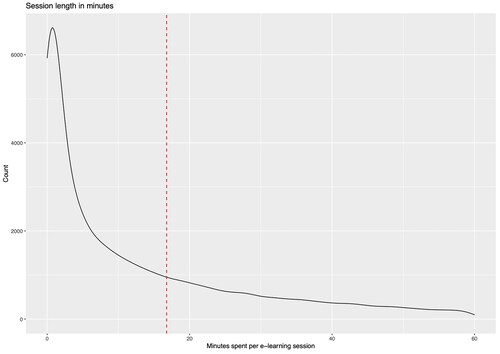
Figure A1. Time spent in minutes per e-learning session. A session contains all activity from a user within 24h. The mean time spent on a session (red line) is 16.8 min (range 0.05 - 369.9 min, median 7.3 min, skewness 2.6 and kurtosis 14.4).
Appendix 2
Figure A2. Time spent in minutes per e-learning module. The mean time spent on a module (red line) is 10.2 min (range 0.05–176.9 min, median 3.9 min, skewness 2.4 and kurtosis 9.9).
