
ABSTRACT
Background
Predicting severe preeclampsia with need for intensive care is challenging. To better predict high-risk pregnancies to prevent adverse outcomes such as eclampsia is still an unmet need worldwide. In this study we aimed to develop a prediction model for severe outcomes using routine biomarkers and clinical characteristics.
Methods
We used machine learning models based on data from an intensive care cohort with severe preeclampsia (n=41) and a cohort of preeclampsia controls (n=40) with the objective to find patterns for severe disease not detectable with traditional logistic regression models.
Results
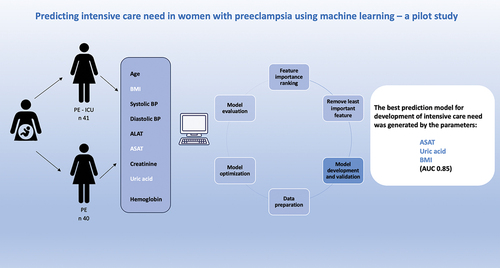
The best model was generated by including the laboratory parameters aspartate aminotransferase (ASAT), uric acid and body mass index (BMI) with a cross-validation accuracy of 0.88 and an area under the curve (AUC) of 0.91. Our model was internally validated on a test-set where the accuracy was lower, 0.82, with an AUC of 0.85.
Conclusion
The clinical routine blood parameters ASAT and uric acid as well as BMI, were the parameters most indicative of severe disease. Aspartate aminotransferase reflects liver involvement, uric acid might be involved in several steps of the pathophysiologic process of preeclampsia, and obesity is a well-known risk factor for development of both severe and non-severe preeclampsia likely involving inflammatory pathways..
Introduction
Preeclampsia (PE) is a pregnancy-specific disorder affecting 2–5% of all pregnancies and is an important cause of maternal and fetal mortality and morbidity (Citation1,Citation2). In Sweden, 180 mothers a year are treated in an intensive care unit (ICU) because of complications to PE (Swedish Intensive Care Register, SIR).
Specific and sensitive predictive algorithms would be valuable clinical tools to distinguish high-risk preeclampsia patients from patients that would be possible to treat more expectantly. An optimal clinical prediction model should contain patient characteristics, physiological parameters, and/or routine plasma biomarkers that are inexpensive, and simple to obtain even in a low-resource setting. Adding specific biomarkers and complex physiological measurements such as uterine artery Doppler index to the models may improve sensitivity and specificity, but the clinical availability of such analysis is still limited to university clinics in high-income countries.
The Fetal Medicine Foundation (FMF) first trimester prediction model consisting of maternal factors, mean arterial pressure, uterine pulsatility index and serum placental growth factor (PIGF) followed by administration of low-dose aspirin in high-risk patients, has been shown to reduce the incidence of pre-term PE by 62% (Citation3,Citation4). When PE is established, prevention of seizures, treatment of hypertension and timed delivery are the only treatment options available.
Severe forms of PE are however still not possible to predict. Eclampsia is one severe adverse outcome of preeclampsia associated with increased maternal mortality and morbidity. Treatment with magnesium sulfate reduces the occurrence of eclamptic seizures in patients with severe preeclampsia from 2% to less than 0.6% (Citation5).
Severe hypertension is also a feature associated with adverse pregnancy outcomes increasing the risk for complications (Citation6). The thresholds for treatment are trending lower, and the International Society for the Study of Hypertension in Pregnancy (ISSHP) has a therapeutic target of 130/80 mmHg, but national guideline recommendations may differ.
For late-onset preterm PE, planned delivery at 37 gestational weeks reduce maternal mortality and morbidity, without increasing neonatal mortality, but with increasing neonatal unit admissions (Citation7). For early-onset PE, the decision to deliver is per definition associated with higher neonatal mortality and morbidity.
Previous studies on prediction models for maternal adverse events in PE are based on different combinations of biomarkers and/or clinical characteristics (Citation8–13).
Machine learning models are gaining increasing popularity in research in general but also in PE research specifically (Citation14). Preeclampsia is a heterogenous disease of great complexity and machine learning algorithms could make it possible to discover patterns and interactions between data that are not found using traditional multivariable regression models (Citation15). Machine learning has previously been used in several studies for prediction of PE diagnosis as well as monitoring women during pregnancy to ensure perinatal health (Citation16–23). A recent study by Schmidt et al. (Citation14) showed that machine-based learning algorithms can improve prediction of PE associated adverse outcomes in pregnancy.
To the best of our knowledge, machine-based learning models have never been used for predicting severe organ failure postpartum with need of intensive care treatment because of PE.
Objective
The objective of this case-control study was to develop a pilot machine-learning based algorithm to predict severe organ failure in PE.
Methods
Study population
We included 41 women diagnosed with severe PE (PE, eclampsia) and/or HELLP (Hemolysis, Elevated Liver enzymes, Low Platelets) that needed intensive care treatment and 40 women diagnosed with PE but managed at the normal delivery unit as a control group. All women were treated in regional hospitals in Southern Sweden with the same inclusion criteria for ICU-admission.
The intensive care patients were previously enrolled in the Swecrit-study (Blood Samples From Critically Ill Patients and Healthy Controls) between 2015 and 2018 (ClinicalTrials.gov, Identifier: NCT04974775). All ICU-patients were informed about the possibility to have their samples destroyed if not willing to participate in the Swecrit-register. Preeclampsia was defined according the ISSHP guidelines as de novo hypertension after 20 gestational weeks accompanied by proteinuria and/or evidence of any maternal organ dysfunction such as acute kidney injury, liver dysfunction, neurological features, hemolysis, or thrombocytopenia, and/or fetal growth restriction (Citation24). In some cases, PE became manifest intra-partum or early post-partum. Severe preeclampsia was defined as blood pressure >160 mmHg systolic or 110 mmHg diastolic. Early onset PE was considered as severe PE with delivery before 34 weeks’ gestation (Citation25). The HELLP-syndrome, a serious manifestation of PE was also defined as a severe form of PE (Citation24).
Outcome
Outcome was defined as admission to intensive care treatment or not.
Ethical permission
The study was approved by the Regional Ethical Review Board for studies in human subjects at Lund University, Lund, Sweden, Dnr 2019–0468, 2016/49 and for Swecrit 2015/267.
Model development
We included the numerical variables age, body mass index, systolic blood pressure, diastolic blood pressure, as well as routine blood samples platelets, alanine aminotransferase (ALAT), aspartate aminotransferase (ASAT), creatinine, uric acid, and hemoglobin. Due to the small dataset, we excluded the categorical variables severe preeclampsia, smoking, parity, multiple gestation, proteinuria, small for gestational age, induction, previous PE, chronic hypertension, previous kidney disease, diabetes mellitus, gestational diabetes mellitus, gestational hypertension, fetal sex, ethnicity, and family history even though some of them are known risk factors for PE (detailed demographics of the study-groups are shown in Table A1). The reason for this was that the coding of the categorical variables would have generated to many variables for the size of the dataset. Additional feature selection was performed during modeling based on their importance ranking.
To ensure an unbiased model development and independent internal validation, the data was randomly divided into a training-set (80%) and a test-set (20%) in a stratified fashion. Stratification ensured that the distribution of the outcome variable was approximately the same in the training-set and test-set. Hence, the patients in the training-set were not the same as the patients in the test-set for internal validation.
The model development was performed through an iterative process, chosen to identify the subset of features that gave the best predictive performance. In each iteration, the hyperparameters of the XGboost model was optimized. At the end of each iteration, the best model was used to determine feature importance, and the variable reported as least important was removed. Variable importance was calculated using Shapley Additive Explanations (SHAP) (Citation26), which calculates the contribution of individual features to the prediction.
The hyperparameter tuning was automated using Optuna, an open-source hyperparameter optimization framework to automate hyperparameter search (Citation27). Optuna was configured to use the Tree-Structure Parzen Estimator (TPE) to sample the hyperparameters (Citation28). The TPE is a Bayesian optimization technique that intelligently searches for optimal hyperparameters. The hyperparameters and their sample-space are shown in Table A2. The number of trials were set to 500, i.e., for each iteration, 500 sets of hyperparameters are tested. To limit overfitting the models were trained using early stopping. The few missing values present in the data were handled internally by the XGboost model (Citation29).
To evaluate model performance, the training data was split using repeated stratified K-fold cross-validation. This technique is similar to K-Fold cross-validation, where the data is divided into K-folds of equal size, and a model is trained on data from K-1 folds, leaving one to evaluate the model. After training K-models, using a different fold to evaluate the model each time, the cross-validation was complete. However, in repeated K-fold cross-validation this process was repeated multiple times, and for each repetition, the data was randomly re-divided into K-folds. Repeated stratified K-fold cross-validation, simply adds to the repeated K-fold cross-validation by ensuring that each fold has approximately the same distribution based on the outcome variable. In this study, 5 folds and 10 repetitions were used, resulting in a total of 50 training- and validation-sets.
The evaluation metrics used were accuracy and area under the curve (AUC). During model development, the model performance was defined as the mean of these metrics calculated on each validation set. Initially, models were compared based on the validation accuracy, and if two models had the same accuracy, AUC was used as the differentiator. The best-performing models in each iteration were saved and used to compute feature importance. Since the cross-validation approach generates 50 models, the importance of a feature was determined by averaging the SHAP-value from the different models. The iterative model development was completed when all but one feature had been removed. Internal validation on the test set was performed by creating an ensemble prediction from the models having the best predictive performance, i.e., each model provided predictions for the test set, and the final prediction for a subject was determined as the mean value of these predictions. A threshold of 0.5 was used to classify the binary prediction based on the mean prediction.
To give a better comparison between the cross-validated result and the ensemble prediction on the test set, an ensemble prediction was also performed on the cross-validation set. This cross-validation ensemble prediction was created by averaging the predictions for each subject whenever it was included in the validation set.
Results
Patient characteristics
The clinical and biochemical characteristics for the patient groups are presented in . Since uric acid levels varies with gestation week (Citation30), a z-score for uric acid in the ICU-cohort and PE-controls was calculated and presented in and .
Table 1. Clinical and biochemical characteristics for the patient cohorts
Table 2a. Uric acid corrected for gestational age in the patient cohorts.
Table 2b. Uric acid corrected for gestational age in the patient cohorts.
Reasons for admission to the intensive care unit beyond PE are shown in .
Table 3. Reasons for admission to the intensive care unit beyond PE
In the control-group the diagnosis was PE or severe PE. Nine patients (22.5%) were early-onset PE (EPE) and the rest late-onset PE (LPE). In the ICU-cohort all patients were severe PE, 14 patients were EPE (34%) and the rest LPE.
None of the controls developed a seizure. Three patients were treated with Magnesium (Mg) in the control group. Nine ICU-patients developed eclampsia, but none of them were treated with Mg before the seizure.
Three patients in the control-group had a bleeding >500 ml and one >1000 ml.
Patients in the ICU-cohort had significantly higher systolic and diastolic blood pressure despite being treated with more than one antihypertensive agent.
The total number of days in hospital before delivery was 4,6 (mean) in the ICU-cohort and 4,9 (mean) for the controls.
A comparison of end organ failure between patients admitted to ICU vs. PE controls is shown in the supplemental section as Table A3.
Final model development
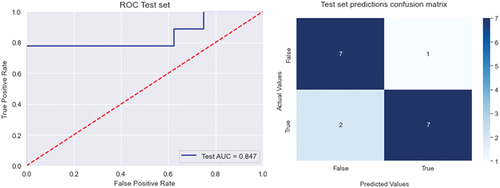
We used SHAP-values to rank the importance of the variables for every model. The best model was generated when using the variables ASAT, uric acid, and body mass index. This set of variables resulted in a cross-validation accuracy of 0.88 and an area under the curve (AUC) of 0.91. When internally validating this model on the test-set the accuracy was lower with 0.82 and an AUC of 0.85.
The cross-validated ensemble prediction resulted in an accuracy of 0.92, and AUC 0.90. The Receiver operating characteristic (ROC) curve, and confusion matrix for the cross-validated ensemble prediction and internal validation are shown in and .
Figure 1. Predictive performance of the cross-validated ensemble prediction. Left figure shows the receiver operating characteristic curve and the area under the curve. The right figure is the prediction confusion matrix.
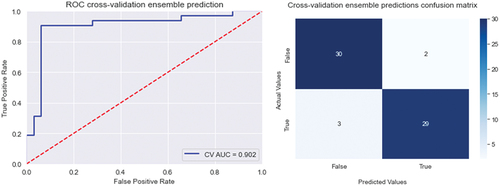
Figure 2. Internal validation results. Left figure shows the receiver operating characteristic curve and the area under the curve. The right figure is the prediction confusion matrix.
Neonatal outcome
The patients in the ICU-cohort delivered earlier, at 250 (225–267) gestation days compared to 273 (256–278), p = 0.002, in the control group. The birthweight in the ICU-cohort was significantly lower, 2257 (1949–2565) g compared to 3043 (2720–3366) g, p < 0.001, in the controls. There was no difference in Apgar score at one or ten minutes between the groups, however, at 5 min there was a significant difference in Apgar score showing lower scores in the ICU-cohort (Table A4).
Discussion
When a patient presents with pregnancy hypertension and the suspicion of PE is raised, a standard package of clinical blood biomarkers is taken to confirm organ involvement. We included these standardized lab results together with other easily obtainable clinical characteristics, such as age, BMI, systolic and diastolic blood pressure.
In this study, we used machine-based learning models, to find patterns not recognizable by logistic regression that performed less well on our test-set. The best model was generated with the variables ASAT, uric acid, and body mass index with a cross validation-accuracy of 0.88 and an area under the curve (AUC) of 0.91. Our model was internally validated on a test-set where the accuracy was reduced to 0.82, with an AUC of 0.85. Still performing well considering the few parameters. In fact, adding more parameters to the model did not improve the accuracy.
The prediction model showed that ASAT and uric acid as well as body mass index, were the three parameters that in combination were most indicative of severe disease.
Aspartate aminotransferase, uric acid and BMI are, according to the results, parameters that clinicians should pay special attention to and follow their dynamics. Aspartate aminotranferase is present in all tissues except bone, with the highest level in skeletal muscle and liver. In hepatocellular injuries, both ASAT and ALAT are elevated, the magnitude of the later is usually greater because of the longer half-life of ALAT and a greater fraction of ASAT is bound to mitochondria. The elevated serum level of ASAT in PE is explained by the effect of hypoxia on the liver (Citation31). Aspartate aminotransferase is also included in the full-PIERS model, and in the studies by Dröge et al., Tan et al., and Liao et al. (Citation11,Citation13,Citation32).
Uric acid is often thought of as a marker of decreased kidney function. The vasoconstriction in PE leads to reduced renal blood flow which decreases the excretion of uric acid causing raised plasma levels (Citation33). Uric acid has also been shown to be involved in the pathogenesis of PE through attenuation of normal trophoblast invasion and spiral artery vascular remodeling. The elevated levels usually pre-dates the onset of clinical symptoms (Citation34).
Uric acid is included in prediction models for adverse pregnancy outcomes in studies by Lv et al. and Saleh et al. (Citation9,Citation33). In the last study, uric acid was one of the candidate markers, but not included in the final model, that instead included the protein to creatinine ratio, also related to kidney function. Maternal serum uric acid concentration has also been shown to be a good predictor of fetal/neonatal outcomes in women with PE/eclampsia (Citation35,Citation36).
High body mass index has been shown to have a strong correlation to PE, both severe and mild disease, likely mediated via inflammatory pathways and triglycerides (Citation37–39).
There was no significant difference at group level for BMI as a single parameter, indicating that high BMI itself is not a predictor for need of ICU, although BMI is a known risk factor for PE. Rather, it is BMI in combination with ASAT and uric acid that seems to lead to a higher risk for the need of ICU-treatment.
In comparison with other prediction models, our results show high predictability with few components. A combination of biomarkers and different clinical parameters have been used in several studies to predict adverse outcomes in PE. The clinical parameters are varying from lab parameters alone as in our study, to also involve ultrasound-Doppler measurements, demographic data, and patient history (Citation9,Citation11,Citation14). However, these models are more complex.
The sFlt/PIGF ratio is the most evaluated ratio of biomarkers for predicting adverse events in PE. In a study by Rana et al. the addition of the sFlt1/PlGF ratio to hypertension and proteinuria in patients presenting with PE before 34 gestational weeks, significantly improved the prediction for subsequent adverse outcome, with an area under the curve of 0.93 for hypertension, proteinuria, and sFlt1/PlGF, versus 0.84 for hypertension and proteinuria alone (Citation12). In contrast, the PEACOCK-study, showed that the angiogenic biomarkers did not add predictive value to the clinical parameters regarding appropriate time for delivery for women with late preterm PE (Citation40,Citation41).
In the study by Schmidt et al., 114 variables were included, among them biomarkers such as soluble fms-like tyrosine kinase-1 (S-Flt-1), PlGF, and sonography data (umbilical artery pulsatility index, middle cerebral artery pulsatility index, mean uterine artery pulsatility index) (Citation14). The outcome was the occurrence of adverse events throughout the remaining pregnancy and 2 weeks after delivery. By using machine learning an area under the receiver operating characteristic curve of 0.82 was reached, but this algorithm might still be too complex to implement clinically. More simple models using routine plasma biomarkers are therefore needed, especially in low- and middle-income countries.
A model with a clinical focus and the emphasis on clinical parameters is the full-PIERS model (preeclampsia integrated estimate of risk) (Citation42). The fullPIERS-model including gestational age, chest pain/dyspnea, oxygen saturation (SpO2), platelet count, creatinine, and aspartate transaminase, was developed (Citation42) to identify adverse events of PE within 48 h from hospital admission, and has been validated in several studies (Citation42–44). However, some parameters such av chest-pain, dyspnea and saturation was unfortunately not well documented in the records of our patient-cohorts for a full comparison. When evaluating the full-PIERS model a problem has been missing values of e.g., oxygen saturation (Citation8). The introduction of the Modified Early Obstetric Warning score (MEOWS) during the last years in Sweden might contribute to a more standardized way of documenting vital parameters in pregnant women, which could be useful, not only for medical reasons, but also for future research. Modified early obstetric warning scores have in previous studies been shown to be predictive of ICU-admissions and to reduce maternal morbidity. Additional larger studies are needed to validate them in the general obstetric population (Citation45).
Our intensive care cohort and PE controls consisted of “real-life patients” with early-onset, as well as late-onset PE. Unfortunately, the cohorts in this study were too small to analyze EPE and LPE separately. In the future it would be necessary to externally validate the model in the two separate PE-forms.
No angiogenic biomarkers were used in our model since they are not yet routinely used in Swedish obstetric care.
The only adverse outcome in our study was the actual need of intensive care treatment, independent of the underlying medical reason. Most studies, for example von Dadelszen et al. used specified outcomes such as maternal mortality or one or more severe central nervous system, cardiopulmonary, hepatic, renal, coagulation/blood dysfunction or obstetric adverse events (Citation42), which could be more specific since the level of care sometimes can be dependent on resources and individual medical decisions. However, all patients were admitted to ICU-departments in Southern Sweden, where access to high-dependency units for obstetric patients, as well as criteria for ICU-admission are similar. Sweden has 4.89 ICU-beds/100 000 citizens, which is amongst the lowest in Europe (Swedish Intensive Care Register) and the inclusion criteria for ICU-care are strict. Since PE is a very heterogenous disease, choosing ICU care or not as our main outcome, contributes to the avoidance of selection bias, and distinguish between severely ill patients needing continuous monitoring, compared to less ill patients possible to be managed at the delivery ward.
In a previous study, we analyzed the postpartum levels of the biomarkers hemopexin and alpha-1-microglobulin in the same ICU-cohort and found the levels to be lower in the severely ill patients as a sign of insufficient response to the oxidative stress, typically seen in PE (Citation46). These biomarkers were not included in our current model because they were collected when the patients already had deteriorated postpartum. Future studies will add these biomarkers to the model to see if the predictability is improved.
Neonatal outcome was not included in the prediction-model. As previously presented, there was significant difference in birthweight between the groups as well as the Apgar points at 5 min, but no difference in Apgar score at 1 min, and most important at ten minutes.
A strength in this study is the internal validation of the model and that the parameters used are available in most countries and hospital settings.
A weakness is the retrospective approach. However, this is the chosen study design in most studies trying to develop prediction models for adverse outcomes in PE. The reason for this is that the event rate is rare, and it would take a large number of patients and time to achieve enough power to reach statistical significances. A preselected data set divided in cases and controls can therefore boost the model accuracy. A weakness is also the small sample size, but the study can be seen as a pilot study, and an external validation of the model in a new larger prospective cohort is needed before clinical implementation.
Since the data set is small, it raises concerns about the model’s ability to be generalized. Small datasets can lead to overfitting and poor representation of the underlying patterns in the data. However, the XGBoost method includes multiple regularization techniques which reduce the risk of overfitting, such as shrinkage, subsampling, tree-pruning, and the typical L1 and L2 regularization. Furthermore, by employing the variable selection scheme described in the model development section, we reduce the number of variables, hence reducing the risk of overfitting.
To assess the model’s generalization ability, we used cross-validation, which estimates its performance. However, this scheme might lead to a bias toward the cross-validation sets, hence we include a test set to obtain a reliable estimate of the best-performing model generalization ability. In the case of significant overfitting, the test set results would be poor.
Conclusion
When using machine-based learning analysis on a “real-life patient-cohort” of intensive care patients with severe PE and PE controls, the best area under the curve for predicting intensive care need was generated by the parameters ASAT, uric acid together with BMI.
These are simple routine parameters available in most clinical settings that could help clinicians to have a greater preparedness for severe complications in PE.
Abbreviation
| PE | = | Preeclampsia |
| BMI | = | Body mass index |
| ASAT | = | Aspartate aminotransferase |
| ALAT | = | Alanine aminotransferase |
| SWECRIT biobank | = | Blood samples from critically ill patients and healthy controls in Sweden |
| HELLP | = | Hemolysis elevated liver enzymes low platelets |
| sFlt-1 | = | Soluble fms-like tyrosine kinase-1 |
| PIGF | = | Placental growth factor |
CRediT authorship contribution statement
Conceptualization: C.E., S.R.H.
Methodology: O.B., C.E., S.R.H.
Software: O.B.
Formal analysis: O.B., C.E.
Investigation: C.E., O.B.
Resources: C.E., O.B., S.R.H.
Data curation: O.B., C.E.
Writing – original draft preparation: C.E., O.B.
Writing – review and editing: all authors.
Visualization: C.E., L.E., S.R.H.
Supervision: S.R.H., L.E.
Project administration: C.E, S.R.H.
Highlights
A prediction model for estimating the risk of intensive care need in preeclampsia.
Machine learning found correlations not shown by traditional logistic regression .
The best parameters for predicting intensive care need were ASAT, uric acid and BMI.
Supplemental Material
Download MS Word (71.5 KB)Acknowledgments
This project was supported by the Gorthon Foundation, Helsingborg Hospital, Swedish ALF (Agreement concerning research and education of doctors), Swedish SUS Foundations and the Swedish Research Council (VR).
Disclosure statement
No potential conflict of interest was reported by the author(s).
Data availability statement
The datasets generated during and/or analyzed during the current study are available from the corresponding author on reasonable request.
Supplementary material
Supplemental data for this article can be accessed online at https://doi.org/10.1080/10641955.2024.2312165
Additional information
Funding
References
- Sarosh Rana EL, Granger JP, Ananth Karumanchi S. Preeclampsia pathophysiology, challenges and perspectives. Circ Res. 2019;124(7):1094–10. doi: 10.1161/CIRCRESAHA.118.313276
- Redman CWG, Staff AC, Roberts JM. Syncytiotrophoblast stress in preeclampsia: the convergence point for multiple pathways. Am J Obstet Gynecol. 2022;226(2):S907–s927. doi: 10.1016/j.ajog.2020.09.047
- Chaemsaithong P, Sahota DS, Poon LC. First trimester preeclampsia screening and prediction. Am J Obstet Gynecol. 2022;226(2):SS1071–SS1097.2. doi: 10.1016/j.ajog.2020.07.020
- Rolnik DL, Wright D, Poon LC, et al. Aspirin versus placebo in pregnancies at high risk for preterm preeclampsia. N Engl J Med. 2017;377(7):613–622. doi: 10.1056/NEJMoa1704559
- Fishel Bartal M, Sibai BM. Eclampsia in the 21st century. Am J Obstet Gynecol. 2022;226(2):S1237–S1253. doi: 10.1016/j.ajog.2020.09.037
- LA M, von Dadelszen P, Singer J. The CHIPS randomized controlled trial (control of hypertension in pregnancy study) is severe hypertension just an elevated blood pressure? Hypertens. 2016;68(5):1153–1159. doi: 10.1161/HYPERTENSIONAHA.116.07862
- Chappell LC, Brocklehurst P, Green ME, et al. Planned early delivery or expectant management for late preterm pre-eclampsia (PHOENIX): a randomised controlled trial. Lancet. 2019;394(10204):1181–1190. doi: 10.1016/S0140-6736(19)31963-4
- Sun F, Han B, Chen Y, et al. Development and external validation of a model for predicting adverse outcomes in women with preeclampsia: a retrospective study from two trans-regional centers in China. Pregnancy Hypertens. 2021;26:133–140. doi: 10.1016/j.preghy.2021.10.008
- Saleh L, Alblas MM, Nieboer D, et al. Prediction of pre-eclampsia-related complications in women with suspected or confirmed pre-eclampsia: development and internal validation of clinical prediction model. Ultrasound In Obstet & Gyne. 2021;58(5):698–704. doi: 10.1002/uog.23142
- Ngwenya S, Jones B, Mwembe D, et al. Development and validation of risk prediction models for adverse maternal and neonatal outcomes in severe preeclampsia in a low-resource setting, Mpilo central hospital, Bulawayo, Zimbabwe. Pregnancy Hypertens. 2021;23:18–26. doi: 10.1016/j.preghy.2020.10.011
- Dröge LA, Perschel FH, Stütz N, et al. Prediction of preeclampsia-related adverse outcomes with the sFlt-1 (soluble fms-like tyrosine kinase 1)/PlGF (placental growth factor)-ratio in the clinical routine: a real-world study. Hypertens. 2021;77(2):461–471. doi: 10.1161/HYPERTENSIONAHA.120.15146
- Rana S, Powe CE, Salahuddin S, et al. Angiogenic factors and the risk of adverse outcomes in women with suspected preeclampsia. Circulat. 2012;125(7):911–9. doi: 10.1161/CIRCULATIONAHA.111.054361
- Tan J, Yang M, Liao Y, et al. Development and validation of a prediction model on severe maternal outcomes among pregnant women with pre-eclampsia: a 10-year cohort study. Sci Rep. 2020;10(1):15590. doi: 10.1038/s41598-020-72527-0
- Schmidt LJ, Rieger O, Neznansky M, et al. A machine-learning–based algorithm improves prediction of preeclampsia-associated adverse outcomes. Am J Obstet Gynecol. 2022;227(1):.e77.1–.e77.30. doi: 10.1016/j.ajog.2022.01.026
- Handelman GS, Kok HK, Chandra RV, et al. eDoctor: machine learning and the future of medicine. J Intern Med. 2018;284(6):603–619. doi: 10.1111/joim.12822
- Ramakrishnan R, Rao S, He JR. Perinatal health predictors using artificial intelligence: a review. Womens Health. 2021;17:17455065211046132. doi: 10.1177/17455065211046132
- Manoochehri Z, Manoochehri S, Soltani F, et al. Predicting preeclampsia and related risk factors using data mining approaches: a cross-sectional study. Int J Reprod BioMed. 2021;19(11):959–968. doi: 10.18502/ijrm.v19i11.9911
- Li YX, Shen XP, Yang C, et al. Novelelectronic health records applied for prediction of pre-eclampsia: machine-learning algorithms. Pregnancy Hypertens. 2021;26:102–109. doi: 10.1016/j.preghy.2021.10.006
- Sufriyana H, Wu YW, Su EC. Prediction of preeclampsia and intrauterine growth restriction: development of machine learning models on a prospective cohort. JMIR Med Inform. 2020;8(5):e15411. doi: 10.2196/15411
- Sufriyana H, Wu YW, Su EC. Artificial intelligence-assisted prediction of preeclampsia: development and external validation of a nationwide health insurance dataset of the BPJS kesehatan in Indonesia. EBioMedicine. 2020;54:102710. doi: 10.1016/j.ebiom.2020.102710
- Marić I, Tsur A, Aghaeepour N, et al. Early prediction of preeclampsia via machine learning. Am J Obstet Gynecol MFM. 2020;2(2):100100. doi: 10.1016/j.ajogmf.2020.100100
- Sandström A, Snowden JM, Höijer J, et al. Clinical risk assessment in early pregnancy for preeclampsia in nulliparous women: a population based cohort study. PloS One. 2019;14(11):e0225716. doi: 10.1371/journal.pone.0225716
- Jhee JH, Lee S, Park Y, et al. Prediction model development of late-onset preeclampsia using machine learning-based methods. PloS One. 2019;14(8):e0221202. doi: 10.1371/journal.pone.0221202
- Brown MA, Magee LA, Kenny LC, et al. The hypertensive disorders of pregnancy: ISSHP classification, diagnosis & management recommendations for international practice. Pregnancy Hypertens. 2018;13:291–310. doi: 10.1016/j.preghy.2018.05.004
- Tranquilli AL, Brown MA, Zeeman GG, et al. The definition of severe and early-onset preeclampsia. Statements from the international society for the study of hypertension in pregnancy (ISSHP). Pregnancy Hypertens. 2013;3(1):44–47. doi: 10.1016/j.preghy.2012.11.001
- Lundberg SM, Lee SI. A unified approach to interpreting model predictions. Proceedings of the 31st international conference on neural information processing systems; Long Beach, California, USA: Curran Associates Inc.; 2017. p. 4768–4777.
- Akiba T, Sano S, Yanase T, et al. Optuna: a next-generation hyperparameter optimization framework. Proceedings of the 25th ACM SIGKDD International Conference on Knowledge Discovery & Data Mining. Anchorage, AK, USA: Association for Computing Machinery; 2019. p. 2623–2631.
- James Bergstra RB, Bengio Y, Kégl B. Algorithms for hyper-parameter optimization. Proceedings of the 24th International Conference on Neural Information Processing Systems (NIPS’11). Curran Associates Inc: Red Hook, NY, USA; 2011. p. 2546–2554.
- Chen T, Guestrin C. Xgboost: a scalable tree boosting system. 2016. doi: 10.1145/2939672.2939785.
- Lind T, GODFREY KA, OTUN H, et al. Changes in serum uric acid concentrations during normal pregnancy. Br J Obstet Gynaecol. 1984;91(2):128–132. doi: 10.1111/j.1471-0528.1984.tb05895.x
- Dacaj R, Izetbegovic S, Stojkanovic G, et al. Elevated liver enzymes in cases of preeclampsia and intrauterine growth restriction. Med Arch. 2016;70(1):44–47. doi: 10.5455/medarh.2016.70.44-47
- Liao Y, Liu XH, Tan J, et al. Development of a predictive model for adverse outcomes of preeclampsia. Sichuan Da Xue Xue Bao Yi Xue Ban. 2018;49(5):797–802.
- Lv B, Zhang Y, Yuan G, et al. Establishment of a nomogram model for predicting adverse outcomes in advanced-age pregnant women with preterm preeclampsia. Bmc Pregnancy Childbirth. 2022;22(1):221. doi: 10.1186/s12884-022-04537-x
- Bainbridge SA, Roberts JM, von Versen-Höynck F, et al. Uric acid attenuates trophoblast invasion and integration into endothelial cell monolayers. Am J Physiol Cell Physiol. 2009;297(2):C440–50. doi: 10.1152/ajpcell.00593.2008
- Le TM, Nguyen LH, Phan NL, et al. Maternal serum uric acid concentration and pregnancy outcomes in women with pre-eclampsia/eclampsia. Int J Gynaecol Obstet. 2019;144(1):21–26. doi: 10.1002/ijgo.12697
- Livingston JR, Payne B, Brown M, et al. Uric acid as a predictor of adverse maternal and perinatal outcomes in women hospitalized with preeclampsia. J Obstet Gynaecol Can. 2014;36(10):870–877. doi: 10.1016/S1701-2163(15)30435-7
- Bodnar LM, Catov JM, Klebanoff MA, et al. Prepregnancy body mass index and the occurrence of severe hypertensive disorders of pregnancy. Epidemiol. 2007;18(2):234–9. doi: 10.1097/01.ede.0000254119.99660.e7
- Sohlberg S, Stephansson O, Cnattingius S, et al. Maternal body mass index, height, and risks of preeclampsia. Am J Hypertens. 2012;25(1):120–125. doi: 10.1038/ajh.2011.175
- Bodnar LM, Ness RB, Harger GF, et al. Inflammation and triglycerides partially mediate the effect of prepregnancy body mass index on the risk of preeclampsia. Am J Epidemiol. 2005;162(12):1198–1206. doi: 10.1093/aje/kwi334
- Duhig K, Seed PT, Placzek A, et al. A prognostic model to guide decision-making on timing of delivery in late preterm pre-eclampsia: the PEACOCK prospective cohort study. Health Technol Assess. 2021;25(30):1–32. doi: 10.3310/hta25300
- Duhig KE, Seed PT, Placzek A, et al. Prognostic indicators of severe disease in late preterm pre-eclampsia to guide decision making on timing of delivery: The PEACOCK study. Pregnancy Hypertens. 2021;24:90–95. doi: 10.1016/j.preghy.2021.02.012
- von Dadelszen P, Payne B, Li J, et al. Prediction of adverse maternal outcomes in pre-eclampsia: development and validation of the fullPIERS model. Lancet. 2011;377(9761):219–27. doi: 10.1016/S0140-6736(10)61351-7
- Guida JP, Cralcev C, Costa Santos J, et al. Validation of the fullPIERS model for prediction of adverse outcomes in preeclampsia at a referral center. Pregnancy Hypertens. 2021;23:112–115. doi: 10.1016/j.preghy.2020.11.013
- Ukah UV, Payne B, Hutcheon JA, et al. Assessment of the fullPIERS risk prediction Model in women with early-onset preeclampsia. Hypertension. 2018;71(4):659–665. doi: 10.1161/HYPERTENSIONAHA.117.10318
- Robbins T, Shennan A, Sandall J. Modified early obstetric warning scores: a promising tool but more evidence and standardization is required. Acta Obstet Gynecol Scand. 2019;98(1):7–10. doi: 10.1111/aogs.13448
- Edvinsson C, Hansson E, Nielsen N, et al. Intensive care patients with preeclampsia – clinical risk factors and biomarkers for oxidative stress and angiogenic imbalance as discriminators for severe disease. Pregnancy Hypertens. 2022;30:88–94. doi: 10.1016/j.preghy.2022.08.005