
Abstract
We designed Value Awareness Measurement (VAM) to know how much design students know about human values and how they estimate their awareness of this concept. VAM is a questionnaire with four scales: Scale-1: participants’ self-report about being aware of human values, Scale-2: participants’ general knowledge about human values, Scale-3: participants’ value awareness, and Scale-4: participants’ opinions about the importance of human value awareness in everyday life. To test VAM, we used this questionnaire before and after an introductory workshop about human values with HuValue tool. The results showed a significant effect of the workshop on three out of four scales, which means our questionnaire can measure human value awareness.
Introduction
The ethical qualities of the design process and designed artifacts have increasingly drawn attention in recent decades (e.g. Nissenbaum and Walker Citation1998; Mehalik and Gorman Citation2006; Coeckelbergh Citation2006; Swierstra and Jelsma Citation2006; Shilton Citation2012; Steen Citation2015; JafariNaimi Citation2018; Kudina and Verbeek Citation2018; Brey Citation2018; Voinea Citation2018; Nelson and Gorichanaz Citation2019). In this respect, human value is a fundamental concept. According to Rokeach (Citation1973, p. 5), value is “an enduring belief that a specific mode of conduct or end-state of existence is personally or socially preferable to an opposite or converse mode of conduct or end-state of existence.” Human values guide human actions and behavior in daily situations and express basic human needs. Values have a vital motivational component because they refer to desirable goals. Values serve as standards and criteria, and value systems are general plans employed to resolve conflicts and make decisions. Indeed, the employment of values as standards is a fundamental difference between human and nonhuman (Rokeach Citation1973, pp. 3–25). Several instruments such as Types of Men by Spranger (Hague Citation1968), Scale of the Allport-Vernon-Lindzey (Hunt Citation1968), Rokeach (Citation1973) Value Survey, Value Orientation Method by Kluckhohn (Gallagher Citation2001), Values Survey Module by Hofstede (Hofstede, Hofstede, and Minkov Citation2010), World Values Survey by Inglehart (Citation2000), the Portrait Value Questionnaire by Schwartz (Citation2012), Values in Action Inventory of Strengths by Peterson and Seligman (Citation2004), are designed as predictors of value relevant attitudes and behavior.
The importance of human values in technology and design education is well established, (e.g. Barlex Citation1993; Breckon Citation1998; Coles and Norman Citation2005; Conway Citation1994; Conway and Riggs Citation1994; Dakers Citation2005; de Vries Citation2005; Elshof Citation2005; Holdsworth and Conway Citation2009; Järvinen and Rasinen Citation2015; Layton Citation1991; Martin Citation2002; McLaren Citation1997; Middleton Citation2005; Pavlova Citation2009; Prime Citation1993; Rekus Citation1991; Tungaraza and Sutherland Citation2005). However, less attention has been given to developing educational materials for the role values play in design (Eriksson et al. Citation2022). By considering students as future citizens with influential professions, these studies noted the responsibility of teachers to raise their awareness about different types of values in life (Conway Citation1994). Pavlova (Citation2009) has already emphasized the role of values for decision-making, value judgments, and evaluation in design as a complex intellectual activity (see also (Rauterberg Citation2017)). Although Berkowitz (Citation2011) describes value awareness in education, he concentrates mainly on character development, while we are interested in the change process of value awareness of individual design students.
Meynhardt and Fröhlich (Citation2019) focus on value awareness and define this as a cognitive competence that helps recognize how and for whom value is genuinely created (Meynhardt and Fröhlich Citation2019). Further, Fröhlich (Citation2019) investigated and started to measure value awareness. “Formal definiert beschreibt Wertbewusstsein die Fähigkeit, eine bestimmte Wertkategorie aus der Public Value Matrix in Bewertungsprozessen als (potentiell) relevant zu erkennen [translated into English by authors: a formal definition describes value awareness as the ability to recognize certain value categories from the Public Value Matrix in evaluation processes as (potentially) relevant” (Fröhlich Citation2019, pp. 123–124). While Fröhlich seems to aim for a trait measure, we are looking for a sensitive state measure of value awareness (Hintz, Geiser, and Shiffman Citation2019).
Considering the importance of knowledge about human values in design education, besides the insufficient hands-on learning/teaching activities, we noticed the need for a state measure instrument to measure the influence and succession of this kind of learning/teaching activities. So, we executed an introductory workshop about human values with our HuValue tool for teaching primary knowledge about human values (Kheirandish Citation2018). HuValue is a design tool based on our most comprehensive value framework (Kheirandish et al. Citation2020b). Generally, the HuValue tool is a means of facilitating thinking about and discussing human values. Furthermore, this tool supports designers with simple but familiar materials during their design process to analyze everything (object/subject/situation) from a wide value point of view (Kheirandish et al. Citation2020b). More details about the tool and its components can be found in Kheirandish and Rauterberg (Citation2018) and (Kheirandish et al. (Citation2019) and (Kheirandish and Rauterberg Citation2020). To investigate whether this workshop as a teaching activity can raise students’ awareness about human values or not, we developed our Value Awareness Measurement (VAM) as a questionnaire with four scales and a combination of subjective and objective approaches (see the questionnaire in the Appendix). Each scale addressed one of the following four sub-questions.
Overall research question: Is a workshop with the HuValue tool capable of raising awareness about human values?
Whether participants’ self-reports about being aware of human values would change from before to after the workshop?
Would participants’ general knowledge of human values change from before to after the workshop?
Whether participants’ value awareness would change from before to after the workshop?
Would participants’ opinions about the importance of human value awareness in everyday situations change from before to after the workshop?
Methodology
Participants
Forty-eight first-year design students (12 project groups) were randomly selected and invited to participate in a workshop (ws) about human values. 42 out of 48 invited students were present in the workshop and answered the VAM questionnaire just before starting (pre-ws). The test was repeated a week after (post-ws) with the same participants, in which all participants, except two, did the questionnaire again. Consequently, those two pre-ws participants’ data were excluded from further analysis. According to the collected data, 67.5% of participants were female, and 32.5% were male. Eighty percent of the participants were Dutch, and their mean age was 19.07 (SD = 1.33), varying from 17 to 24, of whom 85% had heard about human values before.
Design
To answer the research question, we planned a workshop to introduce the HuValue tool and allow them to use it via some playful activities. In addition, the questionnaire VAM was developed to measure students’ awareness of human values before (pre) and after (post) the workshop (ws) (McCoach, Gable, and Madura Citation2013). The questionnaire was distributed among participants twice.
Procedure
Dependent variables (DV) in this study were (DV1) self-report-statements for the first scale, (DV2) test-statements for the second scale, (DV3) words for the third scale, and (DV4) everyday-life’s-situations for the fourth scale. Independent variables (IV) in this survey were specified as (IV1) pre/post-workshop for all scales, (IV2) correct/incorrect for the second scale, and (IV3) value/non-value and Groups of words for the third scale.
First scale (DV1): self-report-statements
The first scale of the questionnaire contained five statements about participants’ attitudes toward learning and thinking about human values. Students were supposed to pinpoint how much they agree or disagree with each statement on a five-point Likert-type scale, “strongly disagree” (−2), “disagree” (−1), “neutral” (0), “agree” (1) and “strongly agree” (2).
Second scale (DV2): test-statements and correct/incorrect
The second scale of the questionnaire included nine correct/incorrect test-statements in general knowledge about the nature of human values. Five were correct, and four were incorrect statements. The five-point rating scale was applied to rank the agreement with each statement’s correctness, from “strongly disagree” to “strongly agree.”
Third scale (DV3): words, value/non-value, and groups of words
The third scale of the questionnaire was a question about value awareness, in which participants were supposed to distinguish human values from non-values. In this section, 40 words, a mixture of human values and non-values (words), were given multiple options, and participants were asked to tick mark human values. The words were presented as a mixture and without any labels. However, for the data analysis, we clustered them, as 24 of those words were human values, and 16 of them were not human values (value/non-value). The human values included 16 key values from HuValue tool (eight “simple-values” and eight “complex-values”) and eight “extra-values” from the existing lists of values. The non-values included eight “complex-words,” which looked like values, and eight “simple-words” (Groups of words).
Fourth scale (DV4): everyday-life’s-situations
The fourth scale of the questionnaire was a question about the importance of human values in everyday-life’s-situations, with eight given situations. The importance of each situation had to be ranked on a five-point Likert-type scale, “Not important at all” (−2), “Not very important” (−1), “Neutral” (0), “Important” (1) and “Very important” (2).
All scales (IV1): pre/post-workshop
VAM was conducted twice, before (pre-ws) and after (post-ws) the workshop, to compare the results and study the capability of our workshop for raising awareness about human values.
In this study, to reduce systematic errors, we fixed the location so that the pre-test measures, the workshop, and also the post-test measures were conducted in the same lecture room. To increase the reliability of the VAM questionnaire, instead of a yes/no scale, we used a five-point Likert-type scale with balanced keying (an equal number of positive and negative statements) and a clear label for each step (Preston and Colman Citation2000). An anonymous questionnaire with an arbitrary student number rather than a name was used to reduce social pressure and desirability bias. In addition, regarding the internal consistency of the VAM questionnaire, a reliability analysis was carried out on the perceived task values scale comprising 30 questions. Cronbach’s alpha indicated the questionnaire reached acceptable reliability, α = 0.702 (Taber Citation2017). Also, the significant difference in pre-test and post-test (F(1, 34) = 21.189, p ≤ 0.001) can demonstrate good construct validity of the questionnaire (Dimitrov and Rumrill Citation2003). Considering the replicability of this study, a full version of the VAM questionnaire is available in the Appendix. The following is the procedure for conducting our workshop: The workshop contained six phases: (1) a questionnaire, (2) a brief lecture, (3) a group activity, (4) a coffee break, (5) an individual activity, and (6) a discussion.
In the beginning, after introducing the workshop, we asked participants to fill in the VAM questionnaire (pre-ws). In continuation, we introduced human values briefly and simply with some examples. By mentioning some important points about human values from the second scale of the questionnaire, we stressed the significance of human values in design. Then we introduced the tool and its components in short.
Afterward, we asked them to play a group game with the tool in their project groups (See the description in the Appendix). The main points of the group activity were to give the students a chance to review different parts of the tool and to get familiar with the details; nine groups of values, value words, picture cards, and so forth. In addition, they were supposed to discuss value words and groups of values and their connections with the picture cards as examples in their groups. This activity motivated them to go over the words, groups, and examples, understand them and link them together. It also raised participants’ awareness about their different and similar opinions and gave them a chance to know there are various views on the same topics. The activity had two parts: (1) Group discussion and (2) Group game. The purpose of the first part was to warm up, in which students were supposed to review a small number of picture cards (27 cards) and find their relevance to the values. In the second part, they had 180 picture cards (pre-shuffled and divided into four: 45 cards for each player) and were asked to do the same but in a more structured way. In each part, we explained to them what they should do, step by step, while a descriptive text with an expressive animation was showing on a slide.
Next, after a break, we gave each participant a toolkit and asked them to use it to make their value board (See the description in the Appendix). The primary purpose of this individual activity was to let them think deeply about themselves and explain and visualize their value system via the HuValue tool, which is supposed to help define their vision. They were gradually asked to find their essential values (value words) and their important activities (picture cards) and assign them to relevant groups of values. The activity had six steps. They had enough time to finish each step and start the next step together. In addition, for this activity, each student had enough space (a table) to make their own value-board, which was saved at the end as pictures to be printed later. To conclude the activities, by pointing to their values board as examples, we showed them how this visualization could help them to reflect on their value system and highlight their essential values.
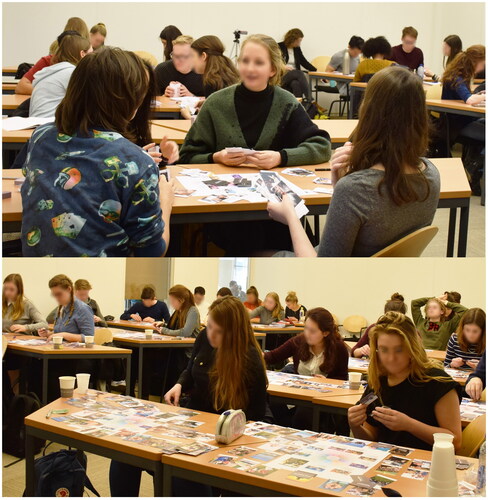
In the end, we had time for discussion and asking questions. Furthermore, a week after the workshop, the participants received their posters of value boards and filled out the VAM questionnaire for the second time (post-ws). Some captured moments of main phases of the workshop including group activity and individual activity are presented in .
Figure 1. The Introduction workshop: Human values in Design. Top: Group activity: Play game. Bottom: Individual activity: Make your value-board.
Results
Besides demographic questions, the VAM questionnaire contained four main scales. In this part, we present the results of repeated measures ANOVA, which was conducted to compare the effect of the workshop on students’ awareness of human values before and after the workshop. The results of each questionnaire scale are presented separately in tables and figures.
The First Scale was a self-report about participants’ awareness of human values. The results showed significant main effects of self-report-statements (F(4, 156) = 13.903, p < 0.001), and a significant interaction of pre/post-workshop and self-report-statements (F(4, 156) = 9.198, p < 0.001)). The main effect of the pre/post-workshop in this test was not significant. From , we can see that there are linear, quadratic, and fourth-order significant contrasts between self-reports statements. In addition, the data suggested quadratic, cubic and fourth-order significant contrasts between pre/post-workshop and self-report-statements. These contrasts are visualized at the top and middle of .
Figure 2. Visualization for results of the analysis of scale two. Significant interactions of pre/post-workshop and Self-report-statements are illustrated in two ways: Top: pre/post-workshop as the horizontal axis and Self-report-statements as separate lines. Middle: Self-report-statements as the horizontal axis and pre/post-workshop as separate lines. Bottom: Descriptive analysis of each self-report-statements after pooling data of pre-ws and post-ws.
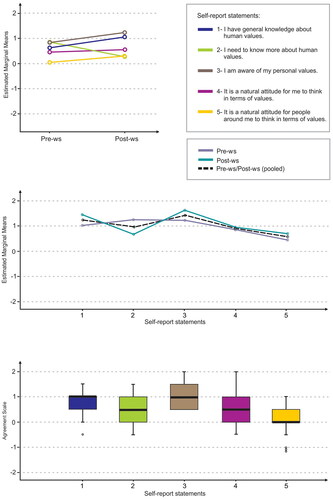
Table 1. Results of the statistical analysis repeated measures ANOVA on scale one: Within-Subjects Contrasts of pre/post-workshop and self-report-statements.
Post-hoc tests using the Bonferroni correction revealed that “I-am-aware-of-my-personal-values” (M = 1.02, SD = 0.42) was rated significantly higher than “It-is-a-natural-attitude-for-me-to-think-in-terms-of-values” (M = 0.50, SD = 0.76), (p < 0.001), “It-is-a-natural-attitude-for-people-around-me-to-think-in-terms-of-values” (M = 0.16, SD = 0.58), (p < 0.001) and “I-need-to-know-more-about-human-values” (M = 0.56, SD = 0.56), (p = 0.003). In addition, “I-have-general-knowledge-about-human-values” (M = 0.83, SD = 0.44) was rated significantly higher than “It-is-a-natural-attitude-for-people-around-me-to-think-in-terms-of-values” (M = 0.16, SD = 0.58), (p < 0.001).
Furthermore, the statistical analysis paired-sample t-test on each self-report-statements from before (pre-ws) and after the workshop (post-ws) was conducted to explore the interaction of self-report-statements and pre/post-workshop. The results in indicate that students’ agreement with two self-report-statements had significantly changed after the workshop; “I-need-to-know-more-about-human-values” and “I-am-aware-of-my-personal-values.” In this part, “I-need-to-know-more-about-human-values” had the greatest change. This change was negative and indicated that fewer participants felt the need to know more about human values after the workshop. In addition, the number of participants who reported they were aware of their personal values significantly increased after the workshop.
Table 2. Results of the statistical analysis paired-sample t-test on scale one; pairwise comparisons of self-report-statements and pre/post-workshop.
The Second Questionnaire Scale measured general knowledge about human values, including five correct and four incorrect statements. To make correct and incorrect test-statements equal, we randomly selected one of the correct statements and put it out of the test. As presented in , analyzing the data indicated significant main effects of correct/incorrect and pre/post-workshop. In this case, significant interaction effects between pre/post-workshop and correct/incorrect and correct/incorrect and test-statements were found.
Table 3. Results of the statistical analysis repeated measures ANOVA on scale two: Within-Subjects Contrasts of pre/post-workshop, correct/Incorrect and test-statements.
shows that in this scale, the linear contrast of pre/post-workshop, correct/incorrect, and pre/post-workshop vs. correct/incorrect is significant. In addition, the data suggest linear, quadratic, and cubic significant contrasts between correct/incorrect and test-statements. These contrasts are visualized at the top and middle of . This figure at the bottom presents the results of the descriptive analysis of each test-statement after pooling data of pre-ws and post-ws.
Figure 3. Visualization for results of the analysis of scale two. Top: Significant main effect of correct/incorrect. Middle-left: Significant main effect of pre/post-workshop and a significant interaction of pre/post-workshop with correct/incorrect; pre/post-workshop as the horizontal axis and correct/incorrect as separate lines. Middle-right: Significant interaction of correct/incorrect with test-statements; test-statements as the horizontal axis and correct/incorrect as separate lines. Bottom: Descriptive analysis of each test-statements after pooling data of pre-ws and post-ws.
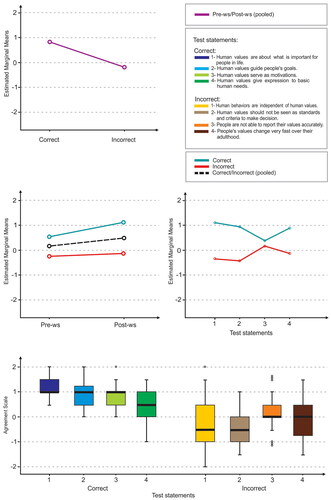
In addition, an overall significant change of correct versus incorrect statements was found; correct/incorrect (MCor = 0.84, SD = 0.32 and MInc = − 0.18, SD = 0.53). As a post-hoc, results of the statistical analysis paired-sample t-test on overall correct statements and overall incorrect statements versus pre-ws and post-ws showed a significant difference in overall correct statements before and after the workshop (). This means students’ agreement with correct statements was considerably raised after the workshop. However, their answers to incorrect statements did not change significantly.
Table 4. Results of the statistical analysis paired-sample t-test on scale two; Pairwise comparisons of Correct/incorrect versus pre/post-workshop. This test significantly differed in overall correct statements before and after the workshop.
The Third Scale of the questionnaire was about the distinction between human values out of 40 words; Twenty-four of them were human values, and 16 of them were not human values. The human values included 16 key values from HuValue tool (eight “simple-values” and eight “complex-values”) and eight “extra-values” (from the existing lists of values), and the non-values included eight “complex-words” (look like values) and eight “simple-words.”
Excluding “extra-values” and running repeated measurement ANOVA on the data of values (simple and complex) versus non-values (simple and complex) from before and after the workshop showed () significant main effects of pre/post-workshop, value/non-value and words. In addition, significant interactions between pre/post-workshop and value/non-value, pre/post-workshop and words, value/non-value and simple/complex, value/non-value and words, simple/complex and words, pre/post-workshop, value/non-value and words, pre/post-workshop, simple/complex and words, value/non-value, simple/complex and words and pre/post-workshop, value/non-value, simple/complex and words were found.
Table 5. Results of the statistical analysis of repeated measures ANOVA on scale three; Within-subjects effects of the pre/post-workshop, value/non-value, simple/complex, and words.
The results also show that in this scale, the linear contrasts of the pre/post-workshop, value/non-value, pre/post-workshop vs. value/non-value, and value/non-value vs. simple/complex were significant. In addition, the data suggested linear (F(1, 39) = 6.245, p = 0.017), quadratic (F(1, 39) = 7.246, p = 0.010), cubic (F(1, 39) = 20.331, p < 0.001), order 4 (F(1, 39) = 9.265, p = 0.004), order 5 (F(1, 39) = 25.055, p < 0.001), and order 7 (F(1, 39) = 17.535, p < 0.001) significant contrasts between words. More significant contrasts of the pre/post-workshop with words, value/non-value and words, simple/complex and words, pre/post-workshop with value/non-value and words, pre/post-workshop with simple/complex and words, value/non-value with simple/complex and words, and pre/post-workshop with value/non-value, simple/complex and words are visualized in and .
Figure 4. Visualisation for results of the analysis of scale three. Top: Significant main effect of pre/post-workshop and a significant interaction of pre/post-workshop with value/non-value; pre/post-workshop as the horizontal axis and value/non-value as separate lines. Middle: Significant main effect of value/non-value and significant interaction of value/non-value with simple/complex; value/non-value as horizontal axis and simple/complex as separate lines. Bottom–left: Significant interaction of pre/post-workshop with value/non-value and words. Bottom–right: Significant interaction of value/non-value with simple/complex and words.
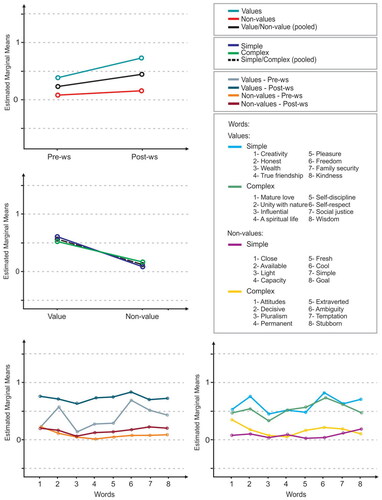
Figure 5. A significant interaction of pre/post-workshop with words; Words as the horizontal axis and pre/post-workshop as separate lines.
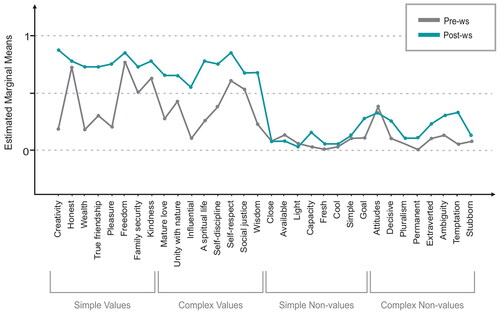
Results of post-hoc tests using the statistical analysis paired-sample t-test for pairwise comparisons of value/non-value and pre/post-workshop and value/non-value and simple/complex are presented in . These results revealed that selecting values students changed significantly after the workshop. However, this test did not show a significant difference in non-values. According to the results, before and after the workshop, the tick marks for values and non-values were significantly different; pre-ws, post-ws. In addition, students’ answers for simple and complex-values and also for simple and complex non-values were significantly different; values and non-values. However, simple-values vs. simple non-values and complex-values vs. complex non-values were also significantly different; simple and complex. These results showed that after the workshop students selected values significantly more than before (MPre = 0.39, SD = 0.20 and MPost = 0.74, SD = 0.24). In this case, simple-values were selected more than complex-values (MSim = 0.60, SD = 0.21 and MCom = 0.52, SD = 0.22), and also simple non-values were selected more than complex non-values (MSim = 0.16, SD = 0.12 and MCom = 0.08, SD = 0.12).
Table 6. Results of the statistical analysis paired-sample t-test on scale three; Pairwise comparisons of value/non-value and pre/post-workshop and also value/non-value and simple/complex.
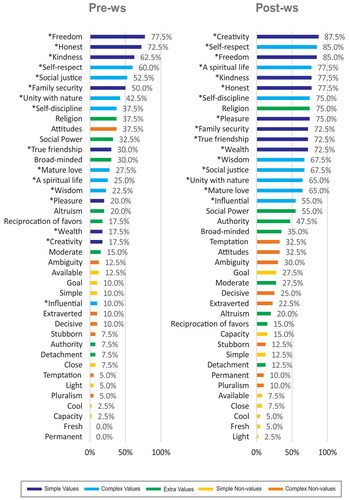
Further tests on pairwise comparisons of value words and pre/post-workshop revealed that selecting 9 out of 16 value words (simple and/or complex) raised significantly; “creativity” had the greatest change (t(39) = −9.539, p < 0.001) and “wealth” (t(39) = −6.904, p < 0.001), “pleasure” (t(39) = −6.297, p < 0.001) and “a spiritual life” (t(39) = −5.992, p < 0.001), “Influential” (t(39) = −5.152, p < 0.001), “wisdom” (t(39) = −5.152, p < 0.001), “true friendship” (t(39) = −5.369, p < 0.001), “mature love” (t(39) = −4.392, p < 0.001) and “self-discipline” (t(39) = −3.553, p < 0.001) were next.
The percentage of selecting words (Including all groups of words: Simple-values, complex-values, extra-values, simple non-values, and complex non-values) as human values by participants before and after the workshop are illustrated in . This figure shows that in post-ws, all simple and complex-values were recognized clearly more and got more tick marks than other words, and only “religion” (an extra value) came in between. This figure also indicates significant value changes from before to after the workshop. For instance, “creativity” moved from 21st to first place, “a spiritual life” raised from 15th to fourth place, and “attitude,” which is not a value, fell from 10th to 22nd place. On the other hand, in this case, “honest,” “freedom,” and “kindness,” which were recognized highly before the workshop, did not change considerably.
Figure 6. Percentage of selecting words as human values by participants before and after the workshop (Left: pre-ws, Right: post-ws); All groups of words are included; simple-values, complex-values, extra-values, simple non-values, and complex non-values. *Simple-values and Complex-values
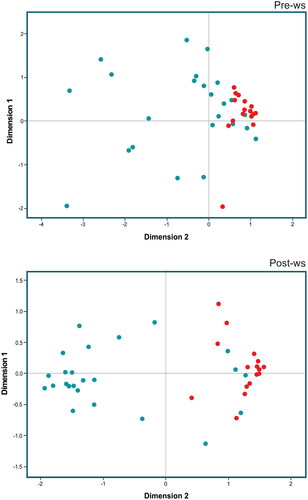
Moreover, to reduce the complexity, we applied multidimensional scaling with Euclidean distance measure to visualize the data from before (pre-ws) and after (post-ws) the workshop. The stress value of pre-ws for the two-dimensional solution was 0.024, and the stress value of post-ws for the two-dimensional solution was 0.015. These indicated an excellent fit of both models for a two-dimensional solution, and post-ws model was fitter than pre-ws (Kruskal Citation1964). In these cases, dimension one can be defined as values/non-values (left/right), and dimension two can be defined as simple/complex (top/bottom). Comparing the results presented in indicates that the pattern of proximities of human values words and non-values words meaningfully changed. In fact, in post-ws, the distribution of human values words and non-values words between two dimensions made two clear groups, which is not visible in pre-ws.
Figure 7. Two-dimensional configuration of selected words as human values; each green dot represents one value, and each red dot is one non-value. Top: pre-workshop configuration. Bottom: post-workshop configuration.
The Fourth Scale of the questionnaire asked about the importance of human value awareness in everyday-life’s-situations. In this scale the main effect of everyday-life’s-situations (F(7, 245) = 16.553, p < 0.001) and pre/post-workshop (F(1, 35) = 13.744, p ≤ 0.001) were significant. However, any significant interaction effect between these two variables was not found. From , we can see that there is a significant linear contrast in pre/post-workshop. In addition, the data suggested order 4, order 5, order 6 and order 7 significant contrasts between everyday-life’s-situations. These contrasts are visualized at the top and in the middle of . This figure at the bottom presents the results of the descriptive analysis of each everyday-life’s-situations after pooling data from pre-ws and post-ws.
Figure 8. Visualisation for results of the analysis of scale four. Top: Significant main effect of pre/post-workshop. Middle: Significant main effect of everyday-life’s-situations. Bottom: Descriptive analysis of each everyday-life’s-situations after pooling data of pre-ws and post-ws.
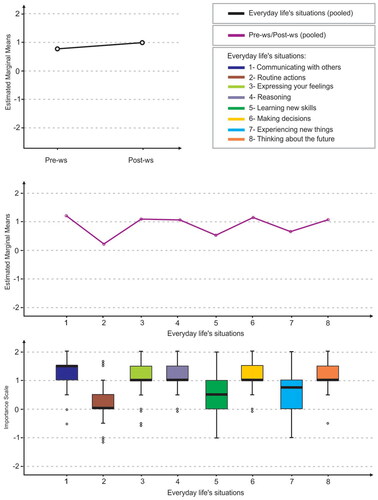
Table 7. Results of the statistical analysis repeated measures ANOVA on scale four: Within-Subjects Contrasts of pre/post-workshop and everyday-life’s-situations.
According to the results, the overall importance of human value awareness for students in everyday-life’s-situations raised significantly from before to after the workshop (MPre = 0.79, SD = 0.31 and MPost = 0.98, SD = 0.41). Additionally, “Communicating-with-others” (M = 1.24, SD = 0.55) was the most and “Routine-actions” (M = 0.24, SD = 0.69) was the least important situation in human value awareness. Post-hoc tests using the Bonferroni correction revealed that three everyday-life’s-situations were considerably different from the others; “Routine-actions” was significantly different from “Communicating-with-others” (p < 0.001), “Expressing-your-feelings (p < 0.001), “Reasoning” (p < 0.001), “Making-decisions” (p < 0.001) and “Thinking-about-the-future” (p < 0.001). “Learning-new-skills” was significantly different from “Communicating-with-others” (p = 0.004), “Expressing-your-feelings” (p = 0.025), “Reasoning” (p = 0.003), “Making-decisions” (p < 0.001) and “Thinking-about-the-future” (p = 0.011). “Experiencing-new-things” was significantly different from “Communicating-with-others” (p = 0.021), “Reasoning” (p = 0.014), “Making-decisions” (p = 0.006) and “Thinking-about-the-future” (p = 0.007).
Discussion
In the presented research, we studied how to measure the human value awareness of design students. To achieve this goal, we executed a workshop as a learning/teaching activity and developed a questionnaire to investigate whether the workshop helps raise awareness about human values.
The results indicated that students primarily have heard about human values from their family, school, and media. However, they did not receive education on this issue. As we observed during the workshop and the results of the questionnaires approved, on the one hand, they knew what human values mean, but they did not have knowledge about the nature and function of human values. On the other hand, they knew just a few examples of human values, such as “honest,” “freedom,” and “self-respect.” However, they did not have a comprehensive perspective on various dimensions of human values.
The workshop was designed based on the assumption that trying to find relations between value words and picture cards of activities, products, and personas via a playful group activity would be helpful to review and know value words and think about their relationship with everyday life. The study showed that the number of value words recognized by the students was meaningfully raised after those activities. In addition, they distinguished significantly more human values from non-values after the workshop.
The workshop had two main parts: an introductory, theoretical, abstract, and verbal presentation about human values, and the other contained two participatory, practical, and playful activities. In the first part, we described human values and their role in human life simply and briefly (around 10 min), and in the second part, participants did some playful activities with value words and their examples (about 90 min). We did not intend to teach students about human values with the workshop, but we wanted to attract their attention to this concept and help them think more this term. So, we just briefly reviewed human values, and we did not emphasize distinguishing between values and non-values since we expected that participants could easily distinguish them afterward. However, selecting non-values such as “Attitude,” “Goal,” and “Temptation” by around 30% of students in post-ws showed that more stress on differences between values and non-values is necessary. In addition, negative changes of incorrect statements such as “Human behaviors are independent of human values” and “Human values should not be seen as standards and criteria to make decisions” approved that mentioning some facts per se would not be enough to grow general knowledge about human values. In other words, on the one hand, we were not firm enough in stating what human values are not and what is wrong with human values. On the other hand, students did not pay enough attention to the theoretical part, as they did not expect a test after the workshop.
Overall, the results from VAM and our observation during the workshop strongly indicate that the workshop’s practical activities and participatory part were more successful than the frontal lecture. However, the participatory part also had its specific difficulties. For instance, students vary considerably in the speed of understanding/learning and doing the activity. Some groups started playing immediately, but some hesitated, and we had to explain more. Nonetheless, all students got involved with the activities and enjoyed them. Even during break time, most groups kept playing. This observation led us to conclude that to give more information about human values in a workshop, we should change the lecture part to more practical and engaging activities similar to playing with the HuValue tool, which needs a more extended session. Also, the longer-term use of the tool in different activities and various contexts can help improve the ability to distinguish values from non-values. If we insist on giving information in a short time, we have to be firm and clear and emphasize what we mean exactly. In addition, since most adult people already have their own notions about values, we should consider some time for discussing wrong ideas.
Also, Erikson et al. who identified "a unique collection of 28 challenges accompanied by inspirational suggestions for teaching activities" (Eriksson et al. Citation2022) mentioned HuValue tool as a relevant thesaurus, dictionary, value vocabulary for students learning values. However, our workshop and other relevant experiments with HuValue tool (Kheirandish et al. Citation2020b) provided evidence for effectiveness of this tool in other design process, for which the tool can be used to plan learning/teaching activities for educate design students or as a design tool to assist professional designers. Furthermore, the tool can be beneficial specially for evaluation of ideas, concepts, and products, for which Erikson et al. noticed a lack of relevant material (Eriksson et al. Citation2022). Besides the potential and flexibility of HuValue tool for raising awareness about human values, this research presented a quantitative method to measure this awareness, which can be used for evaluating both teachers’ and learners’ efforts. Such a measurement method can help to plan more effective values learning/teaching activities for training responsible designers.
Conclusion
Our answer to the overall research question in this study is yes, a workshop with the HuValue tool is capable of raising awareness about human values. The answer to this question is a general conclusion of the answers to its four sub-questions. In the first questionnaire scale, findings of pre-ws/post-ws indicated that after the workshop, students felt significantly more confident saying, “I-am-aware-of-my-personal-values,” and significantly fewer participants felt the need to know more about human values, which means they believed that the workshop had a positive effect on their value awareness; Also, the results of the second questionnaire scale showed significant effects of the workshop on recognizing correct statements about human values. However, it did not have the same impact on incorrect statements. Additionally, there was more agreement about correct statements between participants and less agreement about incorrect statements; In the third scale, after the workshop, participants distinguished value words significantly more than before. This scale, considered to test value awareness, showed that after the workshop, the participant’s ability to recognize human values increased. In the fourth scale, findings indicated that students already knew about the importance of human values in “Communicating-with-others,” “Making-decisions,” “Thinking-about-the-future,” and “Reasoning.” After the workshop, they discovered the role of human values even in “Expressing-your-feelings” and “Routine-actions.”
Supplemental Material
Download MS Word (665.6 KB)Disclosure statement
No potential conflict of interest was reported by the author(s).
Additional information
Notes on contributors
Shadi Kheirandish
Shadi Kheirandish is an assistant professor of industrial design in the Industrial Design Department, Faculty of Art, Alzahra University (Iran). She earned her PhD in industrial design from the Eindhoven University of Technology. Her research area is Human Values in Design. Kheirandish is interested in studying meaningful aspects of designed products and their impacts on human daily life. She also works on educational methods and tools for training designers with a human values-sensitive perspective.
Matthias Rauterberg
Matthias Rauterberg is professor emeritus of ‘interactive systems design’ in the Industrial Design Department, Eindhoven University of Technology (TU/e, The Netherlands). Matthias Rauterberg received a B.S. in Psychology (1978) at the University of Marburg (Germany), a B.A. in Philosophy (1981) and a B.S. in Computer Science (1983), a M.S. in Psychology (1981) and a M.S. in Computer Science (1986) at the University of Hamburg (Germany), and a Ph.D. in Computer Science/Mathematics (1995) at the University of Zurich (Switzerland). He was a adjunct professor for ‘usability engineering’ in computer science and industrial engineering at the Swiss Federal Institute of Technology (ETH) in Zurich, where later he was heading the Man-Machine Interaction research group (MMI). Since 1998 he is fulltime professor for ‘Human Communication Technology’ first at IPO, Center for User System Interaction Research, and later at the Department of Industrial Design at the TU/e. From 1999 till 2001 he was director of IPO. From 2006 till 2016 he was the head of the Designed Intelligence research group at the department of Industrial Design of the TU/e. He was the Swiss representative in the IFIP TC13 on ‘Human Computer Interaction’ (1994-2002) and the chairman of the IFIP WG13.1 on ‘HCI and Education’ (1998-2004). He is now the Dutch representative in the IFIP TC14 on ‘Entertainment Computing’ and was the founding vice-chair of this TC14 (since 2006). He was elected as IFIP TC14 chair for the term 2013-2017. He was also the chair of the IFIP WG14.3 on ‘Entertainment Theory’ (2004-2012). He was appointed as visiting professor at Kwansei Gakuin University (Japan) (2004-2007). He was guest professor of School of Design at Jiangnan University, Wuxi, China (2012-2015), at East China University of Science and Technology, Shanghai, China (2013-2016), and at Shanghai Jiao Tong University, China (2020). He received the German GI-HCI Award for the best Ph.D. in 1997 and the Swiss Technology Award for the BUILD-IT system in 1998. In 2007 he got the Silver Core Award from IFIP, and since 2020 he is elected Fellow of IFIP. He has over 500 publications in international journals, conference proceedings, books, etc. He acts also as editor and member of the editorial board of several leading international journals. He is co-editor-in-chief of the international journal "Entertainment Computing" (Elsevier).
References
- Barlex, David. 1993. “The Nuffield Approach to Values.” Design & Technology Teaching 26 (1): 42–45.
- Berkowitz, M. W. 2011. “What Works in Values Education.” International Journal of Educational Research 50 (3): 153–158. https://doi.org/10.1016/j.ijer.2011.07.003.
- Breckon, Andrew. 1998. “National Curriculum Review in Design and Technology for the Year 2000.” Journal of Design & Technology Education 3 (2): 101–105.
- Brey, P. 2018. “The Strategic Role of Technology in a Good Society.” Technology in Society 52: 39–45. https://doi.org/10.1016/j.techsoc.2017.02.002.
- Coeckelbergh, M. 2006. “Regulation or Responsibility? Autonomy, Moral Imagination, and Engineering.” Science, Technology, & Human Values 31 (3): 237–260. https://doi.org/10.1177/0162243905285839.
- Coles, Rhoda, and Eddie Norman. 2005. “An Exploration of the Role Values Plays in Design Decision-Making.” International Journal of Technology and Design Education 15 (2): 155–171. https://doi.org/10.1007/s10798-005-8274-4.
- Conway, R. 1994. “Values in Technology Education.” International Journal of Technology and Design Education4 (1): 109–116. https://doi.org/10.1007/BF01197586.
- Conway, Ruth, and Anne Riggs. 1994. “Valuing in Technology.” In Teaching Technology, edited by Frank Banks, 227–237. London, New York: Routledge.
- Dakers, John R. 2005. “The Hegemonic Behaviorist Cycle.” International Journal of Technology and Design Education 15 (2): 111–126. https://doi.org/10.1007/s10798-005-8275-3.
- de Vries, M. 2005. “The Nature of Technological Knowledge: Philosophical Reflections and Educational Consequences.” International Journal of Technology and Design Education 15 (2): 149–154. https://doi.org/10.1007/s10798-005-8276-2.
- Dimitrov, D. M., and J. Rumrill. 2003. “Pretest-Posttest Designs and Measurement of Change.” Work: A Journal of Prevention, Assessment and Rehabilitation 20 (2): 159–165.
- Elshof, L. 2005. “Teacher’s Interpretation of Sustainable Development.” International Journal of Technology and Design Education 15 (2): 173–186. https://doi.org/10.1007/s10798-005-8277-1.
- Eriksson, E., E. Nilsson, A. Hansen, and T. Bekker. 2022. “Teaching for Values in Human–Computer Interaction.” Frontiers in Computer Science 4 (article 830736): 1–18. https://doi.org/10.3389/fcomp.2022.830736.
- Fröhlich, A. 2019. “Value Creation and Value awareness - Toward a Psychological Perspective (Doctoral Thesis). Leipzig: HHL Leipzig Graduate School of Management.
- Gallagher, T. 2001. “The Value Orientations Method: A Tool to Help Understand Cultural Differences.” Journal of Extension 39 (6): 165–117.
- Hague, W. 1968. “Value Systems and Vocational Choice of the Priesthood (Doctoral Thesis). Edmonton: The University of Alberta.
- Hintz, F., C. Geiser, and S. Shiffman. 2019. “A Latent State-Trait Model for Analyzing States, Traits, Situations, Method Effects, and Their Interactions.” Journal of Personality 87 (3): 434–454. https://doi.org/10.1111/jopy.12400.
- Hofstede, G., G. Hofstede, and M. Minkov. 2010. Cultures and Organizations: Software of the Mind (3rd ed.). London - New York: MacGraw-Hill Ltd.
- Holdsworth, Ian, and Brian Conway. 2009. “Investigating Values in Secondary Design and Technology Education.” Journal of Design & Technology Education 4 (3): 205–214.
- Hunt, R. A. 1968. “The Interpretation of the Religious Scale of the Allport-Vernon-Lindzey Study of Values.” Journal for the Scientific Study of Religion 7 (1): 65–77. https://doi.org/10.2307/1385111.
- Inglehart, Ronald, Miguel Basanez, Jaime Diez-Medrano, Loek Halman, and Ruud Luijkx. 2000. “World Values Surveys and European Values Surveys, 1981–1984, 1990–1993, 1995–1997.” Ann Arbor-Michigan, Institute for Social Research, ICPSR version.
- Järvinen, Esa-Matti, and Aki Rasinen. 2015. “Implementing Technology Education in Finnish General Education Schools: Studying the Cross-Curricular Theme 'Human Being and Technology.” International Journal of Technology and Design Education 25 (1): 67–84. https://doi.org/10.1007/s10798-014-9270-3.
- JafariNaimi, N. 2018. “Our Bodies in the Trolley’s Path, or Why Self-Driving Cars Must *Not* Be Programmed to Kill.” Science, Technology, & Human Values 43 (2): 302–323. https://doi.org/10.1177/0162243917718942.
- Kheirandish, S. 2018. “HuValue- a Tool to Enrich Design Concepts with Human Values (Doctoral Thesis). Eindhoven, The Netherlands: Eindhoven University of Technology.
- Kheirandish, S., and M. Rauterberg. 2018. “Human Value Based Game Design.” Proceedings of 2nd National and 1st International Digital Games Research Conference: Trends, Technologies, and Applications (DGRC) (pp. 6–16). Tehran, Iran: IEEE.
- Kheirandish, S., and M. Rauterberg. 2020. “How to Utilize the HuValue Tool for Daily Life Product Design.” International Conference on Human-Computer Interaction (pp. 338–357). Cham: Springer.
- Kheirandish, S., M. Funk, S. Wensveen, M. Verkerk, and M. Rauterberg. 2020a. “A Comprehensive Value Framework for Design.” Technology in Society 62 (article 101302): 101302. https://doi.org/10.1016/j.techsoc.2020.101302.
- Kheirandish, S., M. Funk, S. Wensveen, M. Verkerk, and M. Rauterberg. 2020b. “HuValue: A Tool to Support Design Students in considering Human Values in Their Design.” International Journal of Technology and Design Education 30 (5): 1015–1041. https://doi.org/10.1007/s10798-019-09527-3.
- Kheirandish, S., M. Funk, S. Wenswen, M. Verkerk, and M. Rauterberg. 2019. “HuValue: A Toolkit to Facilitate considering Various Human Values in a Design Process.” In Design and Semantics of Form and Movement: Beyond Intelligence, DeSForM 2019, 246–249. Newcastle-upon-Tyne: Northumbria University.
- Kruskal, J. B. 1964. “Multidimensional Scaling by Optimizing Goodness of Fit to a Nonmetric Hypothesis.” Psychometrika 29 (1): 1–27. https://doi.org/10.1007/BF02289565.
- Kudina, O., and P.-P. Verbeek. 2018. “Ethics from within: Google Glass, the Collingridge Dilemma, and the Mediated Value of Privacy.” Science, Technology, & Human Values 44 (2): 291–314. https://doi.org/10.1177/0162243918793711.
- Layton, D. 1991. Aspects of National Curriculum: Design and Technology. New York: NCC.
- Martin, M. 2002. “Values and Attitudes in Design and Technology.” In Issues in Design and Technology Teaching, edited by S. Sayers, J. Morley, & B. Barnes, 208–223. London and New York: Routledge Falmer.
- McCoach, D., R. Gable, and J. Madura. 2013. Instrument Development in the Affective Domain (3rd ed.). New York: Springer Science Business Media.
- McLaren, S. 1997. “Value Judgements: Evaluating Design—a Scottish Perspective on a Global Issue.” International Journal of Technology and Design Education 7 (3): 259–278. https://doi.org/10.1023/A:1008825219627.
- Mehalik, M. M., and M. E. Gorman. 2006. “A Framework for Strategic Network Design Assessment, Decision Making, and Moral Imagination.” Science, Technology, & Human Values 31 (3): 289–308. https://doi.org/10.1177/0162243905285841.
- Meynhardt, Timo, and Andreas Fröhlich. 2019. “More Value Awareness for More (Public) Value: Recognizing How and for Whom Value is Truly Created.” In Public Value, edited by Adam Lindgreen, Nicole Koenig-Lewis, Martin Kitchener, John Brewer, Mark Moore and Timo Meynhardt, 23–39. London: Routledge.
- Middleton, H. 2005. “Creative Thinking, Values and Design and Technology Education.” International Journal of Technology and Design Education 15 (1): 61–71. https://doi.org/10.1007/s10798-004-6199-y.
- Nelson, J., and T. Gorichanaz. 2019. “Trust as an Ethical Value in Emerging Technology Governance: The Case of Drone Regulation.” Technology in Society 59: 101131. https://doi.org/10.1016/j.techsoc.2019.04.007.
- Nissenbaum, H., and D. Walker. 1998. “Will Computers Dehumanize Education? A Grounded Approach to Values at Risk.” Technology in Society 20 (3): 237–273. https://doi.org/10.1016/S0160-791X(98)00011-6.
- Pavlova, M. 2009. “Conceptualisation of Technology Education within the Paradigm of Sustainable Development.” International Journal of Technology and Design Education19 (2): 109–132. https://doi.org/10.1007/s10798-008-9073-5.
- Peterson, C., and M. Seligman. 2004. Character Strengths and Virtues: A Handbook and Classification (Vol. 1). Oxford: Oxford University Press.
- Preston, C. C., and A. Colman. 2000. “Optimal Number of Response Categories in Rating Scales: Reliability, Validity, Discriminating Power, and Respondent Preferences.” Acta Psychologica 104 (1): 1–15. https://doi.org/10.1016/s0001-6918(99)00050-5.
- Prime, G. M. 1993. “Values in Technology: Approaches to Learning.” Design and Technology Teaching 26 (1): 30–36.
- Rauterberg, M. 2017. “Reality Determination through Action.” In Proceedings of IEEE International Conference on Culture and Computing - C&C (pp. 24–29). Piscataway: IEEE. https://doi.org/10.1109/Culture.and.Computing.2017.16.
- Rekus, Juergen. 1991. “Teaching Technology with a Focus on Moral Education.” International Journal of Technology and Design Education 2 (2): 41–46. https://doi.org/10.1007/BF00527957.
- Rokeach, M. 1973. The Nature of Human Values. New York: The Free Press.
- Schwartz, S. H. 2012. “An Overview of the Schwartz Theory of Basic Values.” Online Readings in Psychology and Culture 2 (1): 11. https://doi.org/10.9707/2307-0919.1116.
- Shilton, K. 2012. “Values Levers: Building Ethics into Design.” Science, Technology, & Human Values 38 (3): 374–397. https://doi.org/10.1177/0162243912436985.
- Steen, M. 2015. “Upon Opening the Black Box and Finding It Full: Exploring the Ethics in Design Practices.” Science, Technology, & Human Values 40 (3): 389–420. https://doi.org/10.1177/0162243914547645.
- Swierstra, T., and J. Jelsma. 2006. “Responsibility without Moralism in Technoscientific Design Practice.” Science, Technology, & Human Values 31 (3): 309–332. https://doi.org/10.1177/0162243905285844.
- Taber, K. S. 2017. “The Use of Cronbach’s Alpha When Developing and Reporting Research Instruments in Science Education.” Research in Science Education48 (6): 1273–1296. https://doi.org/10.1007/s11165-016-9602-2.
- Tungaraza, Frida, and Margaret Sutherland. 2005. “Capturing the Minds of a Lost and Lonely Generation.” International Journal of Technology and Design Education 15 (2): 187–198. https://doi.org/10.1007/s10798-005-8279-z.
- Voinea, C. 2018. “Designing for Conviviality.” Technology in Society 52: 70–78. https://doi.org/10.1016/j.techsoc.2017.07.002.
- World Values Survey. 2018. Retrieved March 30, 2018, from World Values Survey: http://www.worldvaluessurvey.org/wvs.jsp