
 ?Mathematical formulae have been encoded as MathML and are displayed in this HTML version using MathJax in order to improve their display. Uncheck the box to turn MathJax off. This feature requires Javascript. Click on a formula to zoom.
Abstract
Due to their excellent specific mechanical properties, closed cell elastomeric foams are the main element in the soles of running shoes to absorb repetitive shocks from strides and to release a maximum of the absorbed energy. However, these cellular materials are gradually damaged. To enhance their mechanical durability by slowing their damage kinetics, it is critical to understand their mechanical behaviour in fatigue. The objective of this work is thus to clarify the link between the microstructure and the fatigue properties of five commercial elastomeric foams used in the midsoles of running shoes. The 3D cellular structures of each foam were finely analysed using X-ray microtomography. Foam samples were then subjected to cyclic compression which were close to running conditions. During cycling, samples exhibited a rapid densification associated with noticeable decreases of (i) the stress levels required to deform them as well as (ii) the cushioning and (iii) the rebound properties. We show that the two midsoles filled with micro-sized mineral fillers present the highest specific mechanical properties during the first compression cycle and during fatigue. However, their damage kinetics and rebound properties could probably be improved by tuning the fillers-matrix compatibility. The lightest foam, being very porous and presenting process-induced tortuous cell walls, is the best cushioning system but exhibits high damage kinetics. The densest foam presents poor specific mechanical properties, but very slow damage kinetics. Its double hierarchical architecture probably prevents the occurrence of micro-cracks in the cell walls.
Introduction
The optimal stride frequency (Cavanagh & Kram, Citation1989) of an elite long distance runner is around 4800 strides per hour (Musgjerd et al., Citation2021; Oeveren et al., Citation2017). During strides, the foot-ground reaction forces exhibit repeated compressive loadings (Nigg et al., Citation2012). shows the heel landing (first peak) and the forefoot propulsion (second peak) during the first 200 ms for a 75 kg man running at 12 km h−1 (Clarke et al., Citation1983). In this example, the duration of the aerial phase is 600 ms, before the next stride. The double peak characteristics typically depend on the technique of the athlete, his/her morphology and speed (Frederick, Citation1983). Thus, the shoe lifetime depends on the use and the user as well as the grade of the material, and is more or less around 500 km (Rethnam & Makwana, Citation2011). The current market trend is to extend this lifetime.
Figure 1. (a) Reaction foot-ground force fz during a stride of a runner (75 kg, 12 km h−1), adapted from previous studies (Clarke et al., Citation1983; Nigg, Citation1986). (b) Vertical slice obtained by X-ray tomography of the first studied running shoe with a zoom on the sole structure and on the 3D microstructure of its midsole foam F1 obtained by X-ray microtomography. (A) Stiffer plate and (B) air volume inserted in the midsole. (c) Vertical slices obtained by X-ray tomography of the other studied soles and their respective midsoles F2, F2*, F3 and F4 (for (b) and (c), see materials and methods for acquisition parameters and shoes information).
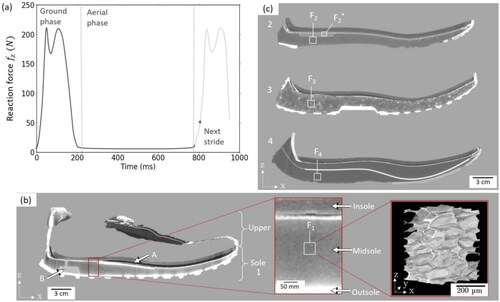
To limit mechanical efforts sustained by the body, improve running comfort and avoid injuries (Malisoux et al., Citation2019; Taunton et al., Citation2002, Citation2003) athletes use dedicated running shoes, fitted with a multilayered sole (). The outsole is the layer in contact with the floor, the insole is in contact with the foot, and the midsole is in between. The midsole is the main energy absorbing-releasing system of standard soles (Sun et al., Citation2020). On the one hand, it must be lightweight to minimize the energy expended by the runner (Franz et al., Citation2012; Fuller et al., Citation2015; Hoogkamer et al., Citation2016). On the other hand, it must be as energy absorbent as possible during the stride ground phase, while releasing in the same time a maximum of energy for an efficient propulsion of the feet in the air (Frederick et al., Citation1986; Sinclair et al., Citation2016; Worobets et al., Citation2014).
Usually, such specifications are achieved by tuning, the geometry of the midsole (e.g. its thickness (Chambon et al., Citation2014) and/or the difference in height between rear-foot and forefoot areas (Chambon et al., Citation2013)), and/or the choice of constitutive materials (Malisoux et al., Citation2019; Silva et al., Citation2009), for instance by combining cellular materials (Brückner et al., Citation2010) to optional hard inserts (e.g. gel, stiff plates as in (Flores et al., Citation2019; Madden et al., Citation2016)) and/or air volume as in .
To date, solid elastomeric foams with closed cells remain the preferred candidates for midsoles () (Brückner et al., Citation2010; Mills, Citation2007; Verdejo & Mills, Citation2002) due to their relevant specific mechanical properties (Shimazaki et al., Citation2016), their low-cost and to their versatile and fast manufacturing processes. In particular, ethylene-vinyl-acetate (EVA) based foams are the most widely used for the last four decades (Mills, Citation2007; Sun et al., Citation2020). Recently, thermoplastic polyurethane (TPU) and polyether-block-amide (PEBA) based foams were also praised by the running community (Brückner et al., Citation2010; Chen et al., Citation2022). These cellular systems exhibit a typical compressible visco-hyperelastic behaviour with good energy absorption-release properties (L. J. Gibson & Ashby, Citation1999). Over a high number of load-unload cycles during training, the evolution of mechanical properties of midsole foams results in a progressive densification associated with a loss of cushioning properties (Cornwall & McPoil, Citation2017).
Among the challenges to overcome to restrain the damage kinetics of closed cell elastomeric foams, identifying and understanding their fatigue mechanisms and their links with their structural properties is a critical issue. To this end, two main experimental approaches are found in the literature. One is a field-based approach studying midsoles used during real training sessions (Malisoux et al., Citation2019; Verdejo & Mills, Citation2004a). More particularly, Verdejo et al. collected EVA midsoles samples from the sole of a used running shoe and characterized their microstructures using scanning electron microscopy. The 2D micrographs showed holes in cell walls under the heel pad area and buckled cell walls in the forefoot area, giving a first microstructural insight on the fatigue of EVA midsoles (Verdejo & Mills, Citation2004a). However, the high number of interfering parameters (e.g. humidity, temperature (Kinoshita & Bates, Citation1996) ground types (Taylor et al. Citation2012) morphologies and techniques of runners (Malisoux et al., Citation2019)), and the time required to conduct such experiments remain major obstacles to this approach.
To circumvent these difficulties, a second approach consists in studying midsoles compressed in laboratory by subjecting foam samples to mechanical loadings close to those undergone during running. These studies highlighted that ageing mechanisms due to gas loss by diffusion through the closed cell walls were negligible in fatigue (Verdejo & Mills, Citation2004b) and that chemical modifications observed by Fourier-transform infra-red spectroscopy of the solid phase were observed after fatigue, but the reaction is not yet identified (Lippa et al., Citation2014). These studies also provided guidelines to better understand ageing mechanisms of the midsoles. However, they were restricted to EVA foams, leaving aside the new material formulations proposed on the market. In parallel, in the past decade, X-ray microtomography (named µCT in the following) has become a reference 3D imaging technique to characterize the microstructure of cellular materials with micro to millimetric pore sizes (Pardo-Alonso et al., Citation2015; Patterson et al., Citation2016) and more recently to characterize midsole cellular microstructures (Singaravelu et al., Citation2020). However, up to date, no information has been provided about the 3D microstructures of midsole foams together with their effect on the mechanical behaviour of such materials.
Therefore, the objective of this work is to better understand the fatigue of commercial elastomeric foams used in the midsoles of running shoes by clarifying the relationship between their process-induced 3D microstructures, which were characterized by using µCT, and their behaviour during cyclic compression. The results provide guidelines to enhance midsole foams performances.
Materials and methods
Shoes and midsoles foam samples
Experiments were conducted by using midsoles from four top-of-the-range commercial running shoes (, obtained with µCT at low spatial resolution, cf. next subsection). Qualitative mechanical and structural performances of midsoles claimed by the manufacturers are detailed in . The cushioning of midsoles represents their energy absorption capability, while the rebound represents their capability to release the energy stored during compression with a minimum of dissipation, i.e. with minimum viscous or plastic damping. The durability of the foams refers to the conservation of the mechanical properties during the shoe lifetime and thus, to a slow damage kinetics. In addition, midsoles must be as light as possible in order to minimize the energy expended by the runner during training. For this reason, the specific mechanical properties of foams, as defined by L. J. Gibson and Ashby (Citation1999), are also relevant performance indicators for midsoles. Foam samples, further noted Fi, were extracted from the midsoles of the four running shoes (). Samples F2 and F*2, respectively, derived from the main material and from the insert of the second studied midsole (-2)). The selected midsole foams differed by the nature of their parent polymer, i.e. EVA, TPU, PEBA.
Figure 2. Typical stress–strain behaviour (case of foam F1) during the first compression cycle. The three densification phases during loading are noted (i), (ii) and (iii). (A) Illustration of a typical undeformed sample (case of foam F1) mounted between the compression platens, corresponding to , (M) same sample at maximum strain
and (R) at residual strain
.
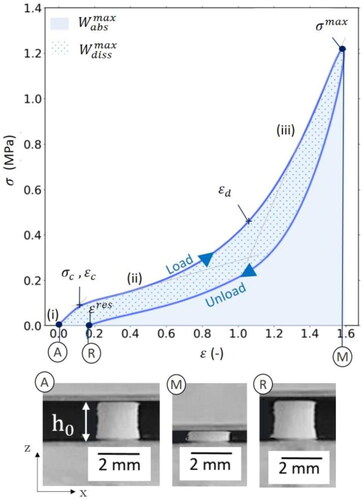
Table 1. Foams under study and their properties.
After separating the upper part from the sole using a bandsaw machine, a slitting machine was used to obtain slices of height h0 = 2 mm of the midsoles to characterize both the structure and the fatigue of the midsoles. Due to industrial processes, midsoles present local density variation at the sample scale (). For this reason, the density of three larger samples (in-plane dimensions: 20 mm long, 20 mm wide) was measured for each midsole to obtain an averaged density ρ, estimated using a calliper (precision: 0.01 mm) and a microbalance (precision: 0.1 mg). We extracted from these sheets smaller samples for mechanical testing, the density of which equal to the corresponding averaged value of each midsole ±0.01 g cm−3. Thus, we used cylindrical samples (, in-plane diameter d0 = 2 mm) for foams F1, F2 and F4. For the TPU foam F3, made of welded expanded pellets (-3)), larger cuboid samples were cut using a razor blade (in-plane square area: 10 × 10 mm2) to allow representative mechanical characterization of the midsole. Samples were maintained at 55% RH and T = 22 °C from their extraction to the end of all experiments.
Structure characterization
At macroscale, we used a laboratory X-ray tomograph manufactured by RX Solutions to visualize the vertical slices of soles shown in (parameters are given in Appendix). At microscale, the 3D microstructure of each sample was analyzed using the same tomograph equipped with another X-ray source. Samples were placed on a long thin alumina rod (2 mm diameter, 10 cm length) close to the X-ray source to obtain a voxel size of 1 µm3. The parameters were: source type: Hamamatsu equipped with a lanthanum hexaboride filament, mode: middle spot, detector flat panel: VARIAN, tension: 60 kV, target current: 7 µA, frame rate: 1 s−1, number of averaged frames: 3, number of projections: 2400. The reconstruction was done using the commercial X-Act software based on a filtered backprojection algorithm. Images were segmented using the plugin 3D weka segmentation (Arganda-Carreras et al., Citation2017) available on Fiji (Schindelin et al., Citation2012) (see example in ). Various image analysis procedures were applied to the segmented volumes to quantify the 3D microstructure descriptors of each sample. The porosity ϕ, the mean pore size C and the mean cell wall thickness t were estimated using the function Thickness of the plugin BoneJ (Doube et al., Citation2010) for the two latter-mentioned structural parameters (see detailed procedure in appendix).
Cyclic compression tests
Foam samples were subjected to simple compression fatigue tests using a standard electromechanical device (Instron 05944 equipped with a ± 10 N loadcell maximal capacity). Samples were placed between 2 parallel compression platens (30 mm × 30 mm), coated with a very thin layer of silicon oil (compared to the sample size) acting as a lubricant to avoid any sample barrelling effect induced by friction forces between the sample and the platens (Chalencon et al., Citation2010; Guiraud et al., Citation2012). During the tests, the axial compression force fz was recorded to calculate the nominal compression stress σ = and the displacement of the crosshead
was measured in order to calculate the compression natural strain
(also known as the Hencky strain), where
is the actual sample height.
The design of the testing procedure was achieved by accounting for three constraints, i.e. with the objective to constitute a database that could be useful both for (i) running shoe design and (ii) fundamental knowledge in materials science and that could be (iii) achieved with our experimental facilities. Bearing in mind this framework, we performed cyclic compression tests using a strain-controlled approach, in accordance with the literature dedicated to the fatigue of elastomers under finite strains (Le Saux et al., Citation2010; Loo et al., Citation2016). Hence, each cycle consisted in subjecting samples to a representative compression up to a maximal strain and to unload it down to a minimal strain
. The chosen value of the maximal strain corresponds to a typical strain undergone by the midsole under the heel bone during the heel impact phase of a rearfoot strike pattern stride (Verdejo & Mills Citation2002, Verdejo Citation2004). In addition, for each compression cycle, tests were performed at the compression strain rate
= 4 s−1, during loading and during unloading. It was the highest strain rate we could properly achieve with the Instron device. The resulting cycling frequency was 1.25 Hz, being slightly lower than the commonly admitted running stride frequencies (1.3–1.6 Hz; Atwater, Citation1990; Cavanagh & Kram, Citation1989; Verdejo & Mills, Citation2002; Verdejo, Citation2004). However, possible strain rate effects on the viscoelastic properties which would be induced by this difference of only
are supposed to be negligible accounting for the polymers under consideration (Aurilia et al., Citation2011; Carotenuto et al., Citation2019; Diani, Citation2021). In addition, it must be pointed out that during the unloading phase of each cycle, the compression force systematically reaches the zero value before the zero value of the minimal cycling strain
. Hence, during this period, samples are subjected to a partial free stress recovery, which roughly resembles the partial free stress recovery experienced by the midsole when the shoe is not touching the ground. At last, to study fatigue-induced effects, each compression cycle was repeated to reach a total number of cycles N = 200,000, leading to a test duration of approximately 45 h. Using typical running frequencies and velocities measured in the literature, respectively, ranging between 1.3 and 1.6 Hz and between 10 and 20 km h−1 (Atwater, Citation1990; Cavanagh & Kram, Citation1989; Verdejo & Mills, Citation2002; Verdejo, Citation2004), the considered tests should thus roughly correspond to running distances ranging between 400 and 700 km.
To check the repeatability, fatigue tests were conducted on three different samples for each foam. Considering the small stress variations between samples, being lower than ±5%, and for the sake of clarity, only one mechanical response per tested foam is reported in the following. A typical response (sample F1) to a first load-unload compression cycle is illustrated in . During loading, the compression behaviour is usually divided into three densification steps delimited by and by
: (i) a sharp increase of the stress level corresponding to the quasi-linear deformation of cell walls up to a compression yield strengths
, followed by (ii) a slow increase of the stress level during which cell wall buckling is considered to occur, followed by (iii) a sharp increase of the stress level when the porosity is low enough for cell walls to enter in contact with one another (L. J. Gibson & Ashby, Citation1999). Five other properties were extracted for each cycle and monitored in fatigue:
The cushioning properties were gauged as the volumetric absorbed energy during loadings:
, where
Two specific mechanical properties evaluated at the end of loadings (at
The maximum specific stress, i.e. the stress normalized by the density of foams
The associated maximum specific absorbed volumetric energy
The damping loss factor
The residual strain
Results
Structural characterization
Density
The foam densities ρ are reported in . These values lie between 0.09 g cm−3 for the PEBA foam F4 and 0.24 g cm−3 for the TPU foam F3, in agreement with the average values reported for athletic shoe midsoles 0.2 g cm−3 (Brückner et al., Citation2010; Mills, Citation2007; Verdejo & Mills, Citation2004a).
Table 2. Structural descriptors and mechanical properties during N = 1.
Microstructure
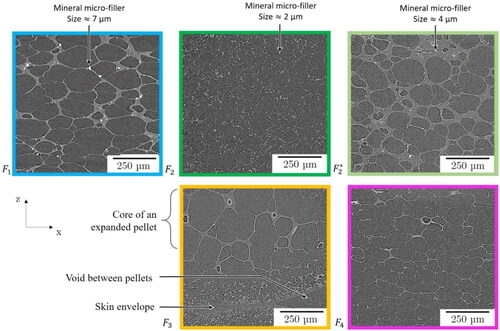
The slices reported in show the inner microstructures of each foam along the compression direction. The corresponding quantitative descriptors are given in . The results bring up the following comments:
All microstructures exhibit mainly closed cells at the observation scale: due to the chosen spatial resolution used to image samples, some very thin cell walls (<2 µm) as well as holes in these walls are not easily detected and some cells may be connected below this spatial resolution.
Micro-sized mineral fillers, which absorb more X-ray than the polymer matrix, are observed in EVA foams F1, F2 and F2*. They are poorly dispersed with an average size ranging from 7 to 2 µm.
The EVA foam F2* presents a lower porosity of 0.71 and a higher density of 0.23 g cm−3 than the EVA foam F1 (exhibiting a porosity of 0.79 and a density of 0.17 g cm−3). The average wall thickness distribution of F2* presents a normalized standard deviation of 61% which is larger than that estimated for F1 (44%). Thus, F2* exhibits a more heterogeneous microstructure than F1.
The TPU foam F3 presents the second lowest porosity of 0.72, in agreement with its density of 0.24 g cm−3. It exhibits small pores and thin cell walls close to the edges of expanded pellets and larger ones close to their cores. Such microstructure size gradient is similar to the one observed by Singaravelu et al. (Citation2020), making echo to fruit peel microstructure used as natural cushioning system (Li et al., Citation2019). Due to the presence of a skin at the surface of each pellet, F3 microstructure is hierarchically architectured.
The PEBA foam F4 displays by far the most porous microstructure with a porosity of 0.90, and the most tortuous cell walls.
Figure 3. 2D grey levels slices obtained with μCT showing the inner microstructure the studied foams along the compression plane (x, z).
Mechanical characterization
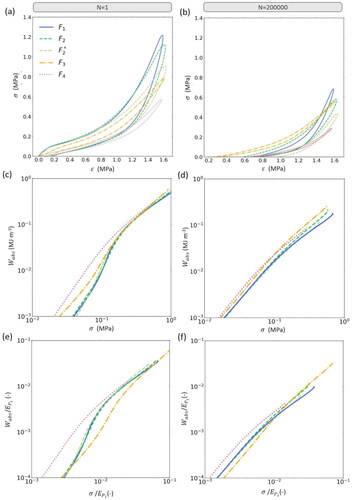
The stress–strain responses during the first cycle (N = 1) are presented in for each tested foam. The associated mechanical properties are reported in . Similarly, the stress–strain responses during the last cycle (N = 200,000) are presented in for each foam. ,d) shows the volumetric absorbed energy diagram at N = 1 and at N = 200,000 to assess the foam performance in absorbing a maximum of energy for a minimal stress, as suggested by L. J. Gibson and Ashby (Citation1999). In order to clarify the link between the foam microstructures and their energy absorption capabilities (L. J. Gibson & Ashby, Citation1999), we have reported in the graphs d–f of (at N = 1 and N = 200,000, respectively) the evolution of the volumetric absorbed energy diagram normalized by the Young modulus of the parent polymer (
= 18 MPa,
= 10 MPa,
= 20 MPa (Arkema (n.d); BASF, Citation2022; Verdejo & Mills, Citation2002). In addition, to evaluate the performance of foams relative to their weight and their damage kinetics upon cycling, the evolutions of the specific mechanical properties
and
with the number of cycles N have been reported in ,b), respectively. Lastly, to gauge the rebound and the recovery properties of foams during fatigue as well as their damage kinetics, the evolution of the damping loss factor
and
are presented in ,d), respectively.
Figure 4. Stress–strain behaviour of all foams at (a) N = 1 and (b) N = 200,000. Volumetric absorbed energy diagram at (c) N = 1 and (d) N = 200,000. Volumetric absorbed energy diagram normalized by the Young modulus of the foam parent polymer at (e) N = 1 and (f) N = 200,000.
First cycle
During the first loadings shown in , all foams exhibit the first densification phase (i) except the PEBA foam F4. The second and third densification phases, (ii) and (iii), are observed for all foams, resulting in a behaviour typically observed for closed cell elastomeric foams (L. J. Gibson & Ashby, Citation1999). During unloading, the area of hysteresis cycle, between 0.29 and 0.07 MJ m−3 for all foams, is typical of such materials used in midsoles (Verdejo & Mills, Citation2004b): the first points reported in prove that foams F3 and F4 initially exhibit the lowest damping loss factor. It is interesting to note from that (i) below a threshold stress of MPa, i.e. in the early stage of the stride, the foam F4 absorbs more energy (and thus should bring better shock attenuation) than F3, which in turn absorbs more energy than the other tested foams, (ii) this trend is annealed above this threshold. Also, results of prove that the aforementioned trends should be ascribed to the foam morphology for foam F4, and to the high density and/or the hierarchical architecture for foam F3. Lastly, regarding the initial specific properties, the first points of ,b) show that F1, F2 (and in a less extent F4) exhibit the best specific stresses and absorbed energies. These features constitute interesting properties for lightweight design of midsoles.
Figure 5. Evolution of (a) the maximum specific stress, (b) the maximum specific volumetric absorbed energy, (c) the damping loss factor and (d) the residual strain, as a function of the number of compression cycles for all foams. The errors bars represent the standard deviation of the data of the three tested sample. The legend is the same as .
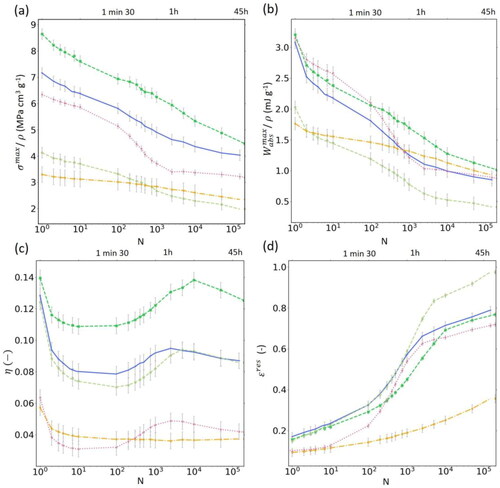
Effect of cycling
In , the hysteresis cycles at N = 200,000 are thinner than in at N = 1, and exhibit an offset to higher strain values than in at N = 1. In d), the evolutions of the four mechanical properties illustrate the damage kinetics upon cycling of all foams. The mean overall evolutions are: −42 ± 6% for the maximum specific stress (), −66 ± 15% for the maximum specific volumetric absorbed energy (), −26 ± 3% for the damping loss factor () and +340 ± 107% for the residual strain (). In addition, the decrease of the maximum specific stress upon cycling illustrates the softening of the foams. This was observed in previous work on polymeric foams during the first hundreds compression cycles (Shen et al., Citation2001). It echoes the Mullin’s effect observed for dense elastomers (Mullins, Citation1969). This result is correlated with the decrease in the maximum specific volumetric absorbed energy. Furthermore, the overall damping loss factor evolutions are correlated with the densification of the foams during cycling, i.e. the progressive increases of . The increase in the damping loss factor between cycles N = 100 and 4000, observed for the three EVA foams and the PEBA foam, illustrates that the dissipated energy decreases faster than the absorbed one. Furthermore, during the last loading (), no foam exhibits the first densification phase (i). In agreement with our previous observation on the process-induced microstructure of the PEBA foam F4 at N = 1, the fatigue-induced microstructures of all foams are suspected to exhibit tortuous cell walls which could be progressively induced during cycling. Also, the trends reported in the previous section for the absorbed energies () more or less vanish after cycling (), this being probably due to a detrimental cycling induced-microstructure evolution. At last, the decreases of the specific stresses () and absorbed energies () for the three ‘best’ (from the specific standpoint, i.e. when an optimal lightweight design is sought) initial foams upon cycling are faster than those reported for the two other foams.
Discussion
Effect of the microstructure features on the stress-strain behaviour
It is worth noticing that the process-induced tortuous/buckled cell walls of the PEBA foam F4 () should probably explain why F4 does not exhibit the first densification phase (i). In addition, proves that the EVA foams F1, F2 and F2* reach higher compression stress than the TPU foam F3 which is the denser studied foam (). Also, in ,b) at N = 1, the two specific mechanical properties of the EVA foams are higher than for the TPU foam F3. The possible reason for that is the use of micro-fillers in the EVA foams, acting as reinforcements to enhance the foam-specific mechanical properties. However, as shown in and as quantified in ,d) for N = 1, such reinforced materials present wider hysteresis cycles, larger damping loss factor
and larger residual strain
than the TPU and the PEBA foams F3 and F4. In the literature, filled dense rubbers are known to exhibit higher dissipation energy than unfilled ones (Mzabi et al., Citation2011). A possible explanation to this behaviour is a low compatibility of micro-mineral fillers with the elastomeric EVA matrix. A more cohesive interface between the fillers and the polymer matrix would probably reduce the dissipated energy (i.e. decreases the value of
) of such reinforced midsoles. Furthermore, in the case of filled EVA foams, F1 presents higher specific mechanical properties than F2*, despite its higher porosity (,b) at N = 1). We believe that the heterogeneity in cell size and wall thickness of F2* () should contribute to lower its specific mechanical properties. An optimized microstructure, possibly tailored by the type and the amount of blowing agent used, would certainly improve the performance of F2*.
Energy absorption diagram and optimal microstructures
In , all foams present an abrupt change in their absorbing behaviour above their compression yield strengths (), which is typical of closed cell elastomeric foams (L. J. Gibson & Ashby, Citation1999). The optimal behaviour of a cushioning system tends to maximize the energy absorbed while minimizing compression stress (L. J. Gibson & Ashby, Citation1999). For
< 0.2 MPa, corresponding to the very beginning of the stride, the PEBA foam F4 is, by far, the best energy absorption system. Then comes the TPU foam F3, followed by all EVA foams, F1, F2 and F2*. For
> 0.2 MPa, all foams follow a master curve. shows the energy diagram of all foams normalized by the Young modulus of each solid phase, to assess the microstructure cushioning efficiency (L. J. Gibson & Ashby, Citation1999). This graph proves that the PEBA foam F4 shows the best microstructure energy absorption system whatever the applied stress. The process-induced tortuous cell walls of F4 microstructure, associated with a highly porous and homogeneous structure probably enhances the maximization of the energy absorption while minimizing the compression stress. This is in agreement with the literature according to which buckling of the walls is the main energy absorption mechanism (L. J. Gibson & Ashby, Citation1999). The EVA foams F1, F2 and F2* are the second best microstructures for an efficient energy absorption system. However, the three EVA foams remain difficult to distinguish from each other because they display a porosity ranging from 0.79 to 0.71, a density ranging from 0.13 to 0.23 g cm−3, a microstructure homogeneity ranging from 23% to 61% and a more or less tortuous microstructure. The TPU foam F3 microstructure is the least efficient. With a closer look to the EVA foams F2* and the TPU foam F3, which present the same density, we conclude that the highly heterogeneous hierarchical architectured microstructure of F3 is not so relevant compared to the less heterogeneous microstructure of F2*.
Effect of cycling
In ,b), the EVA foams F1 and F2, with micro-sized fillers and displaying a homogeneous microstructure, belong to the set of foams with the highest specific mechanical properties upon cycling. Thus, the added value of the reinforcing micro-sized fillers is still visible on the specific properties of foams in fatigue. However, in d), they lose 35–40% of their initial , 70% of their initial
, 73–80% of their initial
and gain 304–307% of their initial
upon cycling. Thus, their damage kinetics are faster than those reported for the foam F3. Besides, they still exhibit higher damping loss factor
than the PEBA and the TPU foams F4 and F3 (). Micro-sized fillers may damage the walls upon cycling, increasing their rebound properties and speed up the damage kinetics by creating fillers/matrix decohesion as in filled rubber during fatigue (Le Cam et al., Citation2008).
In d), one note that the TPU foam F3 loses 25% of its initial , 40% of its initial
, 66% of its initial
, and gains only 200% of its initial
upon cycling. Despite its much lower specific mechanical properties, F3 exhibits the slowest damaged kinetics of all other foams by better maintaining its mechanical properties. For these reasons, it can be considered a relevant target as a mechanically durable midsole. Both, the high density of the TPU foam F3 and its double hierarchical architecture probably play a major role in the durability of the foam. The skin envelope of each expanded pellet () could restrain micro-failure cracks initiation and propagation.
Conclusion
Elastomeric foams used as systems for absorbing-releasing energy in the midsoles of running shoes are complex architectured cellular materials. Their mechanical properties depend on (a) their densities, (b) their microstructures features including micro-fillers, pore/cell wall size and shape, and (c) the polymer constituting their solid phases (here: EVA, TPU and PEBA). The whole of these structural features are closely linked to their manufacturing processes.
The foam microstructure plays a major role on mechanical properties during the first compression cycle but also upon cycling. The foam that presents the highest porosity associated with the most tortuous cell walls and with a very homogeneous microstructure is the best cushioning system during the first cycles. However, its damage kinetics upon cycling is rather fast. Micro-sized fillers in the EVA foams act as reinforcements to enhance the foam-specific mechanical properties, but due to the probable weak cohesion of the fillers with the polymer, the foam rebound properties are hindered by important dissipated energy, and their damage kinetics is enhanced. Thus, a proper functionalization of the fillers would probably improve the matrix-fillers cohesion and thus mechanical properties and durability of the reinforced foams. With poor initial specific mechanical properties, the foam exhibiting the slowest damage kinetics displays a dense and hierarchical architectured microstructure that should prevent micro-cracks initiation and propagation. Hence, the trade-off between an optimal energy absorbing/releasing cellular microstructure combined with both a slow damage kinetics and the lightweight design constraint remains a great challenge for midsole manufacturers. Further studies on the evolution of the microstructure during fatigue, and, in parallel, on the development of more biofidelic fatigue tests should confirm/complete these remarks and should provide stronger guidelines to enhance the midsoles design and properties.
Supplemental Material
Download PDF (154.7 KB)Disclosure statement
The authors report there are no competing interests to declare.
Additional information
Funding
References
- Arganda-Carreras, I., Kaynig, V., Rueden, C., Eliceiri, K. W., Schindelin, J., Cardona, A., & Sebastian Seung, H. (2017). Trainable Weka Segmentation: A machine learning tool for microscopy pixel classification. Bioinformatics (Oxford, England), 33(15), 2424–2426. https://doi.org/10.1093/bioinformatics/btx180
- Arkema. (n.d). Peebax. Retrieved 26 October 2022, from https://hpp.arkema.com/en/product/-families/pebax/-elastomer/-family/
- Atwater, A. (1990). Gender differences in distance running. Biomechanics of distance running (pp. 321–362). Human Kinetics Books
- Aurilia, M., Piscitelli, F., Sorrentino, L., Lavorgna, M., & Iannace, e S. (2011). Detailed analysis of dynamic mechanical properties of TPU nanocomposite: The role of the interfaces. European Polymer Journal, 47(5), 925–936. https://doi.org/10.1016/j.eurpolymj.2011.01.005
- BASF. (2022). Elastollan® (TPU)—The thermoplastic polyurethane of BASF. Retrieved 26 October https://plastics-rubber.basf.com/global/en/performance_polymers/products/elastollan.html
- Benedetti, M., Du Plessis, A., Ritchie, R. O., Dallago, M., Razavi, S. M. J., & Berto, F. (2021). Architected cellular materials: A review on their mechanical properties towards fatigue-tolerant design and fabrication. Materials Science and Engineering: R: Reports, 144, 100606. https://doi.org/10.1016/j.mser.2021.100606
- Brückner, K., Odenwald, S., Schwanitz, S., Heidenfelder, J., & Milani, T. (2010). Polyurethane-foam midsoles in running shoes—Impact energy and damping. Procedia Engineering, 2(2), 2789–2793. https://doi.org/10.1016/j.proeng.2010.04.067
- Carotenuto, C., Liana, P. P., Luigi, G., & Et Mario, M. (2019). Viscoelasticity evolution of ethylene-vinyl-acetate copolymers during crystallization. Chemical Engineering Transactions, 74, 1093–1098. https://doi.org/10.3303/CET1974183
- Cavanagh, P. R., & Kram, R. (1989). Stride length in distance running: Velocity, body dimensions, and added mass effects. Medicine and Science in Sports and Exercise, 21(4), 467–479.
- Chalencon, F., Dumont, P. J. J., Orgéas, L., Foray, G., Cavaillé, J.-Y., Maire, E., & Rolland Du, R. (2010). Lubricated compression and X-ray microtomography to analyse the rheology of a fibre-reinforced mortar. Rheologica Acta, 49(3), 221–235. https://doi.org/10.1007/s00397-009-0393-5
- Chambon, N., Delattre, N., Berton, E., Gueguen, N., & Rao, G. (2013). The effect of shoe drop on running pattern. Footwear Science, 5(1), S106–S107. https://doi.org/10.1080/19424280.2013.799585
- Chambon, N., Delattre, N., Guéguen, N., Berton, E., & Rao, G. (2014). Is midsole thickness a key parameter for the running pattern? Gait & Posture, 40(1), 58–63. https://doi.org/10.1016/j.gaitpost.2014.02.005
- Chen, S. C., Lee, K. H., Chang, C. W., Hsu, T. J., & Feng, C. T. (2022). Using gas counter pressure and combined technologies for microcellular injection molding of thermoplastic polyurethane to achieve high foaming qualities and weight reduction. Polymers, 14(10), 2017. https://doi.org/10.3390/polym14102017
- Clarke, T. E., Frederick, E. C., & Cooper, L. B. (1983). Effects of shoe cushioning upon ground reaction forces in running. International Journal of Sports Medicine, 4(4), 247–251. https://doi.org/10.1055/s-2008-1026043
- Cornwall, M. W., & McPoil, T. G. (2017). Can runners perceive changes in heel cushioning as the shoe ages with increase mileage ? International Journal of Sports Physical Therapy, 12(4), 616–624.
- Diani, J. (2021). Free vibrations of linear viscoelastic polymer cantilever beams. Comptes Rendus. Mécanique, 348(10–11), 797–806. https://doi.org/10.5802/crmeca.15
- Doube, M., Kłosowski, M. M., Arganda-Carreras, I., Cordelières, F., Dougherty, R., Jackson, J. S., Schmid, B., Hutchinson, J. R., & Shefelbine, S. J. (2010). BoneJ: Free and extensible bone image analysis in ImageJ. Bone, 47(6), 1076–1079. https://doi.org/10.1016/j.bone.2010.08.023
- Flores, N., Rao, G., Berton, E., & Delattre, N. (2019). The stiff plate location into the shoe influences the running biomechanics. Sports Biomechanics, 20(7), 815–830. https://doi.org/10.1080/14763141.2019.1607541
- Franz, J. R., Wierzbinski, C. M., & Kram, R. (2012). Metabolic cost of running barefoot versus shod: Is lighter better? Medicine and Science in Sports and Exercise, 44(8), 1519–1525. https://doi.org/10.1249/MSS.0b013e3182514a88
- Frederick, E. C. (1984). Sport shoes and playing surfaces. Human Kinetics.
- Frederick, E. C., E. T. Howley, et S. K. Powers (1986) Lower Oxygen Demands of Running in Soft-Soled Shoes. Research Quarterly for Exercise and Sport 57, 2, 174–77. https://doi.org/10.1080/02701367.1986.10762196.
- Fuller, J. T., Bellenger, C. R., Thewlis, D., Tsiros, M. D., & Buckley, J. D. (2015). The effect of footwear on running performance and running economy in distance runners. Sports Medicine (Auckland, N.Z.), 45(3), 411–422. https://doi.org/10.1007/s40279-014-0283-6
- Gadot, B., Riu Martinez, O., Rolland Du Roscoat, S., Bouvard, D., Rodney, D., & Orgéas, L. (2015). Entangled single-wire NiTi material: A porous metal with tunable superelastic and shape memory properties. Acta Materialia, 96, 311–323. https://doi.org/10.1016/j.actamat.2015.06.018
- Gibson, I. J., & Ashby, M. F. (1982). The mechanics of three-dimensional cellular materials. Proceedings of the Royal Society of London. A. Mathematical and Physical Sciences, 382(1782), 43–59. https://doi.org/10.1098/rspa.1982.0088
- Gibson, L. J., & Ashby, M. F. (1999). Cellular solids: Structure and properties. Cambridge University Press. https://doi.org/10.1017/CBO9781139878326
- Guiraud, O., Dumont, P. J. J., Orgéas, L., & Favier, D. (2012). Rheometry of compression moulded fibre-reinforced polymer composites: rheology, compressibility, and friction forces with mould surfaces. Composites Part A: Applied Science and Manufacturing, 43(11), 2107–2119. https://doi.org/10.1016/j.compositesa.2012.06.006
- Hoogkamer, W., Kipp, S., Spiering, B. A., & Kram, R. (2016). Altered running economy directly translates to altered distance-running performance. Medicine and Science in Sports and Exercise, 48(11), 2175–2180. https://doi.org/10.1249/MSS.0000000000001012
- Kinoshita, H., & Bates, B. T. (1996). The effect of environmental temperature on the properties of running shoes. Journal of Applied Biomechanics, 12(2), 258–268. https://doi.org/10.1123/jab.12.2.258
- Le Cam, J. B., Huneau, B., & Verron, E. (2008). Description of fatigue damage in carbon black filled natural rubber. Fatigue & Fracture of Engineering Materials & Structures, 31(12), 1031–1038. https://doi.org/10.1111/j.1460-2695.2008.01293.x
- Le Saux, V., Marco, Y., Calloch, S., Doudard, C., Charrier, P. (2010) Fast Evaluation of the Fatigue Lifetime of Elastomers Based on a Heat Build-up Protocol and Micro-tomography Measurements, International Journal of Fatigue, 32(10), 1582–90. https://doi.org/10.1016/j.ijfatigue.2010.02.014
- Li, T. T., Wang, H., Huang, S.-Y., Lou, C.-W., & Lin, J.-H. (2019). Bioinspired foam composites resembling pomelo peel: Structural design and compressive, bursting and cushioning properties. Composites Part B: Engineering, 172, 290–298. https://doi.org/10.1016/j.compositesb.2019.04.046
- Lippa, N., Hall, E., Piland, S., Gould, T., & Rawlins, J. (2014). Mechanical ageing protocol selection affects macroscopic performance and molecular level properties of Ethylene Vinyl Acetate (EVA) running shoe midsole foam. Procedia Engineering, 72, 285–291. https://doi.org/10.1016/j.proeng.2014.06.082
- Loo, M.S., Le Cam, J.-B., Andriyana, A., Robin, E., Coulon, J.-F. (2016) Effect of swelling on fatigue life of elastomers. Polymer Degradation and Stability, 124, 15–25 https://doi.org/10.1016/j.polymdegradstab.2015.12.001
- Madden, R., Sakaguchi, M., Tomaras, E. K., Wannop, J. W., & Stefanyshyn, D. (2016). Forefoot bending stiffness, running economy and kinematics during overground running. Footwear Science, 8(2), 91–98. https://doi.org/10.1080/19424280.2015.1130754
- Malisoux, L., Delattre, N., Urhausen, A., & Theisen, D. (2019). Shoe cushioning, body mass and running biomechanics as risk factors for running injury: A study protocol for a randomised controlled trial. BMJ Open, 7(8), e017379. https://doi.org/10.1136/bmjopen-2017-017379
- Mills, N. (2007). Running shoe case study, Chapter 13. Polymer foams handbook (pp. 307–327). Kinetics Publ. Inc. https://doi.org/10.1016/B978-075068069-1/50014-3
- Mullins, L. (1969). Softening of rubber by deformation. Rubber Chemistry and Technology, 42(1), 339–362. https://doi.org/10.5254/1.3539210
- Musgjerd, T., Anason, J., Rutherford, D., & Kernozek, T. W. (2021). Effect of increasing running cadence on peak impact force in an outdoor environment. International Journal of Sports Physical Therapy, 16(4), 1076–1083. https://doi.org/10.26603/001c.25166
- Mzabi, S., Berghezan, D., Roux, S., Hild, F., & Creton, C. (2011). A critical local energy release rate criterion for fatigue fracture of elastomers. Journal of Polymer Science Part B: Polymer Physics, 49(21), 1518–1524. https://doi.org/10.1002/polb.22338
- Nigg, B. M. (Ed.). (1986). Biomechanics of running shoes. Human Kinetics.
- Nigg, B. M., Baltich, J., Maurer, C., & Federolf, P. (2012). Shoe midsole hardness, sex and age effects on lower extremity kinematics during running. Journal of Biomechanics, 45(9), 1692–1697. https://doi.org/10.1016/j.jbiomech.2012.03.027
- Oeveren, B. T. v., Ruiter, C. J. d., Beek, P. J., & Dieën, J. H. v (2017). Optimal stride frequencies in running at different speeds. PLoS One, 12(10), e0184273. https://doi.org/10.1371/journal.pone.0184273
- Pardo-Alonso, S., Solórzano, E., Vicente, J., Brabant, L., Dierick, M. L., Manke, I., Hilger, A., Laguna, E., & Rodriguez-Perez, M. A. (2015). Micro-CT-based analysis of the solid phase in foams: Cell wall corrugation and other microscopic features. Microscopy and Microanalysis, 21(5), 1361–1371. https://doi.org/10.1017/S1431927615014890
- Patterson, B. M., Cordes, N. L., Henderson, K., Williams, J. J., Stannard, T., Singh, S. S., Ovejero, A. R., Xiao, X., Robinson, M., & Chawla, N. (2016). In situ X-ray synchrotron tomographic imaging during the compression of hyper-elastic polymeric materials. Journal of Materials Science, 51(1), 171–187. https://doi.org/10.1007/s10853-015-9355-8
- Rethnam, U., R., Makwana N. (2011) Are old running shoes detrimental to your feet? A pedobarographic study. BMC Research Notes 4, 1, 307. https://doi.org/10.1186/1756-0500-4-307.
- Schindelin, J., Arganda-Carreras, I., Frise, E., Kaynig, V., Longair, M., Pietzsch, T., Preibisch, S., Rueden, C., Saalfeld, S., Schmid, B., Tinevez, J.-Y., White, D. J., Hartenstein, V., Eliceiri, K., Tomancak, P., & Cardona, A. (2012). Fiji: An open-source platform for biological-image analysis. Nature Methods, 9(7), 676–682. https://doi.org/10.1038/nmeth.2019
- Shen, Y., Golnaraghi, F., & Plumtree, A. (2001). Modelling compressive cyclic stress strain behaviour of structural foam. International Journal of Fatigue, 23(6), 491–497. https://doi.org/10.1016/S0142-1123(01)00014-7
- Shimazaki, Y., Nozu, S., & Inoue, T. (2016). Shock-absorption properties of functionally graded EVA laminates for footwear design. Polymer Testing, 54, 98–103. https://doi.org/10.1016/j.polymertesting.2016.04.024
- Silva, R. M., Rodrigues, J. L., Pinto, V. V., Ferreira, M. J., Russo, R., & Pereira, C. M. (2009). Evaluation of shock absorption properties of rubber materials regarding footwear applications. Polymer Testing, 28(6), 642–647. https://doi.org/10.1016/j.polymertesting.2009.05.007
- Sinclair, J., R. Mcgrath, O. Brook, P. J. Taylor, et S. Dillon (2016) Influence of Footwear Designed to Boost Energy Return on Running Economy in Comparison to a Conventional Running Shoe, Journal of Sports Sciences 34(11), 1094 98. https://doi.org/10.1080/02640414.2015.1088961
- Singaravelu, A. S. S., Williams, J. J., Ruppert, J., Henderson, M., Holmes, C., & Chawla, N. (2020). In situ X-ray microtomography of the compression behaviour of eTPU bead foams with a unique graded structure. Journal of Materials Science, 56(8), 5082–5099. https://doi.org/10.1007/s10853-020-05621-3
- Sun, X., Lam, W.-K., Zhang, X., Wang, J., & Fu, W. (2020). Systematic review of the role of footwear constructions in running biomechanics: Implications for running-related injury and performance. Journal of Sports Science & Medicine, 19(1), 20–37.
- Taunton, J. E., Ryan, M. B., Clement, D. B., McKenzie, D. C., Lloyd-Smith, D. R., & Zumbo, B. D. (2002). A retrospective case-control analysis of 2002 running injuries. British Journal of Sports Medicine, 36(2), 95–101. https://doi.org/10.1136/bjsm.36.2.95
- Taylor, S. A., Fabricant, P. D., Michael Khair, M., Haleem, A. M., & Drakos, e M. C. (2012). A review of synthetic playing surfaces, the shoe-surface interface, and lower extremity injuries in athletes. The Physician and Sportsmedicine, 40(4), 66–72. https://doi.org/10.3810/psm.2012.11.1989
- Taunton, J. E., Ryan, M., Clement, D., McKenzie, D., Lloyd-Smith, D., & Zumbo, B. (2003). A prospective study of running injuries: The vancouver sun run ‘in training’ clinics. British Journal of Sports Medicine, 37(3), 239–244. https://doi.org/10.1136/bjsm.37.3.239
- Verdejo, R. (2004). Gas loss and durability of EVA foams used in running shoes [PhD thesis]. University of Birmingham. https://etheses.bham.ac.uk/id/eprint/231/.
- Verdejo, R., & Mills, N. J. (2002). Performance of EVA foam in running shoes. The engineering of sport (Vol. 4, pp. 580–588). Blackwell Science.
- Verdejo, R., & Mills, N. J. (2004a). Heel–shoe interactions and the durability of EVA foam running-shoe midsoles. Journal of Biomechanics, 37(9), 1379–1386. https://doi.org/10.1016/j.jbiomech.2003.12.022
- Verdejo, R., & Mills, N. J. (2004b). Simulating the effects of long distance running on shoe midsole foam. Polymer Testing, 23(5), 567–574. https://doi.org/10.1016/j.polymertesting.2003.11.005
- Worobets, Jay, John William Wannop, Elias Tomaras, et Darren Stefanyshyn (2014) Softer and more resilient running shoe cushioning properties enhance running economy, Footwear Science 6(3), 147 53, https://doi.org/10.1080/19424280.2014.918184.
- Zhang, D., Scarpa, F., Ma, Y., Boba, K., Hong, J., & Lu, H. (2013). Compression mechanics of nickel-based superalloy metal rubber. Materials Science and Engineering: A, 580, 305–312. https://doi.org/10.1016/j.msea.2013.05.064
Appendices
Parameters for the X-ray tomography at macroscale
At macroscale, i.e. to visualize the vertical slices of soles shown in , we use a laboratory X-ray tomograph from RX Solutions with the following parameters: source type: Hamamatsu equipped with a tungsten filament, mode: large spot, detector flat panel: VARIAN, tension: 150 kV, target current: 450 µA, frame rate: 12 s−1, number of averaged frames: 6, number of projections: 2240, so as to obtain a 1003 µm3 voxel size.
Image analysis
A 3D region of interest (ROI) was defined in the core of each reconstructed volume as a representative volume element for which the following structural properties converge to constant values (Benedetti et al., Citation2021) and that avoid any edge effects due to image acquisition or to sample preparation (dimensions: 750 × 750 × 750 µm3).
The different phases of the sample were segmented for descriptor quantification, and to refine this step, the plugin Trainable Weka Segmentation 3D (Arganda-Carreras et al., Citation2017) was used together with a Fast Random Forest algorithm to keep very thin cellular walls. A zoom in the ROI is presented in Figure SIa was the white, the green and the red colours represent respectively the mineral fillers, the elastomeric walls and the cells. The classifier was trained by the operator using the mean and the variance of grey level of neighbour voxels to segment phases, as shown in Figure SIb and c in the 2D and 3D black and white renderings. Porosity ϕ, was obtained by dividing the number of pore voxels by the total number of voxels in the ROI. The wall thickness, t, was evaluated using the Thickness function of the plugin BoneJ (Doube et al., Citation2010) in which for each voxel of the solid phase, the greatest sphere diameter, that fits within the structure and contains the voxel, is given. The cell size, C, was evaluated using this same function on the cell to give a representative diameter of the largest sphere contained in cells, knowing that for anisotropic cells, the value under-estimated their real size.