
 ?Mathematical formulae have been encoded as MathML and are displayed in this HTML version using MathJax in order to improve their display. Uncheck the box to turn MathJax off. This feature requires Javascript. Click on a formula to zoom.
Abstract
Information on land forest cover changes and carbon stocks in karst areas is vital for management planning. Therefore, an analysis of the dynamics of land forest cover, carbon stocks of secondary karst forests, and their future projections is necessary. This study aimed to analyze the carbon stocks of secondary forests, forest cover change, and their projections in karst areas. We used 43 sample plots of 20 m x 20 m to measure Above Ground Biomass (AGB) and soil organic carbon stocks. Forest cover data were collected using remote sensing and GIS tools. Data analysis of the ABG of the secondary forest for the karst plain and karst tower was conducted using the Chave equation. Land-cover change was analyzed by delineating the 2011, 2016, and 2021 land-cover data from satellite imagery and testing the accuracy using survey data fields and high-resolution images. Land-cover projections for 2026 and 2031 were obtained using Cellular Automata Markov (CA-Markov) analysis. The results revealed ten land cover types in the karst area of the Bulusaraung Forest Management Unit (FMU). Secondary dryland karst forests (tower and plain karst) were the dominant forest types (60%) in the Maros-Pangkep essential karst ecosystem area. Both karst types of secondary forests are relatively high carbon stores. Data projection shows that the mining area will grow extensively by 2031. Secondary dryland karst forests will be degraded by 15.5% in 20 years due to increased mining activities, conversion to paddy fields, dryland agriculture, and mixed dryland agriculture. Karst ecosystems are vital for carbon and water storage. Therefore, some strategies are required for the sustainable management of Maros-Pangkep Karst are as follows: (i) controlling the opening of mining areas according to sustainable environmental principles, (ii) encouraging the implementation of post-mining land rehabilitation, (iii) increasing public awareness of the importance of preserving karst areas, and (iv) implementing soil conservation rules by prioritizing agroforestry systems in dryland farming.
1. Introduction
In recent decades, karst areas have received special attention from experts for their ability to mitigate climate change by storing carbon (C) pools and reducing atmospheric CO2. Karst areas account for 15% of the earth’s landmass (Song et al., Citation2017), and approximately 25% of the world’s population depends on ecosystem services (Xiao & Weng, Citation2007). Karst areas are important carbon sinks in the terrestrial pool and play a significant role in the global carbon cycle and climate change. Zhang et al. (Citation2022) stated that karst areas have a significant carbon sink capacity and contribute 29.4% of the terrestrial CO2. Falkowski et al. (Citation2000) reported that karst areas had more than 6 × 10⁷ Pg C. In other words, 99% of the total carbon on earth is stored in carbonate rocks (Falkowski et al., Citation2000), which constitute the largest carbon stores on earth (Cao et al., Citation2016; Martin, Citation2017). Carbonate rocks also store carbon for millions of years (Wu & Wu, Citation2022).
In Indonesia, 154,000 km2 of tropical karst areas streches from Sumatra to Papua (Samodra, Citation2003) with high rainfall, and intensive karstification processes significantly contribute to carbon storage. Haryono (Citation2011) stated that in Indonesian tropical karsts, every 1 ton dissolution of limestone is followed by the absorption of 0.12 tons of CO2 from the atmosphere. For example, Jonggrangan karst absorbs 12,900 tons of CO2 yr−1, while Gunungsewu karst absorbs 293,800 tons of CO2 yr−1 (Cahyadi, Citation2010).
The carbon storage process in karst areas involves not only non-living elements and hydrogeological processes, but also biotic elements and biological processes. Cao et al. (Citation2023); Wu and Wu (Citation2022); Yang et al. (Citation2015) reported that photosynthetic organisms play vital roles in carbon sink processes. Karst forest ecosystems are widely recognized as crucial agents for absorbing greenhouse gases and mitigating climate change (Kang et al., Citation2020; Kang & He, Citation2013). Various vegetation types that form karst forests play essential roles in carbon sequestration (Huang et al., Citation2015; Liu et al., Citation2020; Ni et al., Citation2015; Wu & Wu, Citation2022) and enhance the carbon sink capacity of ecosystems (Yang et al., Citation2022). The capability and stability of karst carbon sinks increase significantly with the presence of forest cover (Jackson et al., Citation2005; Tong et al., Citation2018). Li (Citation2012) and Luo et al. (Citation2005) stated that karst vegetation restoration increased karst carbon sinks by 19–23%. Furthermore, Zhang (Citation2011) stated that land-cover transformation in karst areas affects carbon sinks. Karst carbon sinks in secondary and primary forests were three and nine times higher, respectively, than those in shrubland.
However, research on the roles of karst forests in carbon storage in Indonesia is limited (Danardono et al., 2019; Sari et al., Citation2021). A lack of comprehensive research has led to inadequate data on carbon storage in national-level karst forests. This information is vital for climate change mitigation, biodiversity conservation, fulfilling international reporting obligations, and guiding evidence-based policymaking and resource management decisions. An understanding of carbon storage not only facilitates progress tracking and impact assessment of land-use changes but also contributes significantly to global commitment in combating climate change. Therefore, this study analyzed the role of forests in the Maros-Pangkep karst in carbon storage and sequestration. This study was conducted in the Maros-Pangkep karst area, which is essential for Indonesia and the world. The Maros-Pangkep Karst is part of the Maros-Pangkep UNESCO Global Geopark, one of 195 UNESCO global parks in 48 countries (International Geoscience and Geoparks Programme, Citation2023). This tower karst is higher than 200 m (Srijono, Citation2008) and is the only tower karst in Indonesia (Yusran, Citation2017).
Research on the roles of forests in the Maros-Pangkep karst area in carbon storage is essential because Drew (Citation2017) and Zhao et al. (Citation2020) state that karst is a fragile ecosystem and is easily damaged by human activities. Additionally, the pressure and negative impacts caused by human activity in karst areas are relatively high (Jiang et al., Citation2014; Parise & Gunn, Citation2007) and can disrupt and change karst areas. This condition was also observed in the Maros-Pangkep karst area. In this area, the potential for environmental change, forest degradation, and changes in carbon storage due to human activity is high. This can be seen from the activities of local communities that change forests for agriculture to meet their daily needs, and even use this area for large-scale limestone mining activities, which produce cement and marble for national demand (Budiyanto et al.; Fatinaware et al., Citation2019). It is crucial to determine the dynamics of changes in forest cover in the essential ecosystem of the Maros-Pangkep karst. This change can be observed in vegetation cover dynamics (Peng et al., Citation2021). Therefore, this study aimed to (1) determine carbon storage in secondary forest karst areas in the Maros-Pangkep Karst and (2) analyze forest carbon change and its projections based on forest cover dynamics in the karst area managed by the Bulusaraung Forest Management Unit (FMU). We hypothesized that the aboveground carbon of forest is higher than other land covers, and the land cover will gradually change into more open area. Remote sensing and Geographic Information Systems (GIS) were used to identify forest cover changes and predict future land cover projections. These technologies have been recognized as effective over a certain period (Obiahu et al., Citation2021; Setya & Wiryani, Citation2019). Our findings provide recommendations for FMU managers for better and more sustainable karst ecosystem management.
2. Materials and Methods
2.1 Study area
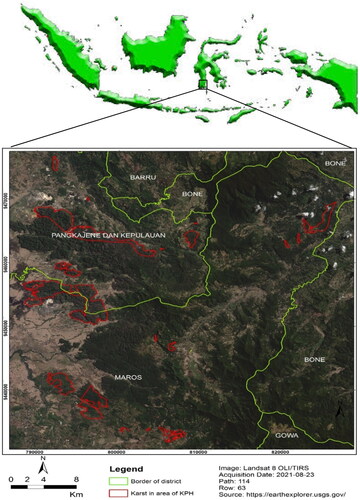
The Maros–Pangkep karst area is a part of the Maros–Pangkep UNESCO Global Geopark. This karst area has an area of approximately 46,200 ha and covers five regencies: Pangkajene, Kepulauan (Pangkep), Maros, Barru, Bone, and Jeneponto (Achmad & Hamzah, Citation2016). This research was conducted in November 2021 to Januari 2022 in the Maros-Pangkep karst area, which is managed by the Bulusaraung FMU under the coordination of the South Sulawesi provincial government. The Bulusaraung FMU was established based on South Sulawesi Governor Regulation Number 134 on 2017 September 8, 2017. Bulusaraung FMU manages protected and production forests, which are administratively located in two regencies, Maros and Pangkep, South Sulawesi Province, Indonesia. The study area and karst distribution are shown in .
Figure 1. Study area and the karst distribution
2.2 Forest carbon measurement
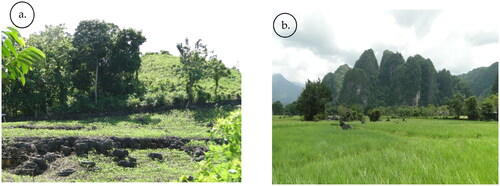
Based on the karst formation in the forest area, the study area was divided into two types: 1) plain karst, which is located in the Maros Regency and is characterized by small and low features spread across the study site. Most are underground, so only a few are visible; 2) tower karst, which is located in the Pangkep Regency with high and steep cliffs reaching up to tens of meters. In the tower karst, data collection was absent when the elevation was nearly 90°. We recorded data only from secondary forests located in accessible areas. A total 43 sample plots were established: 20 on the karst plain and 23 in the karst tower. The plain and tower karsts in the Maros-Pangkep area are shown in Appendix 1.
The methods for data collection and analysis were based on SNI 7724:2011 (Badan Standardisasi Nasional, Citation2019) for ground-based forest carbon accounting. Field data were collected from rectangular and square plots. The selection of plots depended on the field conditions. For example, rectangular plots were generated when the observation site was located at the edge of two karst cliffs. Rectangular plots were selected when they were located in narrow areas (Putri et al., Citation2017). Nevertheless, the minimum size of the plots remained uniform at 400 m2 (Badan Standardisasi Nasional, Citation2019).
Vegetation data were sampled by applying a line transect method (Fachrul, Citation2012) at a distance of 50 m. Inside of each plot, we established 4 (four) nested sub-plots for the trees (20 m × 20 m), poles (10 m × 10 m), saplings (5 m × 5 m), and understories and seedlings (2 m × 2 m) in each plot. We defined (i) tree as woody vegetation with a diameter at the breast height (DBH) > 20 cm, (ii) pole as woody vegetation with DBH > 10 cm and < 20 cm, (iii) sapling as woody vegetation with DBH 2 cm – 10 cm, and (iv) seedling as woody vegetation with DBH < 2 cm and height ≤ 1,5 m; and (v) understory as vegetation grown on forest floor including herbs, ferns, and shrubs (Badan Standardisasi Nasional, Citation2019). During fieldwork, we recorded all data including the name of the species, DBH, and the total height of the plant.
We also collected data on other carbon pools, including (i) herbs or understory, (ii) litter, (iii) standing dead wood, (iv) fallen dead wood, and (v) soil organic matter. Herbs or understory data were obtained from plots of 2 m × 2 m. The aboveground biomass of the herbs and understory were cut and collected destructively. The total biomass was then weighed and 300 g was sub-sampled and stored in a plastic bag for laboratory analysis (Badan Standardisasi Nasional, Citation2019).
Necromass measurements were performed in 2 m × 2 m plots. All the litter samples were collected and weighed. A total of 300 g of litter was subsampled and stored in plastic bags for laboratory analysis. A geometric method was applied to measure necromass of dead standing trees within plots of 20 m × 20 m. Data on DBH and tree height were recorded in a notebook. The wood samples were collected for laboratory analysis. For fallen dead wood, necromass was measured based on the volume. We collected data in plots of 20 m × 20 m, including ground and top diameters and wood length (Badan Standardisasi Nasional, Citation2019).
Soil organic matter samples were taken from 0 cm – 10 cm depth in plot of 20 m x 20 m. Samples were derived from the center and each of the four corners of the plots used destructive sampling method. All collected samples were then combined (Badan Standardisasi Nasional, Citation2019). C organic stock was analyzed using Walkley and Black method at the Soil Laboratory of the Agricultural Faculty of Hasanuddin University. We also used soil ring samples to collect soil from 0 cm – 10 cm depth to measure the bulk density of soil.
Aboveground biomass in the secondary forest of karst plain and tower karst was determined using an allometric Equationequation (1)(1)
(1) developed by Chave et al. (Citation2005).
(1)
(1)
where:
AGB = aboveground biomass (kg tree−1)
D = diameter at breast height (cm)
ρ = wood density (g cm−3), derived from ICRAF database (http://db.worldagroforestry.org/wd)
H = tree height (m)
Carbon from each carbon pool, including understory, seedling, sapling, pole, tree, litter, and necromass, was analyzed using the formula:
(2)
(2)
where:
Cb = Carbon of biomass (kg)
B = Total biomass (kg)
% C organic = the carbon percentage (0,47)
Carbon Dioxide (CO2) absorption was estimated using formula (2) from Brown (Citation1997) to calculate CO2 absorption:
(2)
(2)
Where:
CO2 = carbon dioxide absorption
Mr CO2 = CO2 relative molecular weight (44)
Ar C = C molecular weight (12)
Cb = carbon biomass
An independent sample T-test was used to test the hypothesis that there are differences in the carbon stock and carbon sequestration of karst plains and karst towers.
2.3 Forest cover changes
The first stage was to determine the area of interest using a boundary map of the Bulusaraung FMU and a map of the Maros-Pangkep karst area. ArcGIS software was used to intersect the map of the Bulusaraung FMU area with the map of the Maros-Pangkep karst essential ecosystem area. The resulting map indicated the karst areas within the FMU working area. Next, Landsat image preparation and land cover delineation were performed using ArcGIS software. Landsat 7 ETM + path 114 row 63 acquisition September 21, 2011, Landsat 8 OLI/TIRS path 114 row 63 acquisition September 10, 2016, and Landsat 8 OLI/TIRS path 114 row 63 acquisition August 23, 2021, were used for land cover delineation. A visual method (onscreen digitization) was applied for image interpretation (Jensen, Citation2015) for the 2011, 2016, and 2021 time series. The year 2011 was chosen as the starting point for the observations considering the availability of high-resolution satellite images for accuracy testing.
The pan-sharpened mode was used with a spatial resolution of 15 m for image interpretation (Gilbertson et al., Citation2017). A land-cover survey was conducted to obtain a training area to determine the type of land cover. Information on land cover type was obtained directly from visual observations in the field assisted by a drone. Field data locations were recorded using a handheld global positioning system (GPS).
The land cover maps generated from the interpretation of Landsat imagery must be tested for accuracy based on the results of the field check and by verifying the appearance of high-resolution images from Google Earth Pro from September 2011 to October 2021. An accuracy test was performed using the confusion matrix method (Lillesand et al., Citation2015), which compared the types of cover interpretation results with the actual conditions in the form of a sample plot. The accuracy is expressed by the Kappa coefficient (K), which is calculated using EquationEquation (3)(3)
(3) (Lillesand et al., Citation2015; Richards & Jia, Citation2006).
(3)
(3)
Remark:
N = The total number of samples in the confusion matrix
Xii = number of samples on the main diagonal of the confusion matrix
Xi+ = the number of samples of all columns in a row
X + i = number of samples of all rows in a column
After obtaining land cover maps for 2011, 2016, and 2021, projections for 2026 and 2031 were obtained using the cellular automata (CA) system approach. A CA is a discrete dynamic system that works spatially and temporally according to a specific pattern in the same area (Hand, Citation2005). CA has been successfully integrated into a model in IDRISI software, making it easier to use in LULC modelling (Hadi et al., Citation2014).
Land cover projection was performed using the Cellular Automata Markov (CA-Markov) module in the IDRISI-Selva software (Mannan et al., Citation2019). Initially, the Markovian transition estimator was run with land cover raster maps as inputs for 2011 and 2016 to produce the following: 1) a Markov transition area file (a text file that contains the number of pixels that are expected to change from one land cover type), and 2) image files of transition suitability. Furthermore, the projection with iterations was set to five to produce a map of land cover projections for 2021, and the map was validated using the existing (2021) land cover map. Validation was performed in two ways: utilizing the validation and Crosstab modules on IDRISI-Selva. If the result is higher than 0.8, the land-cover projection process for 2026 and 2031 can continue. Changes in land cover and projection maps were analyzed to determine the trends of spatial and temporal changes (Ait El Haj et al., Citation2023; Aneesha Satya et al., Citation2020).
3. Results
3.1 Forest Biomass, Carbon stock, and Sequestration
The results showed differences in the volume of carbon stocks stored in vegetation, necromass (litter, standing dead wood, and fallen dead wood), and soil (). Carbon measurements of the vegetation showed that the tree stage contributed the most to biomass and carbon stocks. Carbon stock measurements conducted on the necromass showed that the litter shared the largest proportion of carbon stocks. The results also showed that the soil carbon stock in karst areas was higher than that in vegetation and necromass.
Table 1. Biomass and carbon stock of karst plain and karst tower
The results of independent sample T test analyses showed that there were no significant differences in carbon stock and carbon sequestration between the karst plains and karst towers ( and ). T-test analysis is shown in the Appendix 2.
Table 2. Carbon sequestration of each type of area.
3.2 Forest cover changes
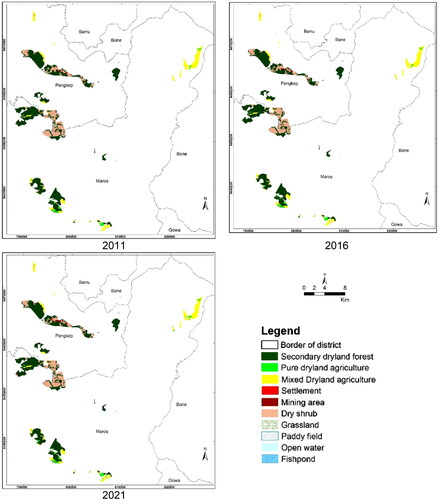
Land-cover delineation based on the interpretation of satellite imagery resulted in land-cover maps for 2011, 2016, and 2021 ().
Figure 2. Map of land cover changes 2011 – 2021
Field observations of 81 points were made to obtain an overview of the land cover and were used to calculate the accuracy of the resulting map. The accuracy test result in showed a Kappa index of 94.2% and overall accuracy of 96.3%; indicating the map resulted from the interpretation was acceptable.
Table 3. The result of accuracy test
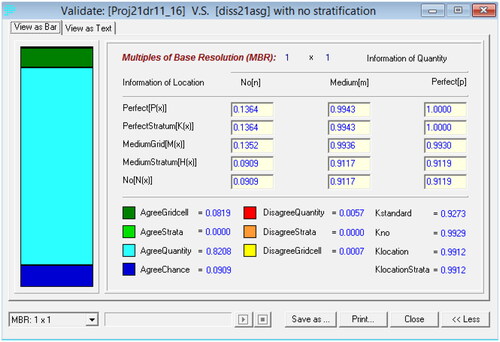
Furthermore, predictions of land cover in 2021 were made based on land-cover maps for 2011 and 2016. The prediction result was validated using the IDRISI-Selva software by comparing it with the actual land cover map for 2021. The results of the validation module as shown in indicates that the K-standard value is 0.93. Using the crosstab module, the validation also resulted in a very high value, as indicated by the overall Kappa Index of Agreement (KIA) of 0.93.
Figure 3. Validation results of land cover projection in 2021
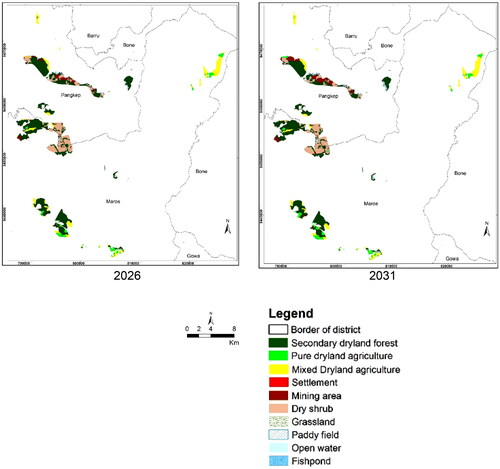
Based on the feasibility of the projection model, the following predictions were made for the land cover in 2026 and 2031, as shown in .
Figure 4. Land cover map projections of 2026 and 2031
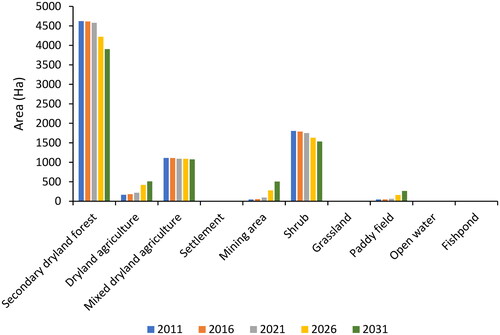
Based on the results of the land-cover mapping from 2011 to 2031, the area dynamics for each land-cover class are illustrated in .
Figure 5. The dynamic area of each land cover type
Appendix 1. Two types of karst at the Maros – Pangkep area. a. Plain karst; b. Tower karst.
shows that dryland agriculture, mining areas, and paddy fields tend to increase in size; secondary dryland forests, mixed dryland agriculture, and shrubs tend to decrease, whereas others tend to stagnate. Secondary dryland forest is the land-cover type with the most significant decreasing trend, whereas mining is experiencing the fastest increasing trend. Details of the area and percentage of each land cover class are listed in .
Table 4. Actual and projection of land cover at the karst area of Bulusaraung FMU
indicates a projected decrease in the area of forest cover in 2031 of 718.3 ha or a decrease of 15.5% compared to 2011. Based on the results of the spatial analysis, changes in forest cover were due to change in other land-cover types, as presented in .
Table 5. Details of changes in forest cover to/from other land cover
shows that changes in the area of forest cover are more dominant due to area conversion of mining, paddy fields and dryland agriculture. This condition was not offset by the increase in forest cover area, which in total only increased by 9.2 ha in a period of 20 years, mainly in the form of shrubs.
In line with , based on the predictions of the dynamics of the secondary forest area on karst and the dynamics of karst forest carbon stock, a decrease in both the total area of secondary dryland forest and carbon stock in the two types of karst topography (karst tower and karst plain) is shown in .
Table 6. Dynamic carbon stock prediction based on land cover change prediction
4. Discussion
4.1. Karst forest carbon stock
The secondary forest on the Maros-Pangkep karst is quite good as a carbon storage. This can be seen from the slightly higher carbon stocks in the secondary karst forest in Bulusaraung FMU than in the karst secondary forest in Southwestern China, which was 70.3 Mg ha−1 (Liu et al., Citation2016). However, the carbon stocks of the secondary forest of karst plain Maros and the secondary forest of tower karst Pangkep which are 78.11 ton ha−1 and 75.51 ton ha−1 respectively, are lower than that of secondary karst forest at Cirebon, which was 87.18 ton ha−1 (Yulistyarini et al., Citation2016). Zhang et al. (Citation2022) stated that there are differences in the amount of soil organic carbon in karst forests caused by differences in the successional stage and soil carbon input. Other factors that might affect the variation in carbon stock at different locations include soil thickness, the composition of plant species at the two locations, and the difference in the litter amount, which is part of the primary source of aboveground carbon input.
There were slight differences in the biomass, carbon stock, and carbon sequestration of secondary forest vegetation between the karst tower and the karst plain. The karst plain biomass, carbon stock, and carbon sequestration were slightly higher than those of the karst tower because of physical environmental conditions, such as topography and soil thickness. Karst rocks sporadically appear as irregular cones or small hills on the karst plain. Most karst bodies are located beneath thick layers of soil. The soil resulting from the sedimentation process over thousands of years had relatively high organic matter and nutrient content. This allows plants that live above the karst plain area to have a better growth rate than those in the karst tower; this results in the karst plain having a higher biomass, carbon stock, and carbon sequestration than the karst tower.
Soils in the secondary karst forest area of Maros play a vital role in carbon storage. The soil carbon stock content in the Maros-Pangkep karst secondary forest area () was also higher than that carbon in several karst locations in Southwestern China, as reported by Wang et al. (Citation2021). The karst plain contained a higher aboveground biomass and C-stock (from vegetation and necromass) than the karst tower; however, it contained a lower soil C-stock (). The carbon content variation in the soil SOC in tower karst and plain karst may be due to differences in the slope gradient. This is consistent with the findings of Zhang et al. (Citation2019), who stated that differences in soil thickness, slope gradient, and rock exposure caused differences in SOC. In addition, community activity factors play an important role in causing differences in SOC (Ran et al., Citation2023). Zhang et al. (Citation2020) stated that human disturbance is a strong driving force influencing the SOC. Li et al. (Citation2020) stated that anthropogenic factors affect the amount of leaf litter that becomes soil carbon input. Areas with minimal human activity had more leaf litter than areas with high human activity. The sloping topography of the karst plain makes this area more accessible to the community than the karst towers.
4.2 Land cover change of the FMU Bulusaraung
Social-ecological systems are greatly influenced by interactions between humans and nature which have long-term impacts on environment sustainability. Human driving factors have significantly changed natural conditions including karst ecosystem in most regions of the world. High-intensity human activities have placed greater pressure on the natural environment to regulate itself and restore its condition. Consequently, human actions and interactions emerge as the main forces driving change and reshaping of national territorial patterns. These phenomena also accurs in the research site where human activities have significantly change the shape of karst ecosystem (Li et al., Citation2024). In the research site, land cover analysis for the period 2011–2021 shows ten types of land cover in the karst area of the Bulusaraung FMU. The most dominant existing land cover type is secondary dryland forest with a composition of almost 60%, followed by shrubs and mixed dryland agriculture. The other seven land cover types () have a small area, with each accounting for less than 3%. The three smallest land cover types were settlements, open water, and fishponds. The contribution of the three was less than 0.1% in the period 2011–2031 with constant growth, and then tended to decrease.
The land cover change analysis also showed that the highest percentage of land cover reduction occurred in secondary dryland forest cover (15.5% in 20 years). Spatial analysis of land cover projections showed a decrease from 4,623 ha of secondary dryland forests in 2011 to 3,904 ha by 2031 (). shows that 718.3 ha forest cover change was mainly caused by deforestation due to mining activities (44%), followed by conversion to paddy field (28.7%), dryland agriculture (14.5%), and mixed dryland agriculture (11.5%). This findings are in accordance with the study from Lezhava et al. (Citation2020) in Zemo Imereti Plateau, located in the easternmost part of the limestone region of western Georgia and is Caucasus’ only karst plateau who revealed that the karst landscape has been completely transformed due to human strong economic activities, mainly related to the manganese unplanned, predatory extraction. The occurrence of deforestation and degradation in karst areas affects the role of karst forests in carbon sequestration. The decreasing trend of the secondary dryland forest cover is also occurring nationally. Government data shows the area of secondary dryland forest cover decreased from 38,979,000 ha; 36,506,100 ha; 35,960,600 ha in 2011, 2016, and 2021 respectively. However, the trend of increasing area occurred in mining areas and paddy fields nationally. Mining area increased from 539,500 ha; 677,000 ha; and 981,000 ha in 2011, 2016, and 2021, respectively. Paddy fields also escalated steeply from 7,118,200 ha; 7,841,200 ha; and 8,088,600 ha in 2011, 2016, and 2021, respectively (Mutiara et al., Citation2018; Rahayu, Citation2012; Ratnasari & Tosiani, Citation2022).
The land cover for paddy fields and dryland agriculture in the research site has increased extensively. Based on field observations, these agricultural lands developed on moderate to gentle slopes of hills or tower karsts. Although land conversion into agricultural land has a lower impact than mining activities (Gbedzi et al., Citation2022), agricultural activities closer to karst areas increase the threat to karst sustainability. A closer distance between karst and community activities increases the intensity of the community accessing karst areas and utilizing various natural resources in the karst ecosystem to support their livelihoods (Breg Valjavec et al., Citation2018). However, karst ecosystems are sensitive to agricultural activities due to pesticide and chemical fertilizer application as well as improper soil conservation practices. These activities will increase runoff, erosion rates, water pollution, and weaken climate change mitigation efforts (Jelev et al., Citation2021).
Another change in the secondary karst forest was predicted to be mixed dryland agriculture (approximately 11.51%). Although forests have been converted into mixed dryland agriculture over a period of 20 years ( and ), there has been a decline in the area of mixed dryland agriculture. This is because the rate of increase in mixed dryland agricultural areas originating from forest cover is smaller than the rate of conversion for other uses, particularly dryland agriculture. Mixed dryland agriculture is an agroforestry system that is dominated by woody plants and fruit trees. In some locations, woody plants are combined with food crops and bamboo plants. The change in forest area to mixed dryland agriculture indicates forest encroachment by communities, similar to that of another FMU in Indonesia reported by Rijal et al. (Citation2019); Yurike et al. (Citation2021). Based on further analysis, after this change, the area of mixed dryland agriculture is predicted to decrease by 3.2% by 2031. Mixed dryland agriculture with an abundance of long-lived trees can play a role in carbon storage and climate change mitigation (Ghale et al., Citation2022). Moreover, our field observations showed that the communities applied the concept of agroforestry, which is characterized by the dominance of woody plants with wood and fruit production orientations. Mixed woodlots improved soil properties and might be considered as a technique for restoring degraded dryland soils while also acting as key carbon dioxide and nitrogen sinks (Syano et al., Citation2023). In some locations, woody plants are combined with bamboo or other food crops. Areas with many long-lived trees, such as mixed dryland agricultural areas, can absorb and store carbon for long periods of time.
Based on the projections analyzed until 2031, the Maros-Pangkep karst area managed by the Bulusaraung FMU faces a threat of significant land use change. Our predictions show that the secondary karst forest area will decrease and be replaced by other areas, such as mining areas, which will contribute to the most significant increase. In 2011, the mining area was only 47.2 ha or 0.6% of the total area, and it is projected that the mining area will increase by up to 459 ha or an increase of almost ten times in 2031. This is a serious threat; a large mining area disturbs the karst landscape, thus affecting geomorphological conditions and eliminating the hydrological, biodiversity, climate change, and social functions of karst (He et al., Citation2021). Various forms of illegal mining in the Maros-Pangkep karst area require serious attention because several large mining areas for cement companies are officially recognized by the government and are located outside the Bulusaraung FMU. Apart from legal mines, there are illegal mines in the Maros-Pangkep karst area as well, for example, collecting limestone for building materials. Mining, which disregards the environment, negatively impacts karst sustainability.
Based on the land cover change analysis, it is necessary to anticipate a decrease in the forest cover area due to increased illegal mining and agricultural land. Mining in karst areas should be conducted within a specific limited area and set at a location with minimal negative environmental impacts. Legal mining has been accommodated; thus, the government should no longer open opportunities for other forms of illegal mining outside the permitted areas. Additionally, the deforestation and forest degradation of the karst Maros-Pangkep will impact the role of karst as a water reservoir, affecting the sustainability of springs from the karst area. In addition, post-mining land rehabilitation must be considered so that the succession process in disturbed areas may occur faster and benefit ecological and economic functions. A study on a karst area in China showed that successful reforestation in a karst area restored the flow of springs after they did not flow due to deforestation (Kang et al., Citation2020). Furthermore, agricultural practices already carried out in karst areas should apply soil conservation principles and prioritize mixed cropping patterns with tree species of non-timber forest products that have economic value. The ongoing forest rehabilitation implemented at the Bulusaraung FMU may foster land cover and increase biomass in the future. Apart from important research findings that we gained, future researches are needed using other model approaches with different parameters other than the CA-Markove Module and weighted each parameter in the study, hence it might reveal more interesting findings.
5. Conclusions
The secondary forests of the Maros-Pangkep karst ecosystem play a significant role as carbon sinks because they contain high biomass, carbon storage, and carbon sequestration. The study identified the karst plain contained 166.20 ton ha−1 of biomass, 78.11 ton ha−1 carbon stock, and 286.41 C ton ha−1 carbon sequestration, respectively. Meanwhile, tower karst contains 160.65 ton ha−1 biomass, 75.51 ton ha−1 carbon stock, and 276.85 ton ha−1 carbon sequestration. Unfortunately, the role of the secondary forest of the Maros-Pangkep karst hills as carbon storage is facing threats due to a tendency toward deforestation accompanied by an increase in mining and agricultural land. Forest encroachment and illegal limestone mining in karst area occurred intensively, which led to deforestation. The research findings suggest to control the opening of mining areas according to sustainable environmental principles, to encourage the implementation of post-mining land rehabilitation and to implement soil conservation rules by prioritizing agroforestry farming patterns and fostering forest rehabilitation.
6. Acknowledgement
The authors acknowledge the Asian Forest Cooperation Organization (AFoCO), the Center for Sustainable Forest Management Standardization Instruments, Ministry of Environment and Forestry of Republic of Indonesia, and Korea Forest Service (KFS) of Republic of Korea for development assistant and financial support of the research under a project collaboration “Innovative solutions for climate change and biodiversity landscape strategy to support SDGs in Indonesia” (project code: AFoCO/023/2021). We thank the Forest Management Unit of Bulusarung, South Sulawesi Provincial Forestry Service for their kind support in the implementation of project activities.
References
- Achmad, A., & Hamzah, S. (2016). Data base karst Sulawesi Selatan. Badan Lingkungan Hidup Daerah Sulawesi Selatan.
- Ait El Haj, F., Ouadif, L., & Akhssas, A. (2023). Simulating and predicting future land-use/land cover trends using CA- Markov and LCM models. Case Studies in Chemical and Environmental Engineering, 7, 100342. doi: 10.1016/j.cscee.2023.100342.
- Aneesha Satya, B., Shashi, M., & Deva, P. (2020). Future land use land cover scenario simulation using open source GIS for the city of Warangal, Telangana, India. Applied Geomatics, 12(3), 281–290. doi: 10.1007/s12518-020-00298-4.
- Badan Standardisasi Nasional. (2019). Pengukuran dan penghitungan cadangan karbon–Pengukuran lapangan untuk penaksiran cadangan karbon hutan (ground based forest carbon accounting). Badan Standarisasi Indonesia. SNI, 7724, 2011.
- Breg Valjavec, M., Zorn, M., & Čarni, A. (2018). Human‐induced land degradation and biodiversity of Classical Karst landscape: On the example of enclosed karst depressions (dolines). Land Degradation & Development, 29(10), 3823–3835. doi: 10.1002/ldr.3116.
- Brown, S. (1997). Estimating biomass and biomass change of tropical forests: a primer (Vol. 134). Food & Agriculture Org.
- Budiyanto, E., Purnomo, N. H., Muzayanah, A. K., Prasetyo, K., & Maginta, N. S. D. The Study of Karst Desertification Maros Pangkep Based on Landsat 8 OLI Imagery. GeoEco, 8(1), 77–86. doi: 10.20961/ge.v8i1.51425.
- Cahyadi, A. (2010). Pengelolaan kawasan karst dan peranannya dalam siklus karbon di Indonesia. Makalah dalam Seminar Nasional Perubahan Iklim di Indonesia,
- Cao, J., Hu, B., Groves, C., Huang, F., Yang, H., & Zhang, C. (2016). Karst dynamic system and the carbon cycle. Zeitschrift für Geomorphologie, Supplementary Issues, 35–55. doi: 10.1127/zfg_suppl/2016/00304.
- Cao, X., Wu, Q., Wang, W., & Wu, P. (2023). Carbon dioxide partial pressure and its diffusion flux in karst surface aquatic ecosystems: a review. Acta Geochimica. doi: 10.1007/s11631-023-00625-7.
- Chave, J., Andalo, C., Brown, S., Cairns, M. A., Chambers, J. Q., Eamus, D., Fölster, H., Fromard, F., Higuchi, N., & Kira, T. (2005). Tree allometry and improved estimation of carbon stocks and balance in tropical forests. Oecologia, 145(1), 87–99. doi: 10.1007/s00442-005-0100-x.
- Danardono Haryono, E., & Widyastuti, M. (2019). Potential of Carbon Stocks and Its Economic Values in Tropical Karst Landscape (Case Study in Biduk-Biduk Karst, East Kalimantan, Indonesia). Journal of Physics: Conference Series, doi: 10.1088/1742-6596/1373/1/012030.
- Drew, D. (2017). Karst hydrogeology and human activities: impacts, consequences and implications: IAH international contributions to hydrogeology 20. Routledge.
- Fachrul, M. F. (2012). Metode sampling bioekologi. Bumi Aksara.
- Falkowski, P., Scholes, R. J., Boyle, E., Canadell, J., Canfield, D., Elser, J., Gruber, N., Hibbard, K., Högberg, P., Linder, S., Mackenzie, F. T., Moore Iii, B., Pedersen, T., Rosenthal, Y., Seitzinger, S., Smetacek, V., & Steffen, W. (2000). The Global Carbon Cycle: A Test of Our Knowledge of Earth as a System. Science, 290(5490), 291–296. doi: 10.1126/science.290.5490.291.
- Fatinaware, A., Fauzi, A., & Hadi, S. (2019). Kebijakan Pengelolaan Ruang dan Keberlanjutan Kawasan Karst Maros Pangkep Provinsi Sulawesi Selatan. Journal of Agriculture, Resource and Environmental Economics, 2(1), 26–37.
- Gbedzi, D. D., Ofosu, E. A., Mortey, E. M., Obiri-Yeboah, A., Nyantakyi, E. K., Siabi, E. K., Abdallah, F., Domfeh, M. K., & Amankwah-Minkah, A. (2022). Impact of mining on land use land cover change and water quality in the Asutifi North District of Ghana, West Africa. Environmental Challenges, 6, 100441. doi: 10.1016/j.envc.2022.100441.
- Ghale, B., Mitra, E., Sodhi, H. S., Verma, A. K., & Kumar, S. (2022). Carbon Sequestration Potential of Agroforestry Systems and Its Potential in Climate Change Mitigation. Water, Air, & Soil Pollution, 233(7), 228. doi: 10.1007/s11270-022-05689-4.
- Gilbertson, J. K., Kemp, J., & van Niekerk, A. (2017). Effect of pan-sharpening multi-temporal Landsat 8 imagery for crop type differentiation using different classification techniques. Computers and Electronics in Agriculture, 134, 151–159. doi: 10.1016/j.compag.2016.12.006.
- Hadi, S. J., Shafri, H. Z. M., & Mahir, M. D. (2014). Modelling LULC for the period 2010-2030 using GIS and Remote sensing: a case study of Tikrit, Iraq. IOP Conference Series: Earth and Environmental Science, 20(1), 012053. doi: 10.1088/1755-1315/20/1/012053.
- Hand, C. (2005). Simple cellular automata on a spreadsheet. Comput. High. Educ. Econ. Rev, 17.
- Haryono, E. (2011). Atmospheric Carbon Dioxide Sequestration Trough Karst Denudation Processes Estimated From Indonesian Karst Region. Asian Trans-Disciplinary Karst Conference.
- He, G., Zhao, X., & Yu, M. (2021). Exploring the multiple disturbances of karst landscape in Guilin World Heritage Site, China. CATENA, 203, 105349. doi: 10.1016/j.catena.2021.105349.
- Huang, Z.-S., Yu, L.-F., Fu, Y.-H., & Yang, R. (2015). Characteristics of carbon sequestration during natural restoration of Maolan karst forest ecosystems. Chinese Journal of Plant Ecology, 39(6), 554.
- International Geoscience and Geoparks Programme. (2023). Maros-Pangkep UNESCO Global Geopark. https://www.unesco.org/en/iggp/geoparks/maros-pangkep.
- Jackson, R. B., Jobbágy, E. G., Avissar, R., Roy, S. B., Barrett, D. J., Cook, C. W., Farley, K. A., le Maitre, D. C., McCarl, B. A., & Murray, B. C. (2005). Trading Water for Carbon with Biological Carbon Sequestration. Science, 310(5756), 1944–1947. doi: 10.1126/science.1119282.
- Jelev, G., Stefanova, D., & Stefanov, P. (2021). Land cover and land use change in karst region Devetashko plateau. Aerosp Res Bulgaria, 33, 51–78. doi: 10.3897/arb.v33.e05.
- Jensen, J. R. (2015). Introductory Digital Image Processing: A Remote Sensing Perspective. Pearson Education.
- Jiang, Z., Lian, Y., & Qin, X. (2014). Rocky desertification in Southwest China: Impacts, causes, and restoration. Earth-Science Reviews, 132, 1–12. doi: 10.1016/j.earscirev.2014.01.005.
- Kang, Z., Chen, J., Yuan, D., He, S., Li, Y., Chang, Y., Deng, Y., Chen, Y., Liu, Y., Jiang, G., Wang, X., & Zhang, Q. (2020). Promotion function of forest vegetation on the water & carbon coupling cycle in karst critical zone: Insights from karst groundwater systems in south China. Journal of Hydrology, 590, 125246. doi: 10.1016/j.jhydrol.2020.125246.
- Kang, Z. Q., & He, S. Y. (2013). The Soil and Vegetation Effect on Carbon Transfer Path in Epigenic Karst System. Advanced Materials Research, 726-731, 3732–3736. doi: 10.4028/www.scientific.net/AMR.726-731.3732.
- Lezhava, Z., Tsikarishvili, K., Asanidze, L., Chikhradze, N., Avkopashvili, G., & Tolordava, T. (2020). Impact of Anthropogenic Factor on Karst Landscape (Zemo Imereti Structural Plateau Case Study), Georgia, Caucasus. Open Journal of Geology, 10(7), 771–783. doi: 10.4236/ojg.2020.107035.
- Li, C., Wang, J., Liu, X., & Xu, K. (2024). Construction of Karst Landscape Ecological Security Pattern Based on Conflict between Human and Nature in Puzhehei. Sustainability, 16(2), 908. doi: 10.3390/su16020908.
- Li, F., Altermatt, F., Yang, J., An, S., Li, A., & Zhang, X. (2020). Human activities’ fingerprint on multitrophic biodiversity and ecosystem functions across a major river catchment in China. Global Change Biology, 26(12), 6867–6879. doi: 10.1111/gcb.15357.
- Li, Y. (2012). Soil improvement and its methods. Plant. Environ, 11, 240. doi: 10.1016/j.catena.2021.105349.
- Lillesand, T., Kiefer, R. W., & Chipman, J. (2015). Remote sensing and image interpretation (7th ed.). John Wiley & Sons.
- Liu, C., Liu, Y., Guo, K., Wang, S., Liu, H., Zhao, H., Qiao, X., Hou, D., & Li, S. (2016). Aboveground carbon stock, allocation and sequestration potential during vegetation recovery in the karst region of southwestern China: A case study at a watershed scale. Agriculture, Ecosystems & Environment, 235, 91–100. doi: 10.1016/j.agee.2016.10.003.
- Liu, L., Zeng, F., Song, T., Wang, K., & Du, H. (2020). Stand structure and abiotic factors modulate karst forest biomass in Southwest China. Forests, 11(4), 443. doi: 10.3390/f11040443.
- Luo, W., Jiang, Z., & Qin, X. (2005). Discussion on Landscape Ecological Land Consolidation Model in Longhe Village, Pingguo County, Guangxi. Guangxi Norm. Univ. Chin. J. Nat. Sci, 25, 98–102. doi: 10.1016/j.catena.2021.105349.
- Mannan, A., Liu, J., Zhongke, F., Khan, T. U., Saeed, S., Mukete, B., ChaoYong, S., Yongxiang, F., Ahmad, A., Amir, M., Ahmad, S., & Shah, S. (2019). Application of land-use/land cover changes in monitoring and projecting forest biomass carbon loss in Pakistan. Global Ecology and Conservation, 17, e00535. doi: 10.1016/j.gecco.2019.e00535.
- Martin, J. B. (2017). Carbonate minerals in the global carbon cycle. Chemical Geology, 449, 58–72. doi: 10.1016/j.chemgeo.2016.11.029.
- Mutiara, N., Damarraya, A., & Ratnasari, M. (2018). Rekalkulasi Penutupan Lahan Indonesia Tahun 2016. Jakarta: Kementerian Lingkungan Hidup dan Kehutanan
- Ni, J., Luo, D., Xia, J., Zhang, Z., & Hu, G. (2015). Vegetation in karst terrain of southwestern China allocates more biomass to roots. Solid Earth, 6(3), 799–810. doi: 10.5194/se-6-799-2015.
- Obiahu, O. H., Yan, Z., & Uchenna, U. B. (2021). Spatiotemporal analysis of land use land cover changes and built-up expansion projection in predominantly dystric nitosol of Ebonyi state, Southeastern, Nigeria. Environmental Challenges, 4, 100145. doi: 10.1016/j.envc.2021.100145.
- Parise, M., & Gunn, J. (2007). Natural and anthropogenic hazards in karst areas: an introduction. Geological Society, London, Special Publications, 279(1), 1–3. doi: 10.1144/SP279.1.
- Peng, J., Jiang, H., Liu, Q., Green, S. M., Quine, T. A., Liu, H., Qiu, S., Liu, Y., & Meersmans, J. (2021). Human activity vs. climate change: Distinguishing dominant drivers on LAI dynamics in karst region of southwest China. Science of The Total Environment, 769, 144297. doi: 10.1016/j.scitotenv.2020.144297.
- Putri, I. A., Broto, B. W., & Ansari, F. (2017). Bird responses to habitat change in the karst area of Bantimurung Bulusaraung National Park. Jurnal Penelitian Kehutanan Wallacea, 6(2), 101–112. doi: 10.18330/jwallacea.2017.vol6iss2pp101-112.
- Rahayu, Y. (2012). Rekalkulasi Penutupan Lahan Indonesia Tahun 2011. Jakarta: Kementerian dan Kehutanan
- Ran, C., Bai, X., Tan, Q., Luo, G., Cao, Y., Wu, L., Chen, F., Li, C., Luo, X., Liu, M., & Zhang, S. (2023). Threat of soil formation rate to health of karst ecosystem. Science of The Total Environment, 887, 163911. doi: 10.1016/j.scitotenv.2023.163911.
- Ratnasari, M., & Tosiani, A. (2022). Rekalkulasi Penutupan Lahan Indonesia Tahun 2021. Jakarta: Kementerian Lingkungan Hidup dan Kehutanan
- Richards, A. J., & Jia, X. (2006). Remote sensing digital image analysis: an introduction (4th ed.). Springer, Verlag.
- Rijal, S., Barkey, R. A., Nasri N, & Nursaputra, M. (2019). Profile, level of vulnerability and spatial pattern of deforestation in Sulawesi period of 1990 to 2018. Forests, 10(2), 191. doi: 10.3390/f10020191.
- Samodra, H. (2003). Nilai Strategis Kawasan Kars di Indonesia dan Usaha Pengelolaannya secara Berkelanjutan. Suplemen Tulisan pada Pelatihan Dasar Geologi untuk Pecinta Alam dan Pendaki Gunung, IAGI.
- Sari, S., Setiahadi, R., Wardhani, R., Sanyoto, R., & Anom, P. (2021). Strategy mitigation action of climate change of land-based in geopark karst area of Gunungsewu, Yogyakarta, Indonesia. IOP Conference Series: Earth and Environmental Science, doi: 10.1088/1755-1315/824/1/012071.
- Setya, R., & Wiryani, E. Jumari. (2019). Dinamika Tutupan Lahan di Kawasan Karst Kecamatan Gunem Kabupaten Rembang. Jurnal Ilmu Lingkungan, 17(2), 264–271. doi: 10.14710/jil.17.2.264-271.
- Song, X., Gao, Y., Wen, X., Guo, D., Yu, G., He, N., & Zhang, J. (2017). Carbon sequestration potential and its eco-service function in the karst area, China. Journal of Geographical Sciences, 27(8), 967–980. doi: 10.1007/s11442-017-1415-3.
- Srijono, H. D. (2008). Geowisata kawasan karst Maros, Sulawesi Selatan. Prosiding Seminar Indonesian Scientific Karst Forum I,
- Syano, N. M., Nyangito, M. M., Kironchi, G., & Wasonga, O. V. (2023). Agroforestry practices impacts on soil properties in the drylands of Eastern Kenya. Trees, Forests and People, 14, 100437. doi: 10.1016/j.tfp.2023.100437.
- Tong, X., Brandt, M., Yue, Y., Horion, S., Wang, K., Keersmaecker, W. D., Tian, F., Schurgers, G., Xiao, X., Luo, Y., Chen, C., Myneni, R., Shi, Z., Chen, H., & Fensholt, R. (2018). Increased vegetation growth and carbon stock in China karst via ecological engineering. Nature Sustainability, 1(1), 44–50. doi: 10.1038/s41893-017-0004-x.
- Wang, M., Chen, H., Zhang, W., & Wang, K. (2021). Soil organic carbon stock and its changes in a typical karst area from 1983 to 2015. Journal of Soils and Sediments, 21(1), 42–51. doi: 10.1007/s11368-020-02745-6.
- Wu, Y., & Wu, Y. (2022). The Increase in the Karstification–Photosynthesis Coupled Carbon Sink and Its Implication for Carbon Neutrality. Agronomy, 12(9), 2147. https://www.mdpi.com/2073-4395/12/9/2147 doi: 10.3390/agronomy12092147.
- Xiao, H., & Weng, Q. (2007). The impact of land use and land cover changes on land surface temperature in a karst area of China. Journal of Environmental Management, 85(1), 245–257. doi: 10.1016/j.jenvman.2006.07.016.
- Yang, R., Chen, B., Liu, H., Liu, Z., & Yan, H. (2015). Carbon sequestration and decreased CO2 emission caused by terrestrial aquatic photosynthesis: Insights from diel hydrochemical variations in an epikarst spring and two spring-fed ponds in different seasons. Applied Geochemistry, 63, 248–260. doi: 10.1016/j.apgeochem.2015.09.009.
- Yang, W., Min, Z., Yang, M., & Yan, J. (2022). Exploration of the Implementation of Carbon Neutralization in the Field of Natural Resources under the Background of Sustainable Development–An Overview. International Journal of Environmental Research and Public Health, 19(21), 14109. https://www.mdpi.com/1660-4601/19/21/14109 doi: 10.3390/ijerph192114109.
- Yulistyarini, T., Fiqa, A. P., & Laksono, R. A. (2016). Conservation area at Cirebon Quarry (Mt. Blindis) ands it’s potency in carbon sequestration. Jurnal Biologi Indonesia, 12(1), 49–55.
- Yurike, Y., Yonariza, Y., & Febriamansyah, R. (2021). Patterns of Forest Encroachment Behavior Based on Characteristics of Immigrants and Local Communities. International Journal of Engineering, Science and Information Technology, 1(4), 84–89. doi: 10.52088/ijesty.v1i4.175.
- Yusran, A. (2017). Karst Menara, Harta Unik Taman Nasional Bantimurung Bulusaraung. liputan6.com. http://regional.liputan6.com/read/2852210/karst-menara-harta-unik-taman-nasional-bantimurung.
- Zhang, C. (2011). Carbonate rock dissolution rates in different landuses and their carbon sink effect. Chinese Science Bulletin, 56(35), 3759–3765. doi: 10.1007/s11434-011-4404-4.
- Zhang, L., Wang, Y., Chen, J., Feng, L., Li, F., & Yu, L. (2022). Characteristics and Drivers of Soil Organic Carbon Saturation Deficit in Karst Forests of China. Diversity, 14(2), 62. https://www.mdpi.com/1424-2818/14/2/62 doi: 10.3390/d14020062.
- Zhang, M., Yang, W., Yang, M., & Yan, J. (2022). Guizhou Karst Carbon Sink and Sustainability–An Overview. Sustainability, 14(18), 11518. https://www.mdpi.com/2071-1050/14/18/11518 doi: 10.3390/su141811518.
- Zhang, Z., Huang, X., & Zhou, Y. (2020). Spatial heterogeneity of soil organic carbon in a karst region under different land use patterns. Ecosphere, 11(3), e03077. doi: 10.1002/ecs2.3077.
- Zhang, Z., Zhou, Y., Wang, S., & Huang, X. (2019). The soil organic carbon stock and its influencing factors in a mountainous karst basin in P. R. China. Carbonates and Evaporites, 34(3), 1031–1043. doi: 10.1007/s13146-018-0432-3.
- Zhao, S., Pereira, P., Wu, X., Zhou, J., Cao, J., & Zhang, W. (2020). Global karst vegetation regime and its response to climate change and human activities. Ecological Indicators, 113, 106208. doi: 10.1016/j.ecolind.2020.106208.
Appendix 1.
Two types of karst at the Maros
Figure appendix 1. Two types of karst at the Maros – Pangkep area. a. Plain karst; b. Tower karst.