
ABSTRACT
Malignant pleural effusion (MPE) is a functional ‘cold’ tumor microenvironment in which the antitumor activity of CD8+ T cells and natural killer T (NKT)-like cells is suppressed and the function of regulatory T (Treg) cells is enhanced. Using flow cytometry and immunofluorescence staining, we detected a distinct subset of NKT-like cells expressing FOXP3 in MPE. Through single-cell RNA sequencing (scRNA-seq) analysis, we found that the glycolysis pathway and pyruvate metabolism were highly activated in FOXP3+ NKT-like cells. Similar to Treg cells, FOXP3+ NKT-like cells highly expressed monocarboxylate transporter 1 (MCT1) and lactate dehydrogenase B to uptake and utilize lactate, thereby maintaining their immunosuppressive function and hyperlactylation in MPE. Furthermore, we found that MCT1 small molecule inhibitor 7ACC2 significantly reduced FOXP3 expression and histone lactylation levels in NKT-like cells in vitro. In conclusion, we reveal for the first time the altered phenotypic and metabolic features of FOXP3+ NKT-like cells in human MPE.
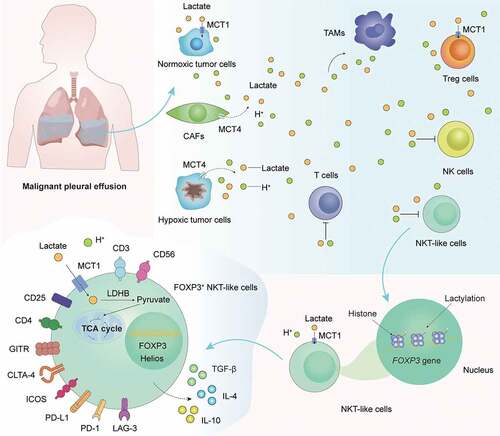
Graphical Abstract
Introduction
Malignant pleural effusion (MPE) is usually caused by the invasion of the pleura by malignant pleural mesothelioma, lung cancer, or other malignancies.Citation1 In non-small lung cancer (NSCLC), MPE is an independent prognostic marker, and patients with MPE have a median survival of fewer than 5 months.Citation2,Citation3 MPE is a unique liquid tumor microenvironment (TME) in which the antitumor activity of innate immune pathways such as natural killer (NK) cells and adaptive immune pathways such as CD8+ T cells is suppressed.Citation4 Elevated metabolites such as lactate and complicated cell components such as tumor cells, tumor-associated macrophages (TAMs), tumor-associated neutrophils (TANs), cancer-associated fibroblasts (CAFs), and regulatory T (Treg) cells work together to maintain the immunosuppression in MPE.Citation5–7
CD3+CD56+ natural killer T (NKT)-like cells express NK and T cell surface markers and act as a bridge between innate and adaptive immunity.Citation8 Recently, NKT-like cells have been reported to be a heterogeneous lymphocyte population including CD4+, CD8+, TCRγδ+, mucosal-associated invariant T (MAIT), and invariant NKT (iNKT) cells.Citation8 NKT-like cells are widely distributed in human tissues and organs, especially in normal liver tissue.Citation9 Furthermore, NKT-like cells are involved in various lung diseases, including respiratory infection, lung fibrosis, and lung cancer.Citation10–12 In the TME, the effector functions of NKT-like are significantly inhibited, and immune checkpoint inhibitor (ICI) therapy, such as PD-1 blockade, helps restore the antitumor activity of exhausted NKT-like cells.Citation9 Interestingly, tumor-infiltrating NKT-like cells have been reported to contain a distinct subpopulation expressing forkhead box P3 (FOXP3), a key transcription factor for Treg cells.Citation13 The proportion of FOXP3+ NKT-likes in hepatocellular carcinoma (HCC) tissue was significantly increased and negatively correlated with the prognosis of patients with HCC.Citation13 However, few studies have focused on the characteristics and roles of FOXP3+ NKT-likes in human MPE.
To study the phenotypic and metabolic features of FOXP3+ NKT-like cells in MPE patients, we collected pleural effusion mononuclear cells (PEMCs) from MPE patients and performed flow cytometry analysis and single-cell RNA sequencing (scRNA-seq) analysis. Compared with FOXP3− NKT-like cells, FOXP3+ NKT-like cells had increased immunosuppressive function and decreased antitumor function. We also found that the glycolysis pathway and pyruvate metabolism were highly activated in FOXP3+ NKT-like cells, and the expressions of monocarboxylate transporter 1 (MCT1, also termed solute carrier family 16 member 1, SLC16A1) and lactate dehydrogenase B (LDHB) were higher in FOXP3+ NKT-like cells. In addition, we found that MCT1 small molecule inhibitor 7ACC2 significantly reduced FOXP3 expression and histone lactylation levels in NKT-like cells in vitro. Our findings might advance the current understanding of FOXP3+ NKT-like cells in human MPE and provide new insights into the control of MPE from a metabolic perspective.
Materials and methods
Patients and clinical data collection
The collection of MPE, PEMCs, peripheral blood (PB), and peripheral blood mononuclear cells (PBMCs) samples was approved by the ethics committee of Union Hospital, Tongji Medical College, Huazhong University of Science and Technology (2019-S809). All patients gave informed consent. Patients who received any anti-cancer therapy, anti-tuberculosis therapy, corticosteroids, or other non-steroidal anti-inflammatory drugs were excluded. Clinical data of patients with MPE were obtained from the electronic medical records of Union Hospital, Tongji Medical College, Huazhong University of Science and Technology (Supplementary Table 1).
Isolation of human NKT-like cells
PEMCs from patients with MPE were isolated by Ficoll density gradient centrifugation according to our previous study.Citation14 PEMCs were cultured in RPMI-1640 medium (Hyclone, USA) supplemented with 10% fetal bovine serum (FBS) (GIBCO, USA) under different conditions, including control-Dimethyl sulfoxide (DMSO, Sigma-Aldrich), 10 mM lactate (L-lactate, Solarbio), 100 nM 7ACC2 (MedChemExpress), or 10 mM lactate plus 100 nM 7ACC2. Replace half of the supernatant with fresh medium on day 3. After 7 days, cultured human NKT-like cells were positively selected using flow cytometry sorting or CD3+CD56+ NKT Cell Isolation Kit human (Miltenyi Biotech) according to the product instructions. PEMCs were cultured in a humidified incubator at 37°C and 5% CO2.
Measurement of lactate concentration
L-lactate was measured in the supernatants from human MPE and PB using the L-lactate Concentration Assay Kit (Nanjing Jiancheng Institute of Biological Engineering) according to the product instructions. Briefly, the enzyme working solution and chromogenic agent were added to the incubation MPE or PB supernatant. After incubating in the 37°C water bath for 10 minutes, the Termination reagent was added to the supernatant. The absorbance of the sample was measured at the wavelength of 530 nm on a full-wavelength microplate reader (Thermo Fisher Scientific). The concentration of lactate in the MPE supernatant or PB supernatant was calculated based on the absorbance.
Immunofluorescence staining and confocal microscope
CD56+ cells were sorted from human MPE using EasySepTM Human CD56 Positive Selection Kit II (STEMCELLTM TECHNOLOGIES) and then stained for triple immunofluorescence, including 4′,6-diamidino-2-phenylindole (DAPI, nuclei, blue), CD56 (green), and FOXP3 (red). Primary antibodies for immunofluorescence staining were all diluted 100 times. More details about antibodies were shown in Supplementary Table 2. Finally, the immunofluorescence images were obtained under a confocal microscope (Olympus, BX53; Melville, NY, USA).
Western blotting
The protein was obtained from radioimmunoprecipitation assay (RIPA) lysate of sorted NKT-like cells containing phenylmethylsulfonyl fluoride (PMSF, Sigma-Aldrich, St. Louis, MO, USA) and protease inhibitor cocktail (Sigma-Aldrich). The protein concentration was determined by PierceTM BCA Protein Assay Kit (Thermo Fisher Scientific). 10–15% sodium dodecyl sulfate polyacrylamide gel electrophoresis (SDS-PAGE) was used to separate proteins, then transferred to the polyvinylidene difluoride (PVDF) membrane (Sigma-Aldrich), and finally exposed using ECL chemiluminescence detection kit (VazymeTM, Nanjing, China). The antibodies used were as follows: Lactyl-Histone H3 (Lys18) (H3K18la) rabbit antibody (PTM-1406RM; 1:1000 dilution), anti-Histone H3 rabbit mAb (PTM-6600; 1:1000 dilution), HRP-labeled goat anti-rabbit IgG (Thermo Fisher Scientific, 31460, 1:10000 dilution).
Flow cytometry and intracellular cytokine staining
Human samples were blocked with Human BD Fc Block™ (BD Biosciences) for 10 minutes at room temperature before staining. For surface markers, cells were stained with antibodies conjugated with phycoerythrin or fluorescein isothiocyanate for 30 minutes, then washed with staining buffer, and kept at 4°C away from light until analysis. For intracellular staining, cells were stimulated with 50 ng/mL PMA (Sigma-Aldrich, St. Louis, MO, USA) and 1 μM ionomycin (Sigma-Aldrich) in the presence of brefeldin A (1X; eBioscience) for 5 hours. After surface staining and permeabilization using Foxp3/Transcription Factor Staining Buffer Set (eBioscience), cells were stained with intracellular markers for 30 minutes. Died cells were excluded using Fixable Viability Stain 780 (BD Biosciences). A list of antibodies and tetramers used for flow cytometry was shown in Supplementary Table 2. All flow cytometry analyses were performed on BD LSRFORTESSA X-20 (BD Biosciences, USA) or ID7000™ Spectral Cell Analyzer (Sony Biotechnology, Japan). Fluorescence-activated single cell sorting (FACS) data were analyzed using FlowJo software (version 10.0.7, Becton Dickinson, USA).
Chromatin immunoprecipitation quantitative real-time PCR (ChIP-qPCR)
The ChIP-qPCR assay was performed using SimpleChIP® Enzymatic Chromatin IP Kit (CST, USA). Sorted NKT-like cells were cross-linked using 1% formaldehyde for 10 min at room temperature and treated with the micrococcal nuclease according to the manufacturer’s instructions. Lactyl-Histone H3 (Lys18) (H3K18la) rabbit antibody (PTM Biolabs; PTM-1406RM) or control IgG antibody was added to the chromatin samples. Three pairs of primers were designed according to the possible H3K18la sites in the promoter region of the FOXP3 gene (www.ncbi.nlm.nih.gov/gene/50943). Finally, qPCR was performed to analyze the enrichment differences between the H3K18la group and the IgG group. Primers for ChIP-qPCR were as fellow: −500bp – 0bp from Transcription start site (TSS) forward 5′- GCCAGCCGGGACACATCTC-3′ and reverse 5′- ATCTTCTCGACGGCTGGCA-3′; −1000bp – −500bp from TSS forward 5′- AACCTGCCCCACACCTTG-3′ and reverse 5′-GACACAGTCCCTGTCTGGT-3′; −1500bp – −1000bp from TSS forward 5′-GCCCAGCTCTGTCTCGATC-3′ and reverse 5′-GTAGGGGGAATCCTGCCAC-3′.
scRNA-seq data analysis
To identify the metabolic features of FOXP3+ NKT-like cells in the TME, we performed scRNA-seq analysis of NKT-like cells in human NSCLC (GSE99254) and human MPE (GSE185058) using Seurat (version 4.0).Citation15–17 Analysis of differentially expressed genes was performed by the differentialGeneTest function and the compareCluster function (fun = “enrichGO”) of Monocle 3 according to our previous study.Citation16 Metabolism pathway signature genes were downloaded from the Kyoto Encyclopedia of Genes and Genomes (KEGG).Citation18 Enriched metabolic pathways in FOXP3+ NKT-like cells were determined by Gene Set Variation Analysis (GSVA) score and metabolic score according to our previous study.Citation16,Citation19
Statistical analysis
Data were scored for normality by Shapiro-Wilk test and for homogeneity of variance by Levene’s test, then presented as the mean with SD. For parametric data, two-tailed Student’s t-test, one-way ANOVA with post hoc Tukey HSD test, or one-way ANOVA with post hoc Bonferroni was used. For non-parametric data, Mann-Whitney test, Kruskal-Wallis test with post hoc Dunnett’s test, or Kruskal-Wallis test with post hoc Dunn’s test was used. For paired data, Wilcoxon paired sign-rank test was used. Statistical significance was defined as p< .05. All statistical analyses were performed using GraphPad Prism version 9.1.1 software (GraphPad Software) and R version 4.2.1 (R project).
Results
Phenotypic characteristics of NKT-like cells in MPE
To evaluate the numerical changes of FOXP3+CD3+CD56+ NKT-like cells in MPE patients, the proportion of FOXP3+ NKT-like cells in MPE and corresponding PB from MPE patients was firstly assessed. We found that the proportion of FOXP3+ NKT-like cells was significantly higher in human MPE than in corresponding PB (). In addition, the presence of FOXP3+ NKT-like cells was detected using immunofluorescence staining and confocal microscopy (Supplementary Figure 1). Notably, the majority of FOXP3+ NKT-like cells were CD4 positive (), similar to CD4+CD25hiFOXP3+ Treg cells known for their potent immunomodulatory functions. To explore the association between FOXP3+ NKT-like cells and clinical indicators, detailed data such as tumor proportion in MPE, patient performance status (PS) score, and patient prognosis were collected after obtaining informed consent from all patients. Consistent with our expectations and previous studies,Citation13 higher proportions of FOXP3+ NKT-like cells in MPE were positively associated with higher tumor proportions (), higher PS score (), and worse prognosis (). To assess the functional features of FOXP3+ NKT-like cells, we performed multicolor flow cytometry analysis (). Compared with FOXP3− NKT-like cells, FOXP3+ NKT-like cells highly expressed inducible T-cell costimulator (ICOS), cytotoxic T-lymphocyte-associated protein 4 (CTLA-4), glucocorticoid-induced tumor necrosis factor receptor-related protein (GITR), T cell immunoreceptor with Ig and ITIM domains (TIGIT), programmed death 1 (PD-1), lymphocyte activating 3 (LAG-3), Helios, programmed cell death-Ligand 1 (PD-L1), interleukin 4 (IL-4), IL-10, and transforming growth factor-beta (TGF-β), indicating that the immunosuppressive function of FOXP3+ NKT-like cells was highly activated. In contrast, the expression of CD69, CD161, fas cell surface death receptor (Fas), tumor necrosis factor-alpha (TNF-α), interferon-gamma (IFN-γ), granzyme B (GZMB), and perforin was significantly higher in FOXP3− NKT-like cells, indicating that FOXP3− NKT-like cells had stronger antitumor activity. Taken together, these results suggest that FOXP3+ NKT-like cells in MPE have increased immunomodulatory function and decreased antitumor function.
Figure 1. Phenotypic characteristics of NKT-like cells in MPE. (a) FOXP3+CD3+CD56+ NKT-like cells from MPE and PB were identified using flow cytometry. (b) The proportion of FOXP3+ NKT-like cells in NKT-like cells in MPE was significantly higher than that in corresponding PB (n = 7). Wilcoxon paired sign-rank test. Data were shown as mean ± SD. (c) The proportion of FOXP3+ NKT-like cells in MPE in the high tumor proportion group (n = 10) was significantly higher than that in the low tumor proportion group (n = 13). Mann-Whitney test. Data were shown as mean ± SD. (d) The proportion of FOXP3+ NKT-like cells in MPE in the high PS score group (n = 13) was significantly higher than that in the low PS score group (n = 10). Mann-Whitney test. Data were shown as mean ± SD. (e) The prognosis of patients with a high proportion of FOXP3+ NKT-like cells in NKT-like cells (≥5%, n = 11) was poorer than that with a low proportion of FOXP3+ NKT-like in NKT-like cells (<5%, n = 12). Log-rank test. Data were shown as Kaplan-Meier curves. (f) Compared with FOXP3− NKT-like cells, FOXP3+ NKT-like cells expressed higher levels of ICOS, CTLA-4, GITR, TIGIT, PD-1, LAG-3, Helios, PD-L1, IL-4, IL-10, and TGF-β, and lower levels of CD69, CD161, Fas, TNF-α, IFN-γ, GZMB, and perforin. All experiments were repeated at least three times. Only representative FACS profiles were shown. * P < .05, ** P < .01, *** P < .001, **** P < .0001, ns, not significant.

Metabolic characteristics of NKT-like cells in MPE
To further evaluate the importance of tumor-infiltrating NKT-like cells, we next assessed the functional status of NKT-like cells in a scRNA-seq dataset (GSE99254) of T cells collected from human NSCLC tissue () and a scRNA-seq dataset (GSE185058) of PEMCs collected from human MPE (Supplementary Figure 2). Unbiased analysis of scRNA-seq data revealed two major clusters of tumor-infiltrating NKT-like cells, including cytotoxic NKT-like (NKT-like_cyto) cells and regulatory NKT-like (NKT-like_reg) cells (). NKT-like_reg cells identified as highly expressing CD3D, NCAM1 (CD56), FOXP3, CD4, IL2RA, CTLA4, ICOS, TIGIT, TNFRSF18 (GITR), HAVCR2 (TIM-3), and PDCD1 were consistent with FOXP3+ NKT-like cells (). In addition, NKT-like_cyto cells identified as highly expressing GNLY, CD8A, CD69, KLRB1 (CD161), and GZMB were consistent with FOXP3− NKT-like cells (). More details on differentially expressed genes between NKT-like_reg cells and NKT-like_cyto cells were shown in Supplementary Figure 3. Interestingly, analysis of differentially expressed genes revealed that the expression of SLC16A1 (also termed MCT1) was significantly higher in NKT-like_reg cells (Supplementary Figure 3). Furthermore, GSVA scores indicated that pyruvate metabolism and glycolysis pathway were highly activated in NKT-like_reg cells (). Taken together, these bioinformatics analyses strongly suggested a correlation between lactate metabolism and FOXP3+ NKT-like cells. With this doubt in mind, we measured the lactate concentration in the supernatant of MPE and corresponding PB and found that lactate levels in MPE were significantly higher than in PB (). Not only that, lactate levels were positively associated with the proportion of FOXP3+ NKT-like cells in MPE (). Next, we measured MCT1 expression in NKT-like cells in MPE and found that MCT1 expression was higher in FOXP3+ NKT-like cells (). Hypoxic cancer cells and CAFs have been reported to contribute to maintaining a high-lactate TME through MCT4-mediated lactate efflux.Citation5 Therefore, we also measured MCT4 expression in NKT-like cells in MPE (Supplementary Figure 4). However, there was no significant difference in MCT4 expression between FOXP3+ NKT-like cells and FOXP3− NKT-like cells (Supplementary Figure 4). As shown in the above results (), FOXP3+ NKT-like cells were similar to Treg cells. Previous studies have reported that metabolically reprogrammed Treg cells highly express LDHB to maintain their immunomodulatory functions in the high-lactate TME.Citation20,Citation21 Therefore, we also measured the expression of LDHB in NKT-like cells in MPE and found that FOXP3+ NKT-like cells expressed higher levels of LDHB (). These results indicate that FOXP3+ NKT-like cells in MPE have activated lactate metabolism.
Figure 2. Metabolic characteristics of NKT-like cells in MPE. (a) Schematic diagram and UMAP plot of single-cell transcriptomes of CD3+CD56+ NKT-like cells from NSCLC (GSE99254) and MPE (GSE185058). Unbiased analysis of scRNA-seq data revealed two major clusters of NKT-like cells, including cytotoxic NKT-like (NKT-like_cyto) cells and regulatory NKT-like (NKT-like_reg) cells. (b) UMAP plot showed the expressions and distributions of CD3D, NCAM1 (CD56), FOXP3, GNLY, CD4, CD8A, IL2RA, CD69, CTLA4, ICOS, TIGIT, TNFRSF18, KLRB1, GZMB, HAVCR2, and PDCD1 among NKT-like cells. (c) GSVA score showed that pyruvate metabolism and glycolysis pathway were highly activated in NKT-like_reg cells, while natural killer cell-mediated cytotoxicity pathway was highly activated in NKT-like_cyto cells. (d) The lactate levels in the MPE supernatant were significantly higher than those in the PB supernatant (n = 18). Mann-Whitney test. Data were represented as mean ± SD. (e) The lactate level was positively correlated with the proportion of FOXP3+ NKT-like cells in NKT-like cells in MPE. Spearman correlation analysis. (f, g) Representative FACS profiles and mean fluorescent intensity (MFI) analysis showed that FOXP3+ NKT-like cells highly expressed MCT1 and LDHB compared to FOXP3− NKT-like cells (n = 4). Mann-Whitney test. Data were represented as mean ± SD. * P < .05, ** P < .01, *** P < .001, **** P < .0001, ns, not significant.

Chronic high lactate increased FOXP3 expression in NKT-like cells in MPE
Recent studies reported that lactate increased FOXP3 expression in human PBMCs and mouse naïve T cells.Citation22,Citation23 Furthermore, tumor-infiltrating Treg cells in the hypoxic TME overexpressed MCT1 to uptake and utilize lactate, thereby maintaining their immunomodulatory functions.Citation21 High lactate then increased PD-1 expression in tumor-infiltrating Treg cells and attenuated the efficacy of PD-1 blockade therapy.Citation21 Notably, MCT1 inhibitors significantly reduced FOXP3 expression in PBMCs and restored the efficacy of PD-1 blockade therapy.Citation21,Citation22 Given the similarities between FOXP3+ NKT-like cells and Treg cells, it is reasonable to speculate that lactate metabolism also plays the same role in NKT-like cells. To explore the role of lactate metabolism in NKT-like cells, we isolated PEMCs from human MPE using Ficoll density gradient centrifugation (). PEMCs were cultured in RPMI-1640 medium supplemented with 10% FBS under different conditions, including DMSO, 10 mM lactate, 100 nM 7ACC2, or 10 mM lactate plus 100 nM 7ACC2 (). Cultured PEMCs were collected and analyzed by flow cytometry on day 0 and day 7, respectively (). The proportion of NKT-like in the CD45+ immune cells did not change significantly (). Consistent with our hypothesis, chronic high lactate significantly increased FOXP3 expression in NKT-like cells, whereas 7ACC2 had the opposite effect (). As shown in the above results (), FOXP3+ NKT-like cells also overexpressed LDHB. Therefore, we also explored the role of lactate dehydrogenase (LDH) inhibitors in NKT-like cells (Supplementary Figure 5). Although LDH inhibitors also inhibited FOXP3 expression in NKT-like cells, their inhibitory effect was lower than that of 7ACC2 and was easily reversed by chronic high lactate (Supplementary Figure 5). Since accumulating studies have shown that histone lactylation (H3K18la) is an important and widespread epigenetic modification,Citation24 we speculate that H3K18la may be partially involved in the induction of FOXP3 expression in NKT-like cells. PEMCs were isolated from human MPE and cultured under different conditions. On day 7, cultured NKT-like cells were collected by flow cytometry sorting or magnetic bead sorting. Using western blot, we found that chronic high lactate increased H3K18la levels in NKT-like cells, whereas 7ACC2 decreased H3K18la levels in NKT-like cells (). Furthermore, ChIP-qPCR revealed the presence of lactylation sites in the promoter region of the FOXP3 gene in NKT-like cells ). Taken together, these results suggest that lactate metabolism plays an important role in the induction of FOXP3 expression in NKT-like cells.
Figure 3. Lactate induced FOXP3 expression in NKT-like cells in MPE. (a) Schematic diagram of PEMCs isolation and culture. PEMCs were isolated from human MPE and cultured under four conditions, control (DMSO), lactate (10 mM), MCT1 inhibitor 7ACC2 (100 nM), and lactate (10 mM) plus 7ACC2 (100 nM). (b) Cultured PEMCs were collected and analyzed by flow cytometry on day 0 and day 7, respectively. (c) Representative FACS profiles of FOXP3 expression in NKT-like cells. (d) Lactate significantly increased FOXP3 expression in NKT-like cells, whereas 7ACC2 had the opposite effect (n = 3 per group). Kruskal-Wallis test with post hoc Dunn’s test. (e) Representative western blots of H3K18la and H3 for sorted NKT-like cells. (f) Schematic diagram of ChIP-qPCR analysis for probable H3K18la sites in the promoter region of the FOXP3 gene in NKT-like cells. (g) ChIP-qPCR analysis showed that there were H3K18la sites at the −500 to 0 bp and −1500 to −1000 bp from the transcription start site (TSS) of the FOXP3 gene in NKT-like cells (n = 3). Mann-Whitney test. Data were represented as mean ± SD. * P < .05, ** P < .01, *** P < .001, **** P < .0001, ns, not significant.

Discussion
CD3+CD56+ NKT-like cells are identified as a heterogeneous lymphocyte subset, comprising CD4+ cells, CD8+ cells, TCRγδ+ cells, MAIT cells, and a few iNKT cells.Citation8 A previous study revealed a distinct subpopulation of NKT-like cells expressing FOXP3 in human HCC tissue.Citation13 The proportion of FOXP3+ NKT-like was significantly increased in HCC tissue and was negatively correlated with the prognosis of HCC patients.Citation13 Another recent study reported a decrease in antitumor cytokines such as TNF-α and IFN-γ and an increase in exhaustion markers such as PD-1 and TIM-3 in circulating NKT-like cells from HCC patients.Citation9 However, studies evaluating NKT-like cells, especially FOXP3+ NKT-like cells, in patients with MPE are quite limited.
Our study demonstrated for the first time the phenotypic characteristics of FOXP3+ NKT-like cells in human MPE. FOXP3+ NKT-like cells in MPE were identified with high expression of CD4, CD25, ICOS, CTLA-4, GITR, TIGIT, PD-1, TIM-3, LAG-3, PD-L1, IL-4, IL-10, and TGF-β and low expression of CD8, CD69, CD161, Fas, TNF-α, IFN-γ, GZMB, and perforin. Higher proportions of FOXP3+ NKT-like cells were positively associated with higher tumor proportions, higher PS scores, and worse prognosis of MPE patients. Our study also demonstrated for the first time the metabolic features of FOXP3+ NKT-like cells through scRNA-seq analysis. Notably, lactate metabolism was highly activated in FOXP3+ NKT-like cells compared to FOXP3− NKT-like cells. Furthermore, we found that lactate levels were higher in MPE than in PB, and lactate levels were positively associated with the proportion of FOXP3+ NKT-like cells in MPE. Compared with FOXP3− NKT-like cells, FOXP3+ NKT-like cells highly expressed MCT1 and LDHB, enabling them to take in and utilize lactate in MPE.
Since accumulating studies showed that lactate induced FOXP3 expression in both human PBMCs and mouse naïve T cells,Citation22,Citation23 we reasoned that lactate might play the same role in NKT-like cells. We isolated PEMCs from human MPE and cultured them under different conditions. Interestingly, we found that chronic high lactate significantly increased FOXP3 expression in NKT-like cells without altering the proportion of NKT-like cells in CD45+ cells. Considering an increasing number of studies showing that lactate also regulates immune responses through epigenetic mechanisms such as histone lactylation, we speculate that lactylation may be partially involved in the induction of FOXP3 expression in NKT-like cells. We sorted NKT-like cells from cultured PEMCs and performed western blotting analysis. We then found that chronic high lactate significantly increased H3K18la levels in NKT-like cells. Notably, the MCT1 inhibitor 7ACC2 had opposite effects on the induction of FOXP3 expression and H3K18la levels in NKT-like cells compared to lactate. Next, we performed ChIP-qPCR analysis and detected the presence of lactylation sites in the promoter region of the FOXP3 gene in NKT-like cells. Overall, these results suggest that chemical and genetic perturbations of lactate metabolism remodel the epigenome and transcriptome of NKT-like cells toward a Treg-like state in a high-lactate MPE environment.
However, there are still some limitations in our study. Considering the difficulty of isolating FOXP3+ NKT-like cells, we performed all experiments using total NKT-like cells. To focus on the distinct functions of FOXP3+ NKT-like cells, further studies are needed to explore a novel protocol of high-purity FOXP3+ NKT-like cell isolation. Considering that scRNA-seq analysis of NKT-like cells in MPE is not identical to that in NSCLC, deeper scRNA-seq and more comprehensive analysis are needed to explore the features of FOXP3+ NKT-like cells in MPE. Furthermore, more detailed experiments are needed to explore the interaction of FOXP3+ NKT-like cells with other cells in vitro and in vivo.
In conclusion, our study demonstrates for the first time the unique characteristics of FOXP3+ NKT-like cells in human MPE. These findings provide metabolic insights for NKT-like cell-based therapy to control MPE progression.
Author contributions
Concept and design: ZQ, WZH, PWB; experiments: WZH, ZP; data collection: WSX, ZSY, XX, NYR, XQQ, WHL; data analysis and interpretation: WZH, PWB; manuscript writing: WZH, ZQ. All authors approve publishing the final manuscript.
Ethics statement
The trial was conducted in accordance with the Declaration of Helsinki (as revised in 2013). This study was approved by the ethics committee of Union Hospital, Tongji Medical College, Huazhong University of Science and Technology (2019-S809). Informed consent was given by all patients.
Supplemental Material
Download MS Word (11.1 MB)Acknowledgments
We would like to thank Prof. Weng, Xiu-Fang and Dr. Cheng, Xue for the experimental instructions.
Disclosure statement
We declare no competing interests.
Data availability statement
The single-cell RNA sequencing data are available in Gene Expression Omnibus database (GSE99254 and GSE185058).
Supplementary material
Supplemental data for this article can be accessed online at https://doi.org/10.1080/2162402X.2022.2160558
Additional information
Funding
References
- Feller-Kopman D, Light R, Ingelfinger JR. Pleural Disease. N Engl J Med. 2018;378(8):740–8. doi:10.1056/NEJMra1403503.
- Morgensztern D, Waqar S, Subramanian J, Trinkaus K, Govindan R. Prognostic impact of malignant pleural effusion at presentation in patients with metastatic non-small-cell lung cancer. J Thorac Oncol. 2012;7:1485–1489.
- Zamboni MM, da Silva CT Jr., Baretta R, Cunha ET, Cardoso GP. Important prognostic factors for survival in patients with malignant pleural effusion. BMC Pulm Med. 2015;15:29.
- Murthy P, Ekeke CN, Russell KL, Butler SC, Wang Y, Luketich JD, Soloff AC, Dhupar R, Lotze MT. Making cold malignant pleural effusions hot: driving novel immunotherapies. Oncoimmunology. 2019;8(4):e1554969. doi:10.1080/2162402X.2018.1554969.
- Wang ZH, Peng WB, Zhang P, Yang XP, Zhou Q. Lactate in the tumour microenvironment: from immune modulation to therapy. EBioMedicine. 2021;73:103627. doi:10.1016/j.ebiom.2021.103627.
- Xiang X, Niu YR, Wang ZH, Ye LL, Peng WB, Zhou Q. Cancer-associated fibroblasts: vital suppressors of the immune response in the tumor microenvironment. Cytokine Growth Factor Rev. 2022;67:35–48. doi:10.1016/j.cytogfr.2022.07.006.
- Niu Y, Zhou Q. Th17 cells and their related cytokines: vital players in progression of malignant pleural effusion. Cell Mol Life Sci. 2022;79(4):194. doi:10.1007/s00018-022-04227-z.
- Romero-Olmedo AJ, Schulz AR, Huber M, Brehm CU, Chang H-D, Chiarolla CM, Bopp T, Skevaki C, Berberich‐Siebelt F, Radbruch A, et al. Deep phenotypical characterization of human CD3+CD56+ T cells by mass cytometry. Eur J Immunol. 2021;51(3):672–681. doi:10.1002/eji.202048941.
- Tao L, Wang S, Kang G, Jiang S, Yin W, Zong L, Li J, Wang X. PD-1 blockade improves the anti-tumor potency of exhausted CD3+CD56+NKT-like cells in patients with primary hepatocellular carcinoma. Oncoimmunology. 2021;10(1):2002068. doi:10.1080/2162402X.2021.2002068.
- Koay HF, Gherardin NA, Nguyen THO, Zhang W, Habel JR, Seneviratna R, James F, Holmes NE, Smibert OC, Gordon CL, et al. Are NKT cells a useful predictor of COVID-19 severity? Immunity. 2022;55(2):185–187. doi:10.1016/j.immuni.2022.01.005.
- Jandl K, Marsh LM, Mutgan AC, Crnkovic S, Valzano F, Zabini D, Hoffmann J, Foris V, Gschwandtner E, Klepetko W, et al. Impairment of the NKT-STAT1-CXCL9 axis contributes to vessel fibrosis in pulmonary hypertension caused by lung fibrosis. Am J Respir Crit Care Med. 2022;206(8):981–998. doi:10.1164/rccm.202201-0142OC.
- Al Omar SY, Marshall E, Middleton D, Christmas SE. Increased numbers but functional defects of CD56+CD3+ cells in lung cancer. Int Immunol. 2012;24(7):409–415. doi:10.1093/intimm/dxr122.
- Li X, Peng J, Pang Y, Yu S, Yu X, Chen P, Wang W, Han W, Zhang J, Yin Y, et al. Identification of a FOXP3(+)CD3(+)CD56(+) population with immunosuppressive function in cancer tissues of human hepatocellular carcinoma. Sci Rep. 2015;5:14757. doi:10.1038/srep14757.
- Wei XS, Pei XB, Liu YL, Wu XZ, Shi HZ, Zhou Q. IL-17A-Producing γδT cells inhibit the formation of malignant pleural effusions. Am J Respir Cell Mol Biol. 2019;61(2):174–184. doi:10.1165/rcmb.2018-0201OC.
- Guo X, Zhang Y, Zheng L, Zheng C, Song J, Zhang Q, Kang B, Liu Z, Jin L, Xing R, et al. Global characterization of T cells in non-small-cell lung cancer by single-cell sequencing. Nat Med. 2018;24(7):978–985. doi:10.1038/s41591-018-0045-3.
- Huang ZY, Shao MM, Zhang JC, Yi F-S, Du J, Zhou Q, Wu F-Y, Li S, Li W, Huang X-Z, et al. Single-cell analysis of diverse immune phenotypes in malignant pleural effusion. Nat Commun. 2021;12(1):6690. doi:10.1038/s41467-021-27026-9.
- Hao Y, Hao S, Andersen-Nissen E, Mauck WM, Zheng S, Butler A, Lee MJ, Wilk AJ, Darby C, Zager M, et al. Integrated analysis of multimodal single-cell data. Cell. 2021;184(13):3573–3587.e3529. doi:10.1016/j.cell.2021.04.048.
- Kanehisa M, Furumichi M, Tanabe M, Sato Y, Morishima K. KEGG: new perspectives on genomes, pathways, diseases and drugs. Nucleic Acids Res. 2017;45(D1):D353–d361. doi:10.1093/nar/gkw1092.
- Hänzelmann S, Castelo R, Guinney J. GSVA: gene set variation analysis for microarray and RNA-seq data. BMC Bioinform. 2013;14:7. doi:10.1186/1471-2105-14-7.
- Angelin A, Gil-de-gómez L, Dahiya S, Jiao, J., Guo, L., Levine, M. H., Beier, U. H. Foxp3 Reprograms T Cell Metabolism to Function in Low-Glucose, High-Lactate Environments. Cell Metab. 2017;25(6):1282–1293.e1287. doi:10.1016/j.cmet.2016.12.018.
- Kumagai S, Koyama S, Itahashi K, Tanegashima T, Lin Y-T, Togashi Y, Kamada T, Irie T, Okumura G, Kono H, et al. Lactic acid promotes PD-1 expression in regulatory T cells in highly glycolytic tumor microenvironments. Cancer Cell. 2022;40(2):201–218.e209. doi:10.1016/j.ccell.2022.01.001.
- Comito G, Iscaro A, Bacci M, Morandi A, Ippolito L, Parri M, Montagnani I, Raspollini MR, Serni S, Simeoni L, et al. Lactate modulates CD4(+) T-cell polarization and induces an immunosuppressive environment, which sustains prostate carcinoma progression via TLR8/miR21 axis. Oncogene. 2019;38(19):3681–3695. doi:10.1038/s41388-019-0688-7.
- Gu J, Zhou J, Chen Q, Xu X, Gao J, Li X, Shao Q, Zhou B, Zhou H, Wei S, et al. Tumor metabolite lactate promotes tumorigenesis by modulating MOESIN lactylation and enhancing TGF-β signaling in regulatory T cells. Cell Rep. 2022;39(12):110986. doi:10.1016/j.celrep.2022.110986.
- Zhang D, Tang Z, Huang H, Zhou G, Cui C, Weng Y, Liu W, Kim S, Lee S, Perez-Neut M, et al. Metabolic regulation of gene expression by histone lactylation. Nature. 2019;574(7779):575–580. doi:10.1038/s41586-019-1678-1.