
Abstract
Determination of fluorescence or photo- and electro-luminescence quantum yield (QY) is of increasing importance for standardization of novel light-emitting materials like semiconductor quantum dots. The most straightforward spectroscopic QY measurement technique is based on the exploitation of an integrating sphere (IS). We propose a compact set-up and procedure for reliable measurements of QY over a broad excitation spectral range which uses excitation by light-emitting diodes. Starting from the general IS theory we show that (i) a variable excitation pattern has no fatal influence on the QY determination and (ii) a simple two-configuration experiment is an adequate basis of the correct experimental procedure. Then we give guidelines for the QY experiment and calculations as well as a few practical examples and error analysis. Our comprehensive description of absolute luminescence QY techniques based on the IS theory has a general applicability not restricted to the apparatus described in this paper.
1. Introduction
The quantum yield (QY) of luminescence (or fluorescence/phosphorescence) is defined as the ratio of number of emitted photons and number of absorbed photons during the excitation of a sample under investigation. Alternative term “luminescence quantum efficiency” should be – according to the recommendation by International Union of Pure and Applied Chemistry (IUPAC) [Citation1] – reserved to the fraction of molecules in a particular excited state that emit luminescence.
In any case, the knowledge of luminescence QY is very useful for advanced characterization and application of luminescing materials (light-converting phosphors, fluorescence labels, etc.). For example, the knowledge of both the luminescence decay time τL and QY η enables to separate the radiative τr and non-radiative lifetimes of an excited state using the simple relation
(1)
This is a unique way to obtain these important parameters from relatively simple optical measurements.[Citation2] (Note, that in some cases, when properties of luminescing objects in an ensemble have broad distribution, Equation (1) cannot be applied as measurements of η and τL, could be dominated by different subsets of the ensemble.)
We will restrict our description to measurements of luminescence excited by light, i.e. photoluminescence (PL). In general, there are two approaches to determine PL QY [Citation3,Citation4]:
Comparative methods – based on comparison of PL measurements of an investigated sample and a luminescence standard under identical conditions. This technique is the most often used one (sometimes called the Parker–Rees method).
Absolute methods – directly measure a portion of absorbed photons emitted as luminescence (optical methods) or portion of photons lost by non-radiative recombinations (calorimetric methods: photoacoustic, thermal-lensing, etc.).
The approach discussed in this paper is an absolute optical technique based on exploitation of an integrating sphere (IS). Different ISs are applied in various radiometry set-ups with the aim to minimize problems related to angular dependence of reflection, emission and scattering. Several commercial instruments with an IS dedicated to PL QY measurements have been introduced recently, e.g. Quantaurus-QY by Hamamatsu or Quanta-Phi module for FluoroMax® by Horiba Scientific.[Citation5] These devices are reliable but quite expensive and their users often struggle with lack of detailed information on the QY determination procedure and the technique background. Fortunately, a series of valuable methodological papers by Resch-Genger et al. appeared recently.[Citation6,Citation7] However, these papers are oriented mostly to determination of fluorescence QY in solutions of organic dyes and do not cover fully the theoretical background of radiometry using IS.
The aim of the present paper is to provide a consistent theoretical background of the PL QY methodology for testing solid samples. This description should respond to many practical questions, like: How the position and size of a sample and the excitation spot size within an IS influence the methodology or what is the precision of determined PL QY values? We believe that our work can help readers to shorten their way to establish a correct method for determining PL QY of their (nano)materials.
Second aim of this paper is to extend the PL QY measurement to a broad spectral range. Most of the PL QY set-ups are limited to application of just one or a few excitation wavelengths using lasers or lamps attached to a monochromator. This is supposed to be sufficient because the so-called Kasha–Vavilov (KV) rule is often well fulfilled. The KV rule (which was formulated for organic fluorophores) says that both the luminescence spectral shape and its QY do not depend on the applied excitation wavelength.[Citation8] However, some advanced materials (e.g. semiconductor quantum dots showing efficient carrier multiplication [Citation9]) violate the KV rule and investigation of PL QY over extended excitation range is necessary.
When measuring QY over an extremely broad excitation range, the wide tuneability and perfect stability of an excitation source become fundamental. The only continuously emitting excitation sources which are widely available and provide enough radiation from the UV-C to the near infrared (NIR) region are xenon and halogen lamps (however, the Xe lamps have low emission in the red–NIR region while the halogen lamps have low UV emission). In the case of a pulsed excitation, optical parametric oscillators pumped by pulsed lasers and also some fibre lasers can be applied. Recently, new broad-range light sources based on the laser-induced plasma were introduced and might be relevant for broader application in PL QY measurements in future.[Citation10]
The development of light-emitting diodes (LEDs) during the last 50 years has led to a tremendous increase in their efficiency and decrease in the price per output power which enable the current “lighting revolution”.[Citation11] Especially the advent of GaN-based LEDs (in 1993) and application of hetero-junctions enormously increased the spectral range of commercially available high-brightness diodes from IR to the UV-C (down to 240 nm) spectral range. The spectroscopical use of LEDs is rapidly developing taking advantage from the high stability, small size, simple driving circuits, long lifetime, easy modulation, etc.
Based on our long-term experience, we designed a relatively simple and cheap luminescence spectrometer with IS and excitation by LEDs described in the next paragraph. Starting from the general IS theory, we find the correct procedure to determine PL QY. A practical application is demonstrated using model materials, namely semiconductor quantum dots. Finally, the error analysis gives a general approach to estimate uncertainty of obtained PL QY values.
2. Experimental equipment
The principal scheme of our PL QY set-up is shown in . The central component is an IS. Excitation sources – LEDs – are inserted in an adapter on one of the IS ports and driven by a stabilized power supply. A sample is mounted on an IS port – most often the one in front of the excitation port. Output signal is collected by a fibre bundle placed in the direction perpendicular to the excitation axis and it is shielded by baffles against the direct visibility of both the LED excitation source and the sample.Footnote1 The end of the fibre bundle (advantageously with the stripe-like shape, see the inset image on the left side of ) is coupled to the input slit of a spectrometer. This fibre-coupling system is convenient as the IS can be easily moved or rotated (if needed, e.g. for calibration measurements) without affecting the coupling efficiency and consequently the set-up response.
Figure 1. The principal scheme of the apparatus for measuring absolute PL QY using an IS and LEDs as excitation sources. The second power supply for LED is applied in order to enable emission stabilization of an LED before its application in experiments.
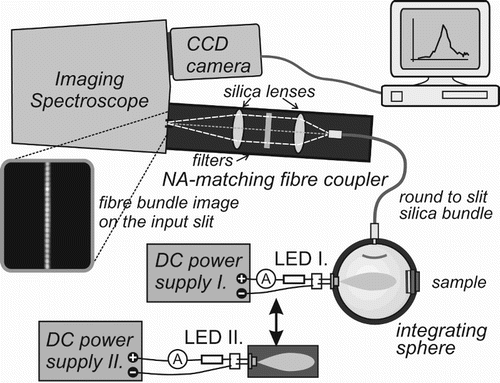
The spectroscopic detection part should be designed according to the required sensitivity, spectral range and resolution. Almost any standard spectrometer can be exploited, even the compact low-cost fixed-range spectrometers. For the present work we applied the 15-cm or 30-cm focal length imaging spectrographs and the liquid-nitrogen-cooled CCD camera for detection. Coupling of the fibre output into the spectrometer is done with a double lens coupler specially adapted for the numerical apertures of both the fibre waveguide and the spectrometer. For details on luminescence spectroscopy techniques see, e.g. the textbook by Pelant and Valenta.[Citation12] In the following sections we are going to describe only the two key parts of our set-up: LEDs and IS.
2.1. Excitation sources – LEDs
From the point of view of PL QY measurements, the following parameters of LEDs are the most important: an electro-luminescence (EL) emission band peak and width, radiation power and its temporal stability, and emission pattern. Spectral parameters (the position and width of an emission band) depend strongly on the internal semiconductor composition and band engineering (homo- or hetero-junctions, quantum wells, etc.), the full-width at half-maximum being usually between 20 and 40 nm.[Citation13] Therefore, the LEDs can be often used to excite PL in QY measurement directly, i.e. without passing any monochromator or filters, if the spectral resolution of 20–40 nm is acceptable. This significantly simplifies an experimental set-up and decreases its price. If needed, an LED can be combined with an appropriate band-pass filter to narrow the excitation band-width and/or limit the long-wavelength tail of EL.
When selecting appropriate LEDs using catalogue data (or data sheets) one has to keep in mind that the actual parameters of real devices (especially the peak wavelength and output power) can deviate significantly from the nominal values. Therefore, all diodes must be thoroughly tested (and selected) prior to their application in PL QY measurements.
An LED emission radiation pattern (an angle distribution of radiant flux) depends mainly on an LED package. In case of packages with a flat plane-parallel window (e.g. deep-UV diodes UV-TOP® produced by Sensor Electronics Technology, Inc.) the viewing angle is very wide, about 120°, and can be eventually reduced by a small lens or by a mirror concentrator. Most LED packages have the shape of a hemispherical lens which reduces the apex angle of an emission cone down to 10° or even below. Often, there is a significant variation of the area and shape of IS surface which is directly excited by different LEDs in the set covering a broad spectral range. As we want to keep the apparatus simple, without any complicated optical system at the excitation side, the PL QY experimental procedure must be designed insensitive to these variations of an LED emission pattern (see Section 3).
Note that the broad emission angle of most LEDs excludes a straightforward application of the PL QY measurement procedure proposed by de Mello et al. [Citation14] which requires a narrow excitation beam (laser) with its profile smaller than an investigated sample. This method is based on a comparison of the direct excitation with the indirect excitation by diffused light (with a sample shifted out of an excitation beam).
Finally, we have to discuss the light-emission stability of LEDs. This characteristic is of special importance as the PL QY technique is based on comparisons of several measurements which cannot be done simultaneously (at least not in the described simple set-up). We strongly recommend testing of stability of LEDs under the same conditions (e.g. applied voltage and current, the LED holder – influencing thermal exchange between an LED and its environment) as expected to be used during PL QY experiments. Obviously, a sophisticated power supply with a feedback could ensure more stable LED output (but such an option is not included in the simple set-up described here).
One has to take into account that the EL signal always contains shot noise which is described by the Poissonian distribution – it means that the standard deviation is a square root of the average signal counts N. Consequently, there would be no observable effect of EL temporal instability on the QY precision if the change of integrated EL signal during PL QY experiment was smaller than the shot noise. (In general, the acceptable LED emission intensity drift is about 1% in 1 h and the fast fluctuations should be below the shot noise.)
For many LEDs we found that the necessary stabilization takes about 10–15 min. Then the necessity to stabilize each diode after its mounting on the IS and switching on the power supply could cause a huge increase in experiment duration. Therefore, we adopted a simple solution: two independent power supplies are used in parallel, which allows stabilizing of one LED while the other one is used in experiments (see ).
2.2. Integrating sphere
An IS is a spherical cavity with highly reflective (diffusive) surfaces which enable a spatial integration of incoming light flux. It is widely applied in radiometry, photometry and other optical experiments.[Citation15]
Let us consider a perfect IS with the following parameters: the inner surface area Sis with reflectance is smaller than the complete sphere surface because part of it is occupied by ports and sample areas with reduced (or zero) reflectance ρ. Size of each one from n ports is characterized by the fill factor f – ratio of the port area to the area of IS
. An ideal IS distributes the input radiant flux
evenly over the whole inner surface and the output flux
through a port with area Sout is equal to [Citation16]
(2)
where ρ0 is reflectance of the first surface encountered by incoming radiation. The fraction on the right side of Equation (2) (which is equal to the ratio of output and input fluxes
is called the IS efficiency
. Then
is the sphere multiplier M
(3)
which characterizes how much the IS surface radiance increases compared with a single reflection. For most of ISs reflectance
and the full port fill fraction f are in the range of 0.94–0.99 and 0.02–0.05, respectively, and then the multiplier is between 10 and 50.[Citation17]
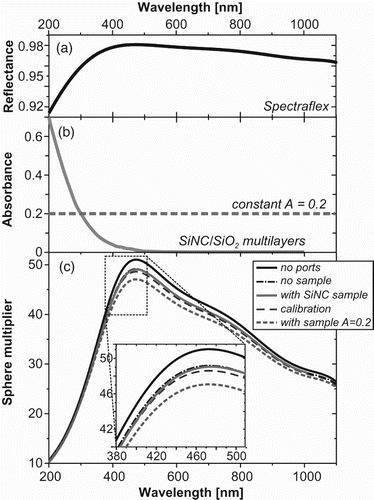
In (a), we present the reflectance spectrum of the Spectraflect material (based on barium sulphate) which forms a coating of our IS with diameter of 10 cm (purchased from SphereOptics GmbH, Germany). The theoretical sphere multiplier for such IS with different configurations of ports is calculated using Equation (3) and plotted in (c).
Figure 2. (a) Diffuse reflectance of the Spectraflect coating. (b) Absorbance of the Si/SiO2 nanocrystalline multilayer sample (solid line) and the hypothetical sample with flat absorbance of 0.2 (dashed line). (c) IS multipliers calculated using Equation (3) or (6) for the IS with 10-cm diameter covered by the Spectraflect coating and having: no ports (uppermost solid line), two ports (a LED input and a fibre output) but no sample (dotted-dashed black line), two ports with a sample (12×12 mm) of Si/SiO2 nanocrystalline multilayers (thin line) or a sample of the same size but A=0.2 (lower dashed line) and the calibration configuration (an open input port, a fibre output).
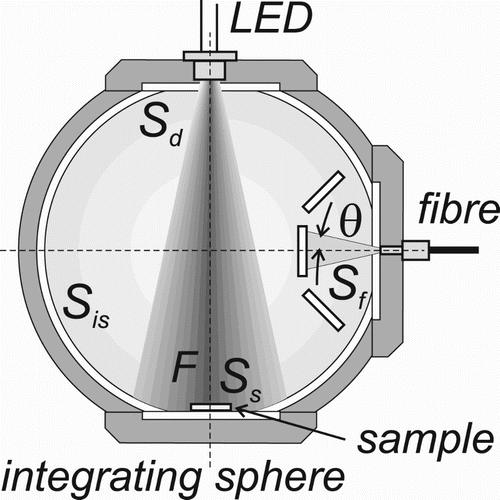
In the described set-up, an optical fibre bundle is applied to guide a portion of the signal from the IS to the spectral detection system ( and ). Only signal reflected from the baffle in front of the bundle and coming within the fibre acceptance cone (characterized by its numerical aperture ℕ) is coupled to the fibre bundle (). Then the output flux is given by
(4)
where Sf and ρf are the area and reflectance of the fibre bundle. Lis is the radiance of the IS surface equal to
(5)
In our experimental configuration () we have only two ports (tp) – the input (in) and the fibre output (f) ports with fill factors and reflectance of fin, ff and
, ρf, respectively. Then the sphere multiplier, M, takes the following form:
(6)
Note the same description is valid also for the imaging output coupling system which projects an output aperture (hole) onto an input slit of a spectrometer. In this case, the reflectance of the output port is close to zero
.
Figure 3. The basic parameters of the integrated sphere experiment with output signal coupled into a fibre bundle (for meaning of symbols, see Section 2.2).
2.3. Correction for the spectral response of an experimental apparatus
The calibration of the spectral response of an experimental system is necessary for any luminescence experiment involving a wide spectral range.[Citation10] In this paper we describe experiments dealing with extremely broad spectral range from 300 to 1000 nm, which includes even the edge regions where the sensitivity is rapidly decreasing. Therefore, the precise calibration of the spectral response is of special importance.
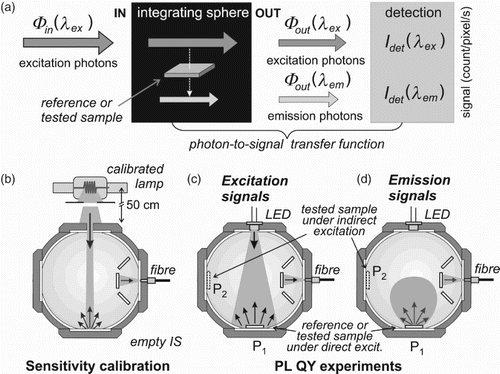
Two calibrated radiance standards were applied: the tungsten halogen filament lamp (Oriel Model No. 63355, calibrated between 250 and 2400 nm) and the deuterium lamp (Oriel Model No. 63945, calibrated between 200 and 400 nm). The lamps were placed at the distance of 50 cm from the entrance port of an IS ((b)) because the absolute calibration data are given for this distance. Consequently, we can perform the absolute calibration of a set-up in radiometric units (even if it is not necessary for the PL QY determination – for that knowledge of the correction function spectral shape in arbitrary units is enough as will be described below). By dividing the measured spectral signal (expressed in count/s/pixel) by the calibrated spectral irradiance of the standard ( in W/nm/m2) multiplied by the area of an entrance port (in m2) we obtain the sensitivity spectrum of the apparatus C(λ) in (count/s/pixel)/(W/nm). This sensitivity curve is then used to convert experimental spectra (count/s/pixel) into spectral radiance (W/nm). By integrating the area of spectral bands, total radiant power is obtained.
Figure 4. (a) Schematic representation of the PL QY measurement as a sort of “black-box” experiment, where part of the input signal (photon flux) is transformed to the longer-wavelength signal (PL) and then converted to detected signal counts. The lower panel illustrates the three experimental configurations to be used for the PL QY determination: (b) sensitivity calibration, (c) excitation/absorption and (d) emission (PL) signal acquisition. Note that only one (or none) sample is present inside IS during one experimental step – multiple samples in (c) and (d) just illustrate possible positions of a sample in or outside the direct excitation spot (P1 and P2, respectively).
The calibration procedure must be done separately for all configurations of the apparatus which will be used during PL QY experiments. For example, different slit width, diffraction gratings (mounted on a turret) or even detectors may be used in order to optimize sensitivity and/or the detected spectral range.
We have to note that for a correct calibration of boundary spectral regions, where the response of an apparatus rapidly drops down, special care must be given to effects like stray light of a spectrometer.[Citation18] Useful recommendations for characterization of a PL apparatus were recently published by Resch-Genger and DeRose.[Citation19]
3. Experimental configuration and procedure
In the following paragraph we describe the PL QY determination for a solid sample in the form of a flat plate (or, possibly, a small cuvette with a liquid sample). We suppose to have two samples: (1) reference sample (RS) represented by a substrate or matrix without a studied material and (2) tested sample (TS) formed by the same substrate (matrix) but containing a studied active material (dispersed in a matrix or deposited on a substrate).
The experiment consists of several pairs of measurements – one measurement covers the excitation range, i.e. the spectral range of an applied LED ((c)), and the second one covers the whole PL emission band of a TS ((d)). This pair of measurements is usually performed for three experimental configurations: the RS sample is placed in the incoming flux, the TS placed in the incoming flux and the TS located out of the direct illumination by an LED. We will see below that the last configuration is redundant.
(a) represents the PL QY measurements as a sort of a “black-box” experiment. When we insert a sample into an IS (black-box) part of the input, photon flux is converted into longer-wavelength (PL emissionFootnote2) photons. Our task is to determine efficiency of this conversion (QY). An experimental apparatus converts photon fluxes into digital signal (counts/detector pixel/s) with certain photon-to-signal transfer function which we call the spectral sensitivity C(λ).
The detected signal Idet is directly proportional to the IS output flux , where K is a constant (spectrally dependent) characterizing the detection system sensitivity (without IS). Using Equations (4)–(6) we obtain
(7)
The left fraction in Equation (7) was labelled k, which is the spectrally dependent constant for a given IS with a fibre coupler.
During the calibration measurement ((b)), the first encountered surface is an IS wall, and the reflectance of an input port is zero
. Consequently, the sphere multiplier for the calibration measurement is ((c))
(8)
The input flux
in Equation (7) has the form of spectral radiant flux
obtained by multiplying the spectral irradiance of a calibrated source
by the area of an input port Sin. By dividing Idet (λ) with
(λ) we obtain the sensitivity spectrum C(λ) (i.e.
), as was mentioned in the previous paragraph.
A sample introduced in the IS plays two roles:
(a) Semitransparent port – The sample with area Ss and absorbance As (fraction of incident light which is absorbed during single passage through a sample, i.e. the probability to absorb a passing photon) placed anywhere on an IS wall influences the sphere multiplier M approximately as a port with reflectance (1−As)Footnote3.
(b) Input filter – When the sample is placed on a IS wall illuminated directly by an LED, it reduces the first reflectance ρ0 from
to (
In order to provide a general description (in respect to a relation between the sample and the direct excitation spot sizes and shapes), we suppose that the IS surface area directly illuminated by an LED Sil is larger than the sample area Ss. Let the fraction of input flux passing through a sample be F=(0, 1⟩, where F=1 means that the whole flux passes through a sample. Now, we are going to calculate the absorbed power and the detected signal for three experimental configurations ((b–d)): (a) the RS under the direct excitation, (b) the TS under the direct excitation and (c) the TS under indirect excitation by diffused light.
In the first case (supposing that RS has no absorption in the investigated spectral range () and the possible specular reflections from sample facets have a negligible influence on the distribution of light inside a sphere) we obtain for the directly absorbed power
, the IS surface radiance
(directly proportional to the detected signal, see Equations (5) and (7)) and the multiplier MRS
(9a)
(9b)
(9c)
For the TS excited directly by the input flux we obtain
(10a)
(10b)
(10c)
We see that the relative difference between signals measured in the first and second configurations
(which is the same as
would be equal to the power of absorbed light FATS, if the multipliers MRS and MTS were equal (but this condition is not fulfilled as we will see below).
Finally, in the third configuration the RS is placed on an IS surface but out of the incoming LED radiation and receives only diffused radiant flux given by the radiance of an IS surface multiplied by the solid angle π and the sample surface STS.
(11a)
(11b)
(11c)
It is instructive to estimate the proportion of indirectly and directly absorbed power by comparing Equation (11a) with Equation (10a)
(12)
Let us take the following realistic parameters: the IS with an inner diameter of 100 mm and baffles with area of about 3000 mm2 (Sis=34, 400 mm2), sample 12×12 mm (
mm2), multiplier
and F=0.5, then the indirect/direct absorption ratio is 0.335. It means that indirectly absorbed power is about one-third of the directly absorbed power.
Evidently, the indirect excitation takes place also in the second experimental configuration with the TS under direct excitation. It is also described by Equations (11a)–(11c) but the flux must be reduced to
) due to the “filtering” of incoming radiation by the direct absorption in TS.
At first sight, it is not clear whether the indirect absorption has an adequate influence on the detected signal. Therefore, we have to show that the total () absorbance (see Equations (10a) and (11a))
(13)
is equal to the relative change of the detected signal
, which is the same as
. Using Equations (9b), (10b) and a simple relation between MRS and MTS, (
(derived from Equations (9c) and (10c)), we obtain
(14)
which is equal to Equation (13). By this we proved that both the direct and the indirect absorption in a TS have adequate influence on measured signals; the first one through “filtering” of the incoming radiant flux and the second one through changes of the IS multiplier.
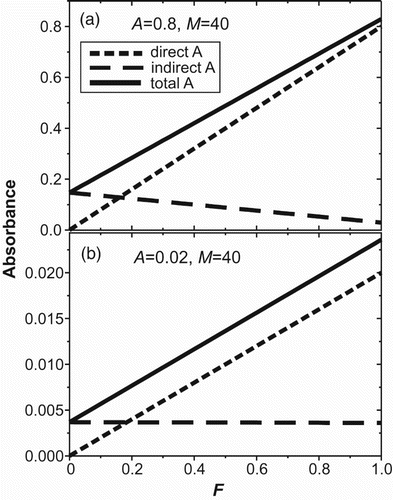
Let us briefly discuss the role of the factor F. In , we plot the direct and indirect absorbance as function of F for the case of highly absorbing ((a)) and weakly absorbing sample ((b)). The sample fill factor fTS and the sphere multiplier MTS were taken as 0.0046 and 40, respectively. Obviously, the total absorbance always decreases with reducing F (even if the indirect absorption increases for highly absorbing sample), which can significantly impair precision of the QY determination for samples with low absorbance. For such samples we recommend having the F fraction high (it means the excitation beam illuminating roughly the whole sample surface).
Figure 5. Relation (Equation (13)) between the direct (short-dashed line), indirect (dashed line) and total (solid line) absorbance as function of the direct flux fill factor F for the case of (a) highly absorbing (A=0.8) and (b) weakly absorbing (A=0.02) sample. The sample area fill factor fTS and the sphere multiplier MTS are 0.0046 and 40, respectively.
From the above discussion we conclude that the correct absorbed power can be obtained from the first two experiments, i.e. direct excitation of RS (or empty IS) and of TS. The difference of these excitation signals must be corrected by the sensitivity C (in order to avoid confusions, we shall use notation Cex and Cem for sensitivity in the excitation and emission bands, respectively, even if these are just different points of the whole sensitivity spectrum C(λ)) to give the correct spectral radiance
(15)
In the case of emission measurements, the PL radiation from a sample plays the role of an input flux, i.e. we have to replace ΦLED by either
or
and derive the relation for emitted spectral radiance (power) analogical to Equation (15). This is a straightforward task if the (re)absorption of PL within the RS and TS samples is supposed to be negligible
(16)
In principle, there should be no PL signal from the RS (before we supposed that its absorption is negligible) but there can be detectable Raman scattering (mostly from the sample matrix, especially for liquid samples). Most often also absorbance by a TS in the emission region is negligible – in this case
. However, if the sample shows significant overlap of absorption and luminescence spectra, the reabsorption of PL takes place and can affect the precision of a QY determination. A method for analysing the effects of self-absorption was proposed by Ahn et al.[Citation20]
The emitted power given by Equation (16) is, obviously, equal to the absorbed power (given by Equation (15)) multiplied by the PL power efficiency, which can be determined by dividing Equation (16) by Equation (15). The power efficiency is then converted to QY by dividing of both Equations (15) and (16) with the photon energy.
We have to remind that most of the quantities in Equations (15) and (16) are spectrally dependent and the emission and excitation measurements concern different spectral regions. Therefore, the overall PL QY must include integration over the whole excitation and emission spectral regions
(17)
In this equation for QY η, the nominator represents number of PL photons emitted by the TS, while denominator stands for the number of absorbed photons. The functions TExF and TEmF represent transmittance spectra of filters used during acquisition of excitation and emission signals (e.g. a long-pass filter cutting off excitation photons) and hc/λ is the energy of photon.
The calculation of integrals in Equation (17) can be considerably simplified (and easily automated) when all spectral data are represented at the same spectral points (detector pixels). Then the integral is replaced by a sum of the calculated values in all spectral points multiplied by the span between spectral points , i.e.
(18)
This equation represents the essence of our PL QY method, as it includes all necessary input signals, and indicates the most straightforward approach to PL QY experiments.
We used the following standard experiment procedure for obtaining PL QY:
(a) Determine the excitation and the emission range for investigated samples.
(b) Consider whether a RS is needed or an empty IS can be used.
(c) Decide the spectral measurement ranges and the use of filters.
(d) Stabilize the first excitation LED and start the stabilization of the second LED.
(e) Perform measurement in both excitation and emission region with the RS.
(f) Then the same for one or more investigated samples (if the duration of experiment is long then repeat from time to time the reference measurement – possibly after each TS – and briefly check that the LED signal is stable, if not stop the measurement for this LED and start again after sufficient LED stabilization).
(g) At the end measure the RS again.
(h) Change the stabilized LED and repeat steps e–g for all LEDs from the desired spectral region.
(i) Data treatment for each LED should start by comparing all reference measurements. If they indicate LED intensity variations higher than the desired precision, disregard these experiments done with the unstable LED.
(j) The corresponding data sets are subtracted, divided by the sensitivity spectrum C(λ), by transmittance T(λ) of used filters and by photon energy hc/λ. Then all data points within the excitation and the emission range are multiplied by the width of a spectral step
4. Experimental examples
The above described technique is an absolute method to determine PL QY which does not require comparison with fluorescence standards. However, it can be useful to test the prepared and calibrated set-up by measuring some fluorescence standards if available.[Citation21]
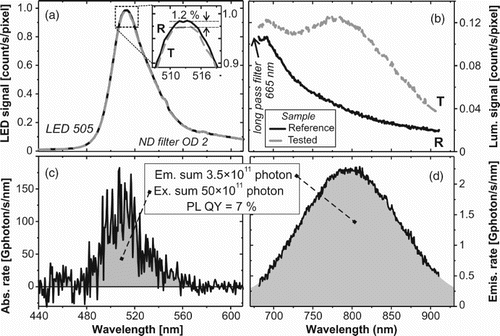
Here, we demonstrate () the method and ability of our set-up using a solid-state material having the form of a substrate with active material deposited on it. More specifically, we used multilayers of silicon nanocrystals in the SiO2 matrix deposited on a quartz substrate (12×12 mm).[Citation22] This specific sample can reveal the capability of our set-up because it has rather low absorption (increasing from red towards the UV spectral region, see (b)) and large (Stokes) shift between absorption (UV-blue) and emission (red and NIR) regions (). The excitation and emission bands are detected separately using one or two detection windows (if we want to fully characterize the very broad emission band) and adequate filters in the detection path. These filters are used either to stop excitation photons which otherwise appear at multiples of excitation wavelength in a grating spectrometer (this is performed by the adequate long-pass filters during an emission window acquisition) or attenuate the detected (non-absorbed) excitation signal (with neutral density filters during an excitation window acquisition) in order to avoid saturation of the detector range. Low absorbance of this type of thin-film samples is demonstrated in (a) as very small difference of excitation signals between reference and TS. Despite such low absorption the determination of PL QY is still possible if the excitation source (LED) was sufficiently stable and the direct excitation fill factor F was as high as possible. On the other hand, measurement of the emission spectral band is reliable as there is only weak background signal from the RS and the value of QY is relatively high, about 7% ((b)).
Figure 6. PL QY experiments on the sample of SiNC/SiO2 multilayers on a quartz substrate (its absorbance is given in (b)). The upper panels show experimental data for (a) the excitation region (using LED 505 with actual peak around 513 nm) and (b) the emission region. The black solid and grey dashed lines represent the signal from reference and TS, respectively. The inset in the panel (a) gives expanded view on the excitation peak area. The lower panels (c) and (d) show the corrected differences of spectra from panels (a) and (b), respectively. The ratio of integrated emission and excitation signals gives QY of about 7%.
5. Error analysis
In optical spectroscopy we deal with photon signals, i.e. detection events are discrete and therefore described by the Poisson probability function (see, e.g. [Citation23]). Then the standard deviation of a measurement with the mean count value of N is equal to √ N.
There are four photon signals in Equation (18) along with photon energy (hc/λ) and transmittance of filters T(λ) (which are considered to be precise, i.e. without uncertainty). The last component is the sensitivity spectrum C(λ) which has also limited precision (see discussion below).
In order to obtain a fast estimation of the PL QY uncertainty, we shall modify Equation (18) into the following form:
(19)
where all components, except the light signals, were extracted outside the sum and replaced by their mean value (over the range of emission or excitation band). We assume that this is very good approximation for narrow bands and acceptable estimate for broader bands. The first fraction in Equation (19) is then considered to be precise constant without uncertainty.
The second fraction in Equation (19) (labelled SR – sensitivity ratio), i.e. the mean sensitivity in the excitation band divided by its value for emission band, is also constant but known only with limited precision. This uncertainty does not have a character of a random error but an unknown systematic error. Note that any error in scaling of the sensitivity spectrum is not important as we have here a ratio of two points from this spectrum (in other words, we do not need the absolute calibration of an apparatus response, but the relative calibration – i.e. correcting for the spectral shape deformation – is enough). For PL QY measurements involving a limited spectral range (absorption and emission wavelengths being close together) within the region of optimal response of an apparatus, the uncertainty of the SR could be neglected. But in case of the very broad investigated spectral range, which includes regions of decreasing sensitivity, the uncertainty of sensitivity must be considered (see (b)). However, the reliable determination of the uncertainty of a sensitivity calibration is a complicated task which goes beyond the scope of this paper (and will be published separately).
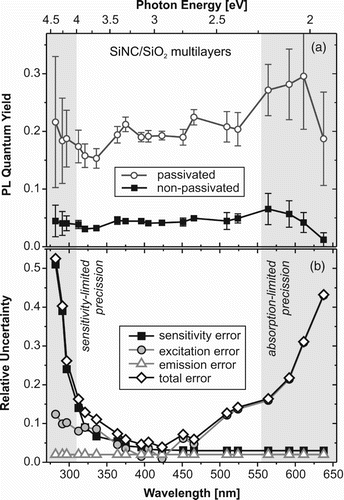
Figure 7. (a) PL QY excitation spectra for a pair of SiNC/SiO2 multilayer samples: the non-passivated sample (black rectangles) and the sample passivated by annealing in hydrogen (open circles). (b) Error analysis of the above PL QY experiments: the total uncertainty (open diamonds) is combined (Equations (20) and (21)) from the excitation (grey circles), emission (open triangles) and sensitivity (black squares) errors. The sensitivity error is dominant at the short-wavelength (UV) side, while the absorption error dominates the long-wavelength side (due to very low absorption of these wavelengths by the sample).
In the last term of Equation (19), we replaced the sum of measured intensity differences by differences of summed intensity. The intensity signals summed over the whole excitation and emission bands (N) are also described by the Poisson statistics, therefore the relative error of the nominator and denominator can be written as
(20)
Finally, an estimate of the overall relative uncertainty of PL QY is obtained from the rules for propagation of errors in multivariable functions as
(21)
where the result from Equation (20) must be inserted.
The above described error analysis is applied to a set of PL QY measurements (7) on a pair of samples of SiNC/SiO2 multilayers on the quartz substrate (similar to the sample represented in ); one of these samples is additionally passivated by hydrogen annealing which increases its PL QY. The absorption spectrum of both samples is almost identical and has the form of a smooth edge starting from the blue-green region and steadily increasing towards shorter wavelengths (similar to the spectrum shown in (b)). The estimated relative errors of the three components in Equation (21) are plotted in the lower panel ((b)). The lowest contribution comes from the emission signal, while the excitation and correction uncertainty dominates the long- and short-wavelength edge, respectively.
The main purpose of the above error analysis (simplified in some points) was to identify the dominant source of uncertainty and possibly take measures to reduce it. In the presented example, we could improve precision of PL QY determination by increasing absorbance of samples (making thicker active layers) and by improving sensitivity of the experimental apparatus in the UV spectral range.
6. Conclusions
We have described the apparatus and the experimental procedure for determination of absolute QYs of luminescence in a broad spectral range using excitation by LEDs (with excellent temporal stability of emission) and application of an IS. In contrast to commercial spectrometers oriented to the determination of PL QY in organic fluorophores, our set-up is designed for QY measurements of solid-state nanomaterials with relatively low absorption and/or PL QY.
The radiometry theory of ISs was exploited to propose the simplest possible methodology of PL QY determination which involves measurements in only two configurations: (i) a TS under the direct excitation by an LED and (ii) a RS (or none sample – an empty sphere) excited by an LED. Such a procedure is considerably simpler than that one commonly used to determine PL QY in cuvettes with fluorophores when a sample and reference are measured both under the direct and indirect excitation (shifted out of the exciting beam). Moreover, it is proved that a variable emission pattern of different LEDs has no fatal influence on the PL QY determination with an IS.
Then we formulated practical guidelines for the PL QY experiment and calculations as well as an example experiment on Si nanocrystalline layers. The error analysis of our method is provided identifying the dominant contribution either from the absorption signal or the sensitivity limits of the apparatus.
Finally, we have to stress that the presented comprehensive description of PL QY techniques based on the IS theory has quite general applicability not restricted to the described apparatus and easily adaptable to other experimental configurations.
Acknowledgements
The author thanks Prof. I. Pelant (Institute of Physics, Czech Academy of Sciences, Prague) for critical reading of the manuscript and Prof. M. Zacharias’ group from IMTEK, University of Freiburg, Germany, for providing excellent nanocrystalline silicon multilayer samples. He also expresses his appreciation to former and current students, A. Fucikova, A. Raichlova and M. Greben for using the PL QY set-up and so enabling to uncover some problems of the technique. The research leading to these results has received funding from the European Community's Seventh Framework Programme (FP7/2007−2013) under grant agreement no. 245977 (project NASCEnT).
Notes
1. The direct coupling of rays from either an excitation source or an emitting sample into an output channel without several reflections from IS walls must be avoided. Otherwise, the randomizing (integrating) role of an IS will be violated and strong signal artefacts generated. The narrow acceptance cone of an output channel itself can possibly avoid the direct signal coupling without using baffles.
2. Note, photons can be wavelength-shifted also by non-elastic scattering (mainly Raman scattering). We suppose that it can be either neglected or corrected by using the RS. Non-linear optical effects are excluded as very low excitation power densities are used.
3. In the case of a sample placed on an IS wall, incident photons passing through a sample are reflected back and pass for the second time (if not absorbed). Neglecting reflections on sample interfaces as well as losses during the back-reflection from an IS wall, the double passage is equivalent to the single passage through a sample with the double thickness. For convenience, the absorbance A used from now on will have meaning of the absorption probability during a double passage.
References
- Melhuish. Nomenclature, symbols, units and their usage in spectrochemical analysis: IV. Molecular luminescence spectroscopy. Pure Appl Chem. 1984;56:231–245. doi: 10.1351/pac198456020231
- Valenta J, Fucikova A, Vácha F, Adamec F, Humpolíčková J, Hof M, Pelant I, Kůsová K, Dohnalová K, Linnros J. Light-emission performance of silicon nanocrystals deduced from the single quantum dot spectroscopy. Adv Funct Mater. 2008;18:2666–2672. doi: 10.1002/adfm.200800397
- Demas JN, Crosby GA. The measurements of photoluminescence quantum yields. J Phys Chem. 1971;75:991–1024. doi: 10.1021/j100678a001
- Rurack K. Fluorescence quantum yields: methods of determination and standards standardization and quality assurance in fluorescence measurements I. Techniques. In: Resch-Genger U, editor. Springer Series on Fluorescence, vol. 5. Berlin, Heidelberg: Springer; 2008. p. 101–145.
- Würth C, Lochmann C, Spieles M, Pauli J, Hoffmann K, Schüttrigkeit T, Franzl T, Resch-Genger U. Evaluation of a commercial integrating sphere setup for the determination of absolute photoluminescence quantum yields of dilute dye solutions. Appl Spectrosc. 2010;8:733–741. doi: 10.1366/000370210791666390
- Resch-Genger U, Rurack K. Determination of the photoluminescence quantum yield of dillute dye solutions (IUPAC technical report). Pure Appl Chem. 2013;85:2005–2026.
- Würth C, Grabolle M, Pauli J, Spieles M, Resch-Genger U. Relative and absolute determination of fluorescence quantum yields of transparent samples. Nat Protoc. 2013;8:1535–1550. doi: 10.1038/nprot.2013.087
- Lakowicz JR. Principles of fluorescence spectroscopy. 3rd ed. New York: Springer Science + Bussiness Media LLC; 2006.
- Timmerman D, Valenta J, Dohnalová K, de Boer WDAM, Gregorkiewicz T. Step-like enhancement of luminescence quantum yield of silicon nanocrystals. Nat Nanotechnol. 2011;6:710–713. doi: 10.1038/nnano.2011.167
- Feng J, Nasiatka J, Wong J, Chen X, Hidalgo S, Vecchione T, Zhu H, Javier Palomares F, Padmore HA. A stigmatic ultraviolet-visible monochromator for use with a high brightness laser driven plasma light source. Rev Sci Instrum. 2013;84:085114. doi: 10.1063/1.4817587
- Pimputkar S, Speck JS, DenBaars SP, Nakamura S. Prospects for LED lighting. Nat Photon. 2010;3:180–182. doi: 10.1038/nphoton.2009.32
- Pelant I, Valenta J. Luminescence spectroscopy of semiconductors. Oxford: Oxford University Press; 2012.
- Schubert EF. Light-emitting diodes. 2nd ed. Cambridge: Cambridge University Press; 2006.
- de Mello JC, Wittmann HF, Friend RH. An improved experimental determination of external photoluminescence quantum efficiency. Adv Mater. 1997;9:230–232. doi: 10.1002/adma.19970090308
- McCluney WR. Introduction to radiometry and photometry. Boston, MA: Artech House; 1994.
- Goebel DG. Generalized integrating-sphere theory. Appl Opt. 1967;6:125–128. doi: 10.1364/AO.6.000125
- LabSphere Inc. Technical guide: integrating sphere theory and applications. LabSphere Inc. 2008. Available from: http://www.labsphere.com
- James JF. Spectrograph design findamentals. Cambridge: Cambridge University Press; 2007.
- Resch-Genger U, DeRose PC. Characterization of photoluminescence measuring systems (IUPAC technical reports). Pure Appl Chem. 2012;84:1815–1835. doi: 10.1351/PAC-REP-10-07-07
- Ahn TS, Al-Kaysi RO, Müller AM, Wentz KM, Bardeen CJ. Self-absorption correction for solid-state photoluminescence quantum yields obtained from integrating sphere measurements. Rev Sci Instrum. 2007;78:086105. doi: 10.1063/1.2768926
- Würth C, Grabolle M, Pauli J, Spieles M, Resch-Genger U. Comparison of methods and achievable uncertainties for the relative and absolute measurement of photoluminescnce quantum yields. Anal Chem. 2011;83:3431–3439. doi: 10.1021/ac2000303
- Hartel AM, Hiller D, Gutsch S, Löper P, Estradé S, Peiró F, Garrido B, Zacharias M. Formation of size-controlled silicon nanocrystals in plasma enhanced chemical vapor deposition grown SiOxNy/SiO2 superlattices. Thin Solid Films. 2011;520:121–127. doi: 10.1016/j.tsf.2011.06.084
- Hughes IG, Hase TPA. Measurements and their uncertainties: a practical guide to modern error analysis. Oxford: Oxford University Press; 2010.