
Abstract
Purpose
Evidence between air pollution and COPD admissions is inconsistent and limited in China. In this study, we aimed to explore the effects of air pollutants on COPD admissions in Beijing, China.
Patients and methods
Daily COPD hospital admission visits derived from tertiary and secondary hospitals in Beijing were retrieved from January 2013 to February 2017. Air pollutant levels and meteorological data over the same periods were also achieved. Generalized additive model was applied to estimate the percentage changes with 95% CIs in daily admissions corresponding to 10 µg/m3 increases in pollutants levels [1 mg/m3 in carbon monoxide (CO)], stratified by age, gender, and season.
Results
Seventy-three thousand seventy-six COPD hospital admission visits were included with mean daily visits of 48 (21). Cumulative lag effect with per 10 µg/m3 increase in air pollutant levels was largest for nitrogen dioxide (NO2) with 3.03% (95% CI: 1.82%–4.26%) at lag 06, for sulfur dioxide (SO2) with 2.07% (95% CI: 1.00%–3.15%) at lag 01, for particulate matter ≤10 µm in aerodynamic diameter (PM10) with 0.92% (95% CI: 0.55%–1.30%) at lag 07, and for particulate matter ≤2.5 µm in aerodynamic diameter (PM2.5) with 0.82% (95% CI: 0.38%–1.26%) at lag 06, respectively. Percentage increase for each 1 mg/m3 increase in CO was 5.99% (95% CI: 2.74%–9.34%) at lag 06. Further, stronger effects on COPD admissions were found in warm seasons than in cold seasons.
Conclusion
Short-term exposures to PM2.5, PM10, NO2, SO2, and CO had adverse effects on COPD hospitalizations in Beijing with different magnitudes and lag days.
Introduction
COPD is the third leading cause of death and attributable disability-adjusted life-years worldwide, especially in developing countries.Citation1 With the rapid increase in the aging population and cigarette smoking, COPD has imposed a heavy health and economic burden in China.Citation2 Estimated by a national cross-sectional study, the prevalence of spirometry-defined COPD was 8.6% among the Chinese population aged over 20 years, with 99.9 million COPD patients in 2015.Citation3 Emerging evidence suggests that exposure to ambient air pollution, and not just cigarette smoking, may have adverse effects on COPD, although there is no conclusive causal relationship.Citation4,Citation5 Previous epidemiological studies indicate that short-term exposures to air pollutants may induce increased risk of acute exacerbations, emergency department visits,Citation6,Citation7 hospital admissions,Citation8,Citation9 and even mortalityCitation10,Citation11 in COPD patients.
Nevertheless, most of the aforementioned investigations were performed in North America and Europe, where air pollutant levels are much lower than those in developing countries.Citation12,Citation13 In recent decades, with its rapid industrialization and urbanization, China has witnessed severely widespread haze, which is characteristic of the substantially higher fine particulate matter (PM2.5, particulate matter ≤2.5 µm in aerodynamic diameter) concentrations and has posed great hazards to and burdens on the public health and economy.Citation14 As one of the most densely populated urban cities, Beijing, which is located on the North China Plain, is under a burden of serious air pollution, with annual PM2.5 levels as high as 89.5 µg/m3 in 2013,Citation15 more than eight times the WHO standard (10 µg/m3).Citation16 Taking the different magnitudes and components of pollutants, meteorological conditions, and socioeconomic characteristics into consideration, the potential adverse effects of air pollution on COPD patients in China cannot be fully and accurately extrapolated from the effect estimates in Western countries.Citation17,Citation18
With the establishment of an advanced real-time air quality monitoring network, PM2.5 has been introduced into the national monitoring system in China since 2013. However, epidemiological evidence involving the latest and full-scale monitoring data has been scarce in China. Updated information on the effects of air pollution on COPD is pivotal for urging medical professionals, COPD patients, and policymakers to take effective actions to alleviate the adverse effects in China. Therefore, we assessed the effects of ambient air pollutants on hospital admission visits of COPD patients from January 2013 to February 2017 in Beijing, China.
Patients and methods
Hospital admissions data
In the study, daily COPD-associated hospital admission counts between January 1, 2013, and February 28, 2017, were collected from the tertiary hospitals and secondary hospitals located in Dongcheng District, Xicheng District, Chaoyang District, Haidian District, Fengtai District, and Shijingshan District, all located in urban districts of Beijing, China. Patients with Beijing medical insurance were included. Tertiary and secondary hospitals in the six districts amount to 162, accounting for 72% of tertiary and secondary hospitals in Beijing. The collected data included identified patient number, age, sex, home address, admission date, discharge date, and primary and secondary discharge diagnosis with the corresponding International Classification of Diseases (ICD-10) code. In this analysis, the following categories were all included as the COPD (ICD-10 codes J42 and J44) hospital admissions: 1) COPD or chronic bronchitis with acute exacerbation as the primary diagnosis; 2) COPD or chronic bronchitis without acute exacerbation as the primary diagnosis; 3) COPD or chronic bronchitis with acute exacerbation as the secondary diagnosis; and 4) COPD or chronic bronchitis as the secondary diagnosis, combined with upper airway tract infection, lower airway tract infection, respiratory failure, or pulmonary heart disease as the primary diagnosis. Patients aged <20 years or not living in Beijing were excluded. The confidential information of subject (such as name, ID number, and health care card number) were deleted. All hospital visits were deidentified in compliance with the Declaration of Helsinki. The Institutional Review Board of Peking Union Medical College Hospital approved the study (S-K492).
Air pollutants and meteorological data
Daily air pollutant levels in Beijing city over the same period were collected from the Beijing Municipal Environmental Protection Bureau (http://www.bjepb.gov.cn/). Daily concentrations of PM2.5, particulate matter ≤10 µm in aerodynamic diameter (PM10), nitrogen dioxide (NO2), sulfur dioxide (SO2), and carbon monoxide (CO) were calculated as the 24-hour mean concentrations from 12 state-owned air quality monitoring stations throughout Beijing. For the daily ozone (O3) level, the 8-hour mobile mean maximum (O3-8 h max) was calculated as the maximum average of hourly measurements over a continuous 8-hour period. To adjust for confounding factors, the daily mean temperature and relative humidity in Beijing were obtained from the China Meteorological Data Sharing Service System (http://data.cma.cn/).
Statistical analysis
Taken the Poisson distribution of daily hospital visits into consideration, generalized additive model (GAM) using quasi-Poisson method with log linkCitation19 was used as the core analysis to analyze the effects of different air pollutants on COPD hospital admissions. We incorporated smoothed spline functions of time and weather conditions and then introduced each pollutant variable. The penalized splines can capture the nonlinear relationship between daily hospital admissions and the time-varying covariates. The degrees of freedom (df) for the smoothing parameter were chosen by data-driven criterion generalized cross-validation (GCV). The models were adjusted for confounding variables such as seasonality, day of the week, daily mean temperature, and relative humidity. Single-day lag (from lag 0 to lag 7) and multiday lag (from lag 01 to lag 07) were both utilized to assess the effect estimates for each air pollutant. Lag 0 day corresponded to the current day pollution, and a lag of 7 days referred to the previous 7-day concentration. In multiday lag models, lag 07 corresponded to 8-day cumulative effects value of the current and previous 7 days moving average concentrations. In both the single-day (lag N, N=0, 1, …, 7) and multiday-lag (lag 0N) models, the lag for temperature and relative humidity was the moving average values from 0 day to N day. We also explored the analyses by sex, age (20–75 years and >75 years), and season (warm and cold). The warm season was defined as extending from April to October and the cold season was from November to March.
Results in this study are expressed as percent changes with 95% CIs for daily COPD hospitalization visits with a 10 µg/m3 increase in air pollutant concentrations (1 mg/m3 increase in CO). All analysis was conducted in R using “mgcv” package.
Results
A summary of demographic information on the total population is shown in . In this study, there were 73,076 COPD hospital admissions from January 1, 2013, to February 28, 2017. Patients over 75 years old accounted for 68.4% of the total population, and 58.6% of patients were male patients.
Table 1 Demographic characteristics of COPD hospital admissions from January 1, 2013, to February 28, 2017, in Beijing, China
outlines the scatter plots of the daily hospital admission visits and daily concentrations of PM2.5, PM10, NO2, SO2, CO, and O3-8 h max levels in Beijing over the 1,520 days. The daily admission peaks appeared in the winter season. Daily levels of PM2.5, PM10, NO2, SO2, and CO seemed to have the similar distribution trend, with maximal concentrations in winter, while O3 has the maximum in summer. further describes the data on air pollutants and meteorological conditions. The mean number of daily admissions was 48 (21). The mean daily concentrations of PM10, PM2.5, NO2, SO2, and O3-8 h max were 104.6 (75.9), 82.5 (69.9), 52.8 (24.8), 18.0 (20.6), and 93.2 (64.3) µg/m3, respectively. For CO, the mean daily level was 1.3 (1.0) mg/m3. As shown in , close positive correlations were found between PM2.5, PM10, NO2, and CO, especially for PM2.5 and PM10 (r=0.90, P<0.01). O3-8 h max was negatively associated with other pollutants (r=−0.10 to −0.42).
Table 2 Daily summary of the COPD hospital admissions, pollutant levels, and meteorological data from January 1, 2013, to February 28, 2017, in Beijing, China
Table 3 Spearman correlation coefficients between different air pollutants
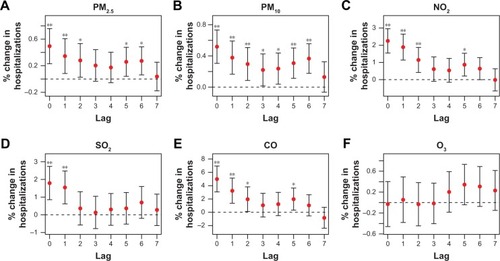
shows the percentage changes in admission visits by a single-day model. Significant effects on hospitalization were observed for SO2, NO2, CO, PM2.5, and PM10 but not for O3. Generally, gaseous pollutants (NO2 and SO2) were associated with higher risks of hospital admission than particulate pollutants (PM2.5 and PM10). In the single-day lag analysis, per 10 µg/m3 increments of the PM2.5, PM10, NO2, and SO2 levels corresponded to 0.49% (95% CI: 0.23%–0.76%, P<0.001), 0.52% (95% CI: 0.30%–0.73%, P<0.001), 2.25% (95% CI:1.55%–2.96%, P<0.001), and 1.79% (95% CI: 0.85%–2.74%, P<0.001) increases in COPD hospital visits at lag 0, respectively (). For the CO concentration, a rise of 1 mg/m3 increased the hospital visits by 4.99% (95% CI: 3.07%–6.95%, P<0.001) at lag 0 ().
Figure 1 Percentage changes with 95% CIs in COPD hospitalization visits with per 10 µg/m3 increase in PM2.5 (A), PM10 (B), NO2 (C), SO2 (D), CO (E), and O3 (F) levels by single-day lag model.
Abbreviations: CO, carbon monoxide; NO2, nitrogen dioxide; O3, ozone; PM2.5, particulate matter ≤2.5 µm in aerodynamic diameter; PM10, particulate matter ≤10 µm in aerodynamic diameter; SO2, sulfur dioxide.
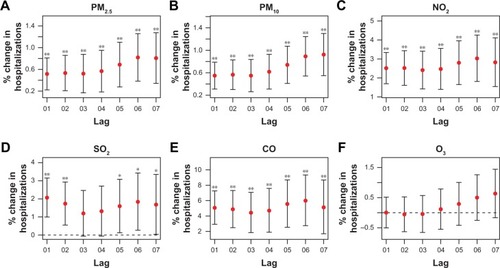
The cumulative lag effects of PM2.5, PM10, NO2, SO2, and CO were stronger in multiday models than in single-day lag models. PM2.5, PM10, NO2, and CO had maximum cumulative lag effects at lag 06, lag 07, lag 06, and lag 06, with a percent increase of 0.82% (95% CI: 0.38%–1.26%, P<0.001), 0.92% (95% CI: 0.55%–1.30%, P<0.001), 3.03% (95% CI: 1.82%–4.26%, P<0.001), and 5.99% (95% CI: 2.74%–9.34%, P<0.001), respectively (). In contrast, the largest cumulative effect [2.07% (95% CI: 1.00%–3.15%, P<0.001)] for SO2 was at lag 01, which was obviously shorter than other pollutants ().
Figure 2 Percentage changes with 95% CIs in COPD admission visits with per 10 µg/m3 increase in PM2.5 (A), PM10 (B), NO2 (C), SO2 (D), CO (E), and O3 (F) levels by multiday lag model.
Abbreviations: CO, carbon monoxide; NO2, nitrogen dioxide; O3, ozone; PM2.5, particulate matter ≤2.5 µm in aerodynamic diameter; PM10, particulate matter ≤10 µm in aerodynamic diameter; SO2, sulfur dioxide.
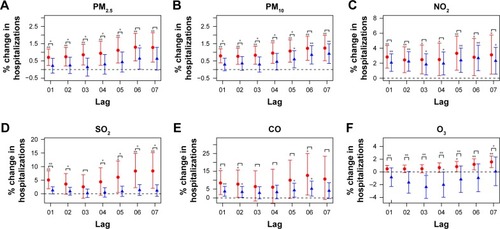
We further explored the subgroup analysis by age, sex, and season in the multiday lag model (, and ) and single-day lag model (see in the supplementary materials). Significant higher effects were found in the warm season compared with the cold season for PM2.5, PM10, SO2, and O3 (). Statistically significant differences were not found in the comparison for age and sex subgroup analyses ( and ). Patients aged over 75 years had slightly larger cumulative risks when exposed to PM2.5, PM10, NO2, SO2, and CO than the younger group. In terms of sex, males had slightly stronger effects than females for the increments of PM2.5, PM10, NO2, and CO ().
Figure 3 Percentages (%) with 95% CIs in multiday lag model for COPD hospital visits with per 10 µg/m3 increase in PM2.5 (A), PM10 (B), NO2 (C), SO2 (D), CO (E) and O3 (F) levels in the warm season (in red color) and cold season (in blue color).
Abbreviations: CO, carbon monoxide; NO2, nitrogen dioxide; O3, ozone; PM2.5, particulate matter ≤2.5 µm in aerodynamic diameter; PM10, particulate matter ≤10 µm in aerodynamic diameter; SO2, sulfur dioxide.
Discussion
Our study assessed the short-term effects of air pollutants on hospital admissions for COPD patients residing in Beijing, China, from January 1, 2013, to February 28, 2017. We found that increments of ambient PM2.5, PM10, NO2, SO2, and CO concentrations had adverse effects on hospitalization visits at different lag days and magnitudes, with larger risk effects in warm seasons. For PM2.5, PM10, NO2, and CO, the risks were slightly larger in males and the elderly. This study provides updated evidence to establish the associations between ambient air pollution and COPD in China.
In recent decades, air pollution has caused considerable public concern in China, especially in the North China Plain. As was shown in our results, PM2.5 and PM10 were the major pollutants from 2013 to 2017 in Beijing. Daily concentrations of PM2.5 (82.5 µg/m3) exceeded the Chinese ambient air quality standards (35 µg/m3) and were far higher than those reported in the USA and Europe.Citation20 On extreme days, the daily concentrations of PM2.5 and PM10 were observed to be as high as 480 and 506 µg/m3, respectively. The daily SO2, NO2, CO, and O3 levels in our study were comparable with data from less-polluted areas in China.Citation8,Citation21 However, only a few studies reported the effects of air pollution on COPD hospital admissions under present ambient environment, especially in high-polluted Beijing. Therefore, we aimed to update the associations by covering longer periods. GAM, which enabled adjustment for trends, seasonality, and weather variables, were most widely applied in time series analysis to explore the air pollution effects on admission and mortality counts.Citation22
Some previous studies only analyzed particulate matter or gaseous pollutants, due to the absence of full-scale and real-time air monitoring data in China.Citation21,Citation23 In this time series analysis, we analyzed six pollutants and extended the cumulative lag effects to 8 days. We found that the excess changes in COPD hospitalizations correlated with per 10 µg/m3 increments in PM2.5 and PM10 were 0.82% (lag 06) and 0.92% (lag 07), respectively, which were relatively below the estimates from the Western epidemiological studiesCitation24–Citation27 and from Hong Kong.Citation8,Citation28 For instance, a study conducted in Hong KongCitation8 revealed that per 10 µg/m3 increase in ambient PM2.5 and PM10 levels corresponded to a 3.1% and 2.4% increase in COPD admissions, which was similar to the estimates from a meta-analysis mainly based on North American and European studies.Citation13 However, Tian et alCitation23 analyzed the associations between PM2.5 exposure and COPD hospital admissions from 2010 to 2012 in Beijing and found that the per 10 µg/m3 increase in PM2.5 was associated with a 0.65% (lag 0) increment, which approximated to our risk estimates. A possible reason for the low percentage change in our study might be the nonlinear exposure–response relationships, which exhibited an apparent plateauing trend at high levels of pollutants.Citation18,Citation29 Moreover, different pollutant components and meteorological factors, as well as an enhanced awareness of personal protection in high-polluted areas, might contribute to the disparities in different cities.
In addition to the particulate matter, gaseous pollutants (NO2, SO2, and CO) were also associated with increased hospitalization among COPD patients. Lag effects in our analysis were largest for NO2 followed by SO2, PM10, and PM2.5, which was basically in line with the effect trends in other studies.Citation21,Citation30 For NO2 and CO, the cumulative lag days were at lag 06 in contrast to lag 01 for SO2. Differences in cumulative lag days and effect estimates may be attributable to the physicochemical properties of the pollutants and the biological mechanisms involved. In existent researches, exposures to particulate matters and NO2 were observed to induce airway hyperresponsiveness, inflammatory responses, and dysfunction of macrophages and epithelial cells,Citation31–Citation34 which in turn worsened the pre-existing respiratory inflammation in COPD patients.Citation35 These processes needed time to develop, with cumulative effects generated subsequently. However, SO2, which is known to be a strong irritant and a water-soluble gas, can exert immediate effects on the respiratory tract at early contact.Citation36 Taken together, the variations and mechanisms underlying the associations between air pollutants and COPD still need to be confirmed through additional experimental and epidemiological studies.
The subgroup analysis in our study suggested that elderly COPD patients were likely susceptible to the effects of air pollutants. Previous epidemiological studies also supported that elderly COPD patients were more sensitive to the increased PM2.5 levels.Citation21,Citation23,Citation37 Males had slightly higher risks of hospitalization when exposed to particulate matter, NO2, and CO in our analysis, which was not significant. Existent results on gender difference in air pollution epidemiology were not uniform.Citation21,Citation38 The plausible factors influencing gender difference are very broad, which may result in inconsistency. Sex-linked biological differences, hormonal status, occupational exposures, smoking behavior, residential exposures, and even different response to stressors may contribute to the distinction.Citation39 When comparing the risk estimates between warm and cold season, we found stronger risk effects in warm seasons. The season difference was consistent with results in mostly previous studies.Citation21,Citation23,Citation40 In recent years, the public had enhanced the protection awareness when exposed to severe haze days in Beijing. During warm seasons, most people spend more time outdoors and windows are often kept open for ventilations. While during high-polluted days in winter, patients may reduce the outdoor activity time, wear masks, and use the air purifiers in residence or workplace. So, direct exposure to air pollution and adverse effects in summer may be incurred.
This study had certain limitations. First, personal exposure in our study was replaced by the mean levels of ambient air pollution in Beijing city derived from air quality monitoring stations. The proxy method resulted in a bias of exposure evaluations and might have diminished the risk effects. However, up to now, researchers usually had no better choice but to utilize the outdoor fixed-site monitoring data to represent the ambient exposures, especially in large-scale epidemiology studies. Therefore, improving the exposure evaluation in epidemiological studies would be challengeable and critical. Second, other confounders, such as smoking, occupation, time spent outdoors, and socioeconomic status, were not included due to no access to these data. For another, GAM is a flexible method and no uniform criterion was used to set the df. The backfitting algorithm was a common method to estimate the smooth components in GAM model. The disadvantage of backfitting algorithm is that it is difficult to integrate with the estimation of the degree of smoothness of the model terms. So that, the df must be specified by the users in practice. To overcome this drawback, we used GCV to set the df, which is a data-driven automatic smoothing parameter selection method. Despite the higher computation complexity, GCV can help to select an optimized df.
Conclusion
Our study provided strong and updated evidence to prove that short-term exposure to PM2.5, PM10, SO2, NO2, and CO was associated with increased risk of COPD hospitalization in high-polluted settings, with larger effects in warm seasons. Compared with particulate matters, gaseous pollutants had larger effects on COPD hospitalizations. Males and elderly patients seemed to have slightly higher risks when exposed to ambient air pollution. These findings have crucial public health significance for the improvement of air pollution and protection of susceptible population in China, which can potentially reduce the COPD-related health burden.
Author contributions
Each author had full access to the data and took responsibility for the integrity of the data and the accuracy of the data analysis. All authors approved the final submitted manuscript. K-FX and CL conceived and designed the study. NG, JJ, YY, and SW collected and prepared the data. NG and JJ conducted the final analysis and drafted the manuscript. All authors contributed to data analysis, drafting or revising the article, gave final approval of the version to be published, and agree to be accountable for all aspects of the work.
Acknowledgments
This research was funded by the National Key Basic Research Program of China (973 Program) (2015CB553402), the Basic Research Fund of Central Public Welfare Scientific Institute (2016ZX310181-6), and the National Key Research and Development Program of China (2018YFC1313600).
Supplementary materials
Figure S1 Scatter plots of daily hospital admission visits and daily concentrations of PM10, NO2, SO2, CO, and O3 levels in Beijing, China, from January 1, 2013, to February 28, 2017.
Abbreviations: CO, carbon monoxide; NO2, nitrogen dioxide; O3, ozone; PM2.5, particulate matter ≤2.5 µm in aerodynamic diameter; PM10, particulate matter ≤10 µm in aerodynamic diameter; SO2, sulfur dioxide.
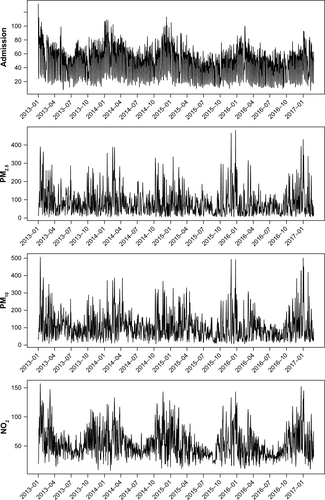
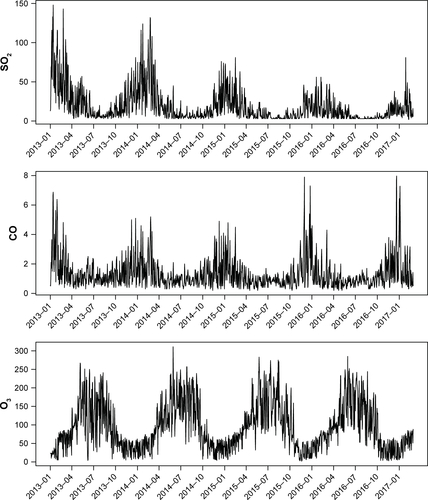
Figure S2 Percentages (%) with 95% CIs in multiday lag model for COPD hospital visits with per 10 µg/m3 increase in PM2.5 (A), PM10 (B), NO2 (C), SO2 (D), CO (E) and O3 (F) levels in patients aged over 75 years (in red color) and aged <75 years (in blue color).
Notes: For CO, percentage change in the relative risks corresponded to per 1 mg/m3 increase of CO levels. **P<0.01; *P<0.05.
Abbreviations: CO, carbon monoxide; NO2, nitrogen dioxide; O3, ozone; PM2.5, particulate matter ≤2.5 µm in aerodynamic diameter; PM10, particulate matter ≤10 µm in aerodynamic diameter; SO2, sulfur dioxide.
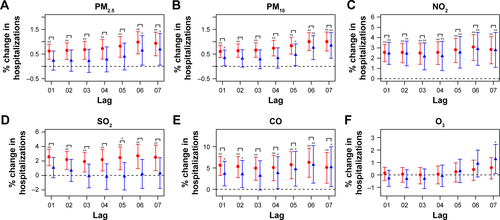
Figure S3 Percentages (%) with 95% CIs in multiday lag model for COPD hospital visits with per 10 µg/m3 increase in PM2.5 (A), PM10 (B), NO2 (C), SO2 (D), CO (E) and O3 (F) levels in female (in red color) and male (in blue color) patients.
Notes: For CO, percentage change in the relative risks corresponded to per 1 mg/m3 increase of CO levels. **P<0.01; *P<0.05.
Abbreviations: CO, carbon monoxide; NO2, nitrogen dioxide; O3, ozone; PM2.5, particulate matter ≤2.5 µm in aerodynamic diameter; PM10, particulate matter ≤10 µm in aerodynamic diameter; SO2, sulfur dioxide.
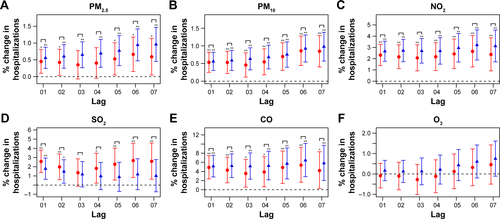
Table S1 Percentage changes (%) with 95% CIs in the single-day lag risks for COPD hospital admissions with per 10 µg/m3 increaseTable Footnotea in air pollutant concentrations stratified by age, sex, and season
Disclosure
The authors report no conflicts of interest in this work.
References
- GBD 2016 Risk Factors CollaboratorsGlobal, regional, and national comparative risk assessment of 84 behavioural, environmental and occupational, and metabolic risks or clusters of risks, 1990–2016: a systematic analysis for the Global Burden of Disease Study 2016Lancet2017390101001345142228919119
- ZhouMWangHZhuJCause-specific mortality for 240 causes in China during 1990–2013: a systematic subnational analysis for the Global Burden of Disease Study 2013Lancet20163871001525127226510778
- WangCXuJYangLPrevalence and risk factors of chronic obstructive pulmonary disease in China (the China Pulmonary Health [CPH] study): a national cross-sectional studyLancet2018391101311706171729650248
- EisnerMDAnthonisenNCoultasDAn official American Thoracic Society public policy statement: Novel risk factors and the global burden of chronic obstructive pulmonary diseaseAm J Respir Crit Care Med2010182569371820802169
- SchikowskiTAdamMMarconAAssociation of ambient air pollution with the prevalence and incidence of COPDEur Respir J201444361462624488569
- CireraLGarcía-MarcosLGiménezJDaily effects of air pollutants and pollen types on asthma and COPD hospital emergency visits in the industrial and Mediterranean Spanish city of CartagenaAllergol Immunopathol2012404231237
- TamWWWongTWWongAHHuiDSEffect of dust storm events on daily emergency admissions for respiratory diseasesRespirology201217114314822092966
- KoFWTamWWongTWTemporal relationship between air pollutants and hospital admissions for chronic obstructive pulmonary disease in Hong KongThorax200762978078517311838
- AtkinsonRWKangSAndersonHRMillsICWaltonHAEpidemiological time series studies of PM2.5 and daily mortality and hospital admissions: a systematic review and meta-analysisThorax201469766066524706041
- SamoliEStafoggiaMRodopoulouSAssociations between fine and coarse particles and mortality in Mediterranean cities: results from the MED-PARTICLES projectEnviron Health Perspect2013121893293823687008
- BurnettRTPopeCAEzzatiMAn integrated risk function for estimating the global burden of disease attributable to ambient fine particulate matter exposureEnviron Health Perspect2014122439740324518036
- SongQChristianiDCWangXRenJThe global contribution of outdoor air pollution to the incidence, prevalence, mortality and hospital admission for chronic obstructive pulmonary disease: a systematic review and meta-analysisInt J Environ Res Public Health20141111118221183225405599
- LiMHFanLCMaoBShort-term exposure to ambient fine particulate matter increases hospitalizations and mortality in COPD: a systematic review and meta-analysisChest2016149244745826111257
- ZhangJJSametJMChinese haze versus Western smog: lessons learnedJ Thorac Dis20157131325694813
- Beijing Municipal Environmental Monitoring Center Available from: http://www.bjmemc.com.cn/gzdt_getOneInfo.action?infoID=1913Accessed September 15, 2018
- WHO Regional Office for EuropeAir Quality Guidelines Global Update 2005 Particulate Matter, Ozone, Nitrogen Dioxide and Sulfur DioxideCopenhagenWorld Health Organization2006
- KanHChenRTongSAmbient air pollution, climate change, and population health in ChinaEnviron Int201242101921440303
- ChenRYinPMengXFine particulate air pollution and daily mortality. A nationwide analysis in 272 Chinese citiesAm J Respir Crit Care Med20171961738128248546
- KatsouyanniKTouloumiGSamoliEConfounding and effect modification in the short-term effects of ambient particles on total mortality: results from 29 European cities within the APHEA2 projectEpidemiology200112552153111505171
- LiJSunSTangRMajor air pollutants and risk of COPD exacerbations: a systematic review and meta-analysisInt J Chron Obstruct Pulmon Dis2016113079309128003742
- ZhangZWangJChenLImpact of haze and air pollution-related hazards on hospital admissions in Guangzhou, ChinaEnviron Sci Pollut Res Int20142164236424424306726
- DominiciFMcDermottAZegerSLSametJMOn the use of generalized additive models in time-series studies of air pollution and healthAm J Epidemiol2002156319320312142253
- TianYXiangXJuanJShort-term effects of ambient fine particulate matter pollution on hospital visits for chronic obstructive pulmonary disease in Beijing, ChinaEnviron Health20181712129482552
- ChenYYangQKrewskiDShiYBurnettRTMcGrailKInfluence of relatively low level of particulate air pollution on hospitalization for COPD in elderly peopleInhal Toxicol2004161212514744661
- CanovaCDunsterCKellyFJPM10-induced hospital admissions for asthma and chronic obstructive pulmonary disease: the modifying effect of individual characteristicsEpidemiology201223460761522531667
- SantusPRussoAMadoniniEHow air pollution influences clinical management of respiratory diseases. A case-crossover study in MilanRespir Res2012139523078274
- MooreEChatzidiakouLKukuMOGlobal associations between air pollutants and chronic obstructive pulmonary disease hospitalizations. A systematic reviewAnn Am Thorac Soc201613101814182727314857
- TianLHoKFWangTAmbient carbon monoxide and the risk of hospitalization due to chronic obstructive pulmonary diseaseAm J Epidemiol2014180121159116725480818
- KatsouyanniKTouloumiGSpixCShort-term effects of ambient sulphur dioxide and particulate matter on mortality in 12 European cities: results from time series data from the APHEA project. Air pollution and health: a European approachBMJ19973147095165816639180068
- WongCMVichit-VadakanNKanHQianZPublic Health and Air Pollution in Asia (PAPA): a multicity study of short-term effects of air pollution on mortalityEnviron Health Perspect200811691195120218795163
- KienastKKnorstMMüller-QuernheimJFerlinzRModulation of IL-1 beta, IL-6, IL-8, TNF-alpha, and TGF-beta secretions by alveolar macrophages under NO2 exposureLung1996174157678747002
- AndersonHRSpixCMedinaSAir pollution and daily admissions for chronic obstructive pulmonary disease in 6 European cities: results from the APHEA projectEur Respir J1997105106410719163648
- GarnHSieseAStumpfSBarthPJMüllerBGemsaDShift toward an alternatively activated macrophage response in lungs of NO2-exposed ratsAm J Respir Cell Mol Biol200328338639612594066
- TaoFGonzalez-FlechaBKobzikLReactive oxygen species in pulmonary inflammation by ambient particulatesFree Radic Biol Med200335432734012899936
- WuSNiYLiHShort-term exposure to high ambient air pollution increases airway inflammation and respiratory symptoms in chronic obstructive pulmonary disease patients in Beijing, ChinaEnviron Int201694768227209003
- ZhangZWangJLuWExposure to nitrogen dioxide and chronic obstructive pulmonary disease (COPD) in adults: a systematic review and meta-analysisEnviron Sci Pollut Res Int20182515151331514529558787
- ChangJHHsuSCBaiKJHuangSKHsuCWAssociation of time-serial changes in ambient particulate matters (PMs) with respiratory emergency cases in Taipei’s Wenshan DistrictPLoS One2017127e018110628732014
- XuQLiXWangSFine particulate air pollution and hospital emergency room visits for respiratory disease in urban areas in Beijing, China, in 2013PLoS One2016114e015309927054582
- CloughertyJEA growing role for gender analysis in air pollution epidemiologyEnviron Health Perspect2010118216717620123621
- Medina-RamónMZanobettiASchwartzJThe effect of ozone and PM10 on hospital admissions for pneumonia and chronic obstructive pulmonary disease: a national multicity studyAm J Epidemiol2006163657958816443803