
 ?Mathematical formulae have been encoded as MathML and are displayed in this HTML version using MathJax in order to improve their display. Uncheck the box to turn MathJax off. This feature requires Javascript. Click on a formula to zoom.
Abstract
The lighting condition is critical in the anthropometric scanning process. Optimal lighting condition affects the time and precision. The current study sought to determine the optimal light for measuring the static anthropometric dimensions of feet and hands based on the precision, trueness, and efficiency of EinScan Pro 2X Plus. Three conditions of the scanning process were Light Zero Light/ZL: 5–50 lux, Normal Light/NL: 50–100 lux, and Room Light/RL: 100–200 lux. The data collected and analyzed were 3D model mesh data (point clouds), which were then processed using CAD software for deviation analysis. The precision variable was computed using the pooled standard deviation () value. The Absolute Error (AE) and Absolute Percentage Error (APE) were used to calculate the trueness variable. The efficiency aspect was measured based on the average value of measurement time. The optimal lighting condition was ZL, which was determined using a simple additive weighting method. The precision of the hand in
value was 1.25 mm while the foot precision was 0.92 mm. The hand trueness in AE value was 1.73 ± 1.33, while the foot trueness was 1.34 ± 1.20 mm. The hand efficiency in time value was 273.94 s, and the foot efficiency were 272,94 s.
1. Introduction
Anthropometry is a branch of human science that studies body measurements, specifically its size, shape, strength, mobility, flexibility, and work capacity (Pheasant & Haslegrave, Citation2005). Although CAESAR has conducted global anthropometric measurements of the human body using 3D scanners (Robinette et al., Citation1991), there is no detailed anthropometry guide for hands and feet. The dimensions of the hands and feet in Indonesian anthropometric data are limited to length and width, using conventional methods in the measurement. D1-D36 are the dimensions of anthropometric data of the Indonesian human body collected at the national level. In several studies, anthropometry data of hands and feet have many functions, such as the design of work area, namely the access space for the hands (Imrhan et al., Citation2009); the ergonomics design of work equipment, namely agricultural hand tools (Wibowo & Soni, Citation2014); the ergonomics design of a consumptive product, such as socks, sandals, watches, and mouses. Furthermore, prosthetic hands and feet are being developed that require anthropometric measurements of the hands and feet in the design. Researchers used 3D scanners to measure the anthropometry of the feet (Witana et al., Citation2006), the anthropometry of the hands (Yu et al., Citation2013), and other detailed information on body contours. However, conventional methods are most commonly used because they produce valid data and are inexpensive. The application of the conventional method, on the other hand, must be carried out on the spot. By using a 3D scanner, researchers can avoid calling on respondents for re-measurements, additional dimension measurements, or in-depth analysis. Researchers simply see the 3D model stored in the software. The YETI laser, David Laser-Scan, The Structure Sensor Scanner connected to the iPad, NextEngine Inc, NEXHAND, and other 3D scanners can be used to measure the anthropometry of the foot and hand. There are no studies in Indonesia that use 3D scanners to measure hand anthropometry, but there is one for foot anthropometry. Mindarti and Dharma’s (Citation2015) research employed Kinect to examine parameter optimization in foot measurement. Another research (Dharma & Nathania, Citation2017) tested the trueness of the David Laser Scanner for anthropometric measurements of the foot.
EinScan Pro 2X Plus is one of the portable 3D scanners available in Indonesia that can scan inanimate objects as well as the human body. The EinScan Pro 2X Plus is operated by gripping the object and then moving around it until its surface is successfully modeled in the EXScan Pro software. Because of its small and portable size, this tool can reach the body parts of the feet and hands. This scanner measures manually, which means that the user must specify the points to be measured in the scanned 3D model, in contrast to automated measurement where the software displays the size data directly.
Lighting may affect the scanning process of EinScan Pro 2X Plus. If the lighting is too bright, the scanner cannot properly read the coordinates of the object being scanned, so it takes longer to scan the area. This process may result in a lengthy total scanning time. In addition, environmental light conditions can result in perforated scanned point clouds. When this perforated point cloud is turned into a mesh, it produces a perforated surface. The EXScan Pro software can fill the hole but the shape does not match the original object. If the scan result differs from the original object, re-scanning is required. As a result of the repetition process, the data retrieval time will be prolonged. This condition necessitates the use of a parameter protocol for environmental lighting conditions in scanning hands and feet using EinScan Pro 2X Plus in order to obtain accurate anthropometric measurements and fast scanning time.
The accuracy of the scanner may vary depending on the object being scanned and the method used (Witana et al., Citation2006). Accuracy is a combination of trueness and precision (ISO ISO 5725–1). Trueness describes how similar repeated measurements of the same object are to each other, whereas precision describes how far the measurements deviate from the actual dimensions of the object being measured. Previous research (Arakida et al., Citation2018; Gerbino et al., Citation2016; Griffin et al., Citation2019; Lemeš & Zaimović-Uzunović, Citation2009; Revilla-León, Jiang, et al., Citation2020; Revilla-León, Subramanian, et al., Citation2020; Weinberg et al., Citation2004; Witana et al., Citation2006; Yu et al., Citation2013) have focused on trueness, precision, or both. Trueness and precision are measured when different measurement methods are used or when the scan is subjected to different light effects. This study refers to research (Arakida et al., Citation2018) that investigates the effect of light on trueness, precision, and time on the intraoral scanner. However, this study did not examine efficiency like the Arakida study. Other studies on the effect of light on 3D scanning results have been carried out on other objects such as hands, feet (Griffin et al., Citation2019), color spectrum (Lemeš & Zaimović-Uzunović, Citation2009), and automotive parts (Gerbino et al., Citation2016).
Based on these backgrounds, this study aims at determining the optimal light for measuring the static anthropometric dimensions of feet and hands based on the precision, trueness, and efficiency of EinScan Pro 2X Plus in different environmental lighting conditions
2. Methods
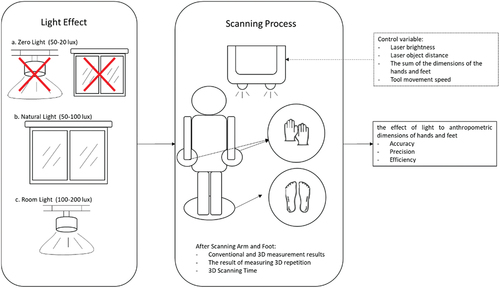
The data collected and analyzed in this study were 3D model data in the form of point clouds or mesh data, which were then processed using CAD software for deviation analysis. As in the research, the data to be taken and examined in this study were linear and circular dimensions (Mindarti & Dharma, Citation2015; Weinberg et al., Citation2004; Yu et al., Citation2013). This study measured the precision of the scanning process, as well as the precision and efficiency of the results of measuring the anthropometric dimensions of the hands and feet using the EinScan Pro 2X Plus 3D scanner in three different environmental lighting conditions. The environmental lighting conditions were zero light (ZL) in the 5–20 lux range, natural light (NL) in the 50–100 lux range, and room light (RL) in the 100–200 lux range. This study also investigated optimal lighting conditions and developed a scanning protocol as well as anthropometric measurements of the feet and hands using the EinScan Pro 2X Plus in optimal light conditions (Figure .).
Figure 1. Conceptual model for research.
2.1. Research variables
There were 12 anthropometric dimensions of the foot (Price and Nester, Citation2016) (Table ) and 33 anthropometric dimensions of the hand that were measured in this study (Figure and Table ) (Yu et al., Citation2013). In Yu’s study, these dimensions were used to compare the results of 3D measurements to the results of conventional measurements. This reference to hand dimension was taken from research (Kwon et al., Citation2009) on the need for producing pressure therapy gloves, which was also based on the 1988 US Army hand anthropometric survey report (Greiner, Citation1991). The light conditions are selected for indoor use and in the range of 0–200 lux because the tool specifications state that for outdoor or outdoor use, a cover must be provided so that it is not exposed to direct sunlight.
Figure 2. Hand dimension(Yu et al., Citation2013).
Table 1. Foot dimension (Price & Nester, Citation2016)
Table 2. Hand dimension (Yu et al., Citation2013)
Range class lighting refers to IES illumination standards. It is recommended for category A, which is public areas with dark environments, to be 20-30-50 lux. In the study, the condition without light (NL) is a condition in which there is no exposure to light from nature or lamps but cannot eliminate light sources from laptops or light reflections from objects in the room, so the NL illumination value is set at 5 lux to illumination in category A, namely 20 lux. Natural light conditions (NL) were carried out in a room with an open window, with the scanning position not directly exposed to sunlight but still close to the window. The amount of illumination in the area near the window is around 1000 lux, and getting to the middle is 25–50 lux, so 50–100 lux illumination is used. The maximum limit at NL is 100 lux because 100 lux illumination falls under category C of the IES illumination standard, which is used in room light conditions (RL). The RL condition refers to the standard category C illumination, which is a public space with rare visual tasks and a light level of 100–200 lux. Figure depicts the experimental conditions in this study, while Table shows the dependent variables.
Figure 3. Experimental condition.
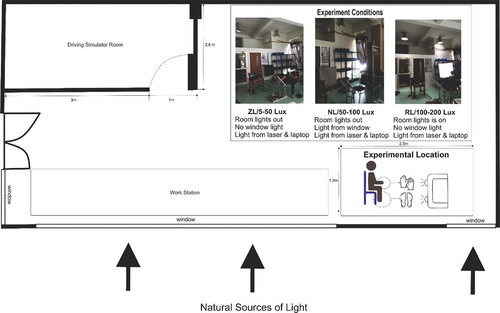
Table 3. Dependent variable
The control variable is a variable that is controlled or made constant so that the relationship between the independent variable and the dependent variable is not affected by unobserved external factors. The control variables in this study are:
Brightness: good (light gray color)
Tool-to-object distance: the shortest distance is 410 mm, the optimal distance is 510 mm, and the longest distance is 610 mm. The green LED on the tool indicates the correct distance.
Scan speed: constant, ranging from 5.4 to 7.4 cm/s (Mindarti, 2015).
2.2. Experiment design
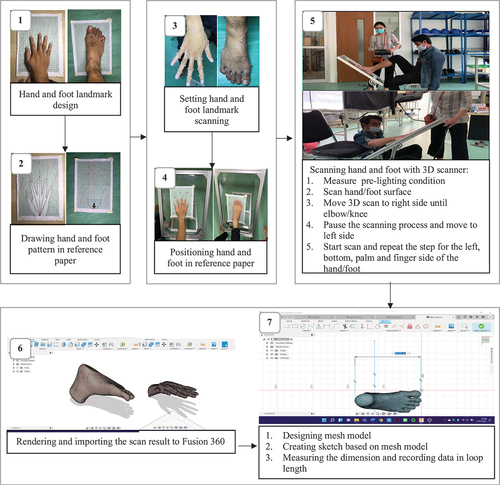
This research focused on the trueness, precision, and efficiency of the 3D scan results when subjected to various light treatments. The experiment was carried out using a within-subject design, which means that the same respondent received all of the independent variable treatments. In this experiment, each respondent’s hands and feet were measured using both conventional and 3D methods. The conventional method employed a measuring tape, caliper, and ruler whereas the 3D method utilized the EinScan Pro 2X Plus scanner. On the 3D scan, each respondent also received three different light treatments. Procedure of hand and feet measurement using 3D can be seen in Figure .
Figure 4. Procedure of hand and feet measurement using 3D scan.
The process of collecting anthropometric data on each respondent’s feet and hands was carried out alternately, with the hands coming first and then the feet. Conventional measurement methods were not subjected to different environmental light treatment. The 3D scan was subjected to different environmental light treatment. Conventional measurements (KV) were carried out three times. The 3D scan was repeated five times under each light condition, yielding five foot models (3D_1, 3D_2, 3D_3, 3D_4, and 3D_5) for each light treatment. During the transition between scans, the respondents were given a 10-minute break to rest their hands and feet, but they must not change the position of their hands and feet excessively so that the 3D modeling results were consistent. If the position had changed, the foot position was readjusted using pattern paper.
The conventional measurement results served as a valid reference point in determining the trueness of the 3D scanner results. Meanwhile, the results of five anthropometric measurements on the 3D model were compared to precision. Scan times in various lighting conditions on five scans were used to calculate efficiency. Based on the treatment described, each respondent was subjected to 18 data collection sessions.
This study required ten anonymized samples, namely six men and four women between the ages of 21 and 23. Purposive sampling was used to select samples, which were taken intentionally in accordance with the sample requirements, which were as follows: (1) Normal hands and feet, no bone abnormalities due to accidents or genetics, (2) Right-handed and left-handed, (3) Normal weight and not obese, based on Body Mass Index (BMI) (4) Signed the respondents written consent to take part the research.
3. Result and discussion
Table shows the results of the calculation of the 3D scanning luminance level from three conditions (ZL, NL, and RL).
Table 4. 3D scan exposure levels
3.1. Conventional data precision test
Data from conventional hand and foot measurements need to be tested for precision. The level of precision can explain whether the observer performs three measurements consistently. The results of conventional measurements are reliable to examine the trueness if the values are consistent in each repetition for the same measurement. Conventional measurement results are unreliable if repeated measurements yield different results.
The intra-class correlation coefficient (ICC) is one method to measure the consistency of the measurement results from the same observer. By using the ICC, the consistency of the measurement data can be assessed on a scale of 0 to 1. The ICC model used in this study was ICC (2.1), which is a two-way mixed model effect because the reliability that is measured is the result of an observer’s measurement and test absolute agreement.
The prerequisite precision test with normality test for conventional data on hands and feet reveals that all dimensions are normally distributed (sig. > 0.05) so that precision calculations can be performed using the intraclass correlation coefficient (ICC) method. The ICC calculation results show that all conventional measurements of the dimensions of the hands and feet have a score of more than 0.9, indicating that the conventional measurement precision is in the very good category and can be used as the actual measure or reference value for measuring the trueness variable.
3.2. 3D measurement data precision test
The precision of repeated measurements describes how close the results are to each other. The precision of this study seeks to determine whether there are any differences in the results of the five repetitions of 3D measurements in each dimension for each lighting condition. The precision of 3D measurement results was measured using ICC calculations or repeated measures ANOVA as in conventional measurement data. After determining whether there are differences in the results of repeated measurements in each dimension in each lighting condition, the processing was continued by finding how precise each dimension was in each lighting condition. The method used is pooled standard deviation (). Standard Deviation (SD) can be used for precision calculations because it describes how the distribution of data in a sample and how close the data is to the sample mean.
is the mean of SD for two or more groups. In this study, each dimension was measured five times for ten respondents, yielding
as the SD. Based on the value of
, it is possible to determine how much the measurement repetition value differs from the average value for each dimension in each lighting condition in five repeated measurements.
In contrast to precision calculations on conventional data, if the ICC or repeated measures ANOVA results on the five repeaters differ, the data processing is still carried out to the stage, and no repeated measurements are made. Precision calculations on conventional data serve to ensure the data’s reliability as the true value of the anthropometric dimension measurement results. While the precision calculation of the 3D scan results serves to determine how much precision in each lighting condition. When the value of
is known, a one-way ANOVA test is performed to find out whether the average value of
differs among the three lighting conditions.
The Shapiro-Wilk test was used as a prerequisite test to determine the normality of the 3D hand and foot measurement data. The test results reveal that the data was not normally distributed (sig. < 0.05), so a repeated measures ANOVA test was used to determine if there were differences in the 3D measurement results across the five repetitions in each lighting condition in each dimension. The results of the normality test of hand residuals with the Shapiro-Wilk test as an assumption that must be met for repeated measures ANOVA indicate that some data are not normally distributed (sig. <0.05), so hand and foot residual data that are normally distributed are tested with repeated measures ANOVA, while data that are not normally distributed are tested by Friedman’s test on the precision calculation. Mauchly’s Test of Sphericity was conducted in the repeated measures ANOVA test to determine whether the data met the assumption of the same variance. According to the results of Mauchly’s Test of Sphericity for hand data, all data with normally distributed residual data pass the assumption test (sig. > 0.05). Based on the results of Mauchly’s Test of Sphericity for foot data, the data with nonhomogeneous variance are D2_ZL, D7_NL, and D9_NL (sig. < 0.05).
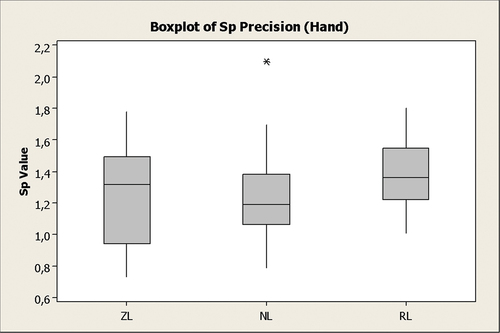
The data processing is continued by calculating the standard deviation to determine the precision value of each hand dimension in each lighting condition. The standard deviation of each respondent is used to obtain the pooled standard deviation () value. The amount of Sp that is still within tolerance or where the difference is not significant is less than 2 mm (< 2 mm).
The only hand dimension that is larger than 2 mm is the L12_NL dimension, with a value of 2.10 m. The largest standard deviation on the hand is 2.10 mm at the L12_NL dimension, and the smallest standard deviation is 1.78 at the L8_ZL dimension. The average value of the smallest precision is in the ZL and NL lighting conditions, followed by RL, which is 1.25 mm and 1.37 mm. The amount of ZL lighting precision is the smallest precision value, with an average value of 0.73–1.78 mm, followed by NL and RL values of 0.79–2.10 mm and 1.01–1.8 mm, respectively. According to the graph in Figure , the lighting condition with
closest to 0 overall is the ZL condition. This is supported by the smallest gradient value of 0.0219, followed by RL and NL values of 0.0062 and 0.0071, respectively. Figure shows the
graph for the hand.
Figure 5. 3D hand data efficiency graph.
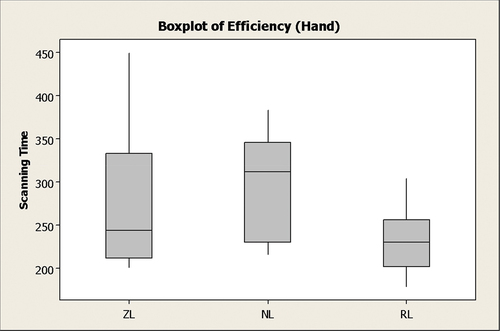
Figure 6. Graph of 3D Hand Data Precision.
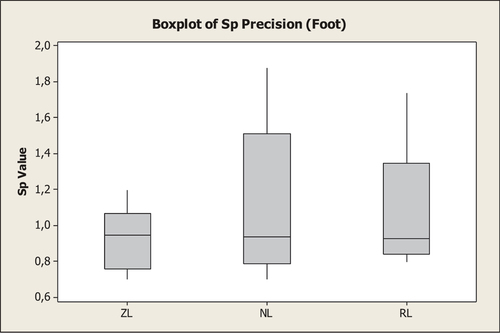
The eleven dimensions of foot show a standard deviation value of less than 2 mm in all three lighting conditions, with the largest standard deviation being 1.88 mm in D1_NL and the smallest being 0.7 in D3_ZL and D3_NL. The average value of the smallest precision is in the ZL lighting condition, followed by RL and NL values of 0.92 mm, 1.10 mm, and 1.11 mm, respectively. The magnitude of the precision of the ZL condition is the smallest precision value of 0.701.20, followed by RL and NL values of 0.801.74 mm and 0.70–1.88 mm, respectively. Based on the graph in Figure , the lighting conditions with the lowest standard deviation, closest to 0 overall, are ZL conditions. This is supported by the smallest gradient value of 0.0107, followed by RL and NL values of 0.057 and 0.0684, respectively.
Figure 7. Graph of 3D Foot Data Precision.
A one-way ANOVA test on the value of was then performed to determine whether there was a significant difference in
among the three lighting conditions. The normality test on the
data revealed that ZL, NL, and RL were normally distributed (sig. > 0.05), allowing for a one-way ANOVA parametric test. The homogeneity test for hand data (sig. = 0.113) revealed sig > 0.05, indicating that the data met the homogeneity assumption. The one-way ANOVA test results (Sig. = 0.148) were greater than 0.05, indicating that there was no significant difference in the mean of
of the three lighting conditions. A pairwise comparison test using Tukey’s test was conducted to which lighting conditions were the most different. Tukey’s test results showed that there was a significant difference in hand data lighting between ZL and RL (sig. = 0.0399).
On the foot data, the Kruskal-Wallis test (sig. = 0.719) revealed sig > 0.05, indicating that there was no difference in the mean of the three standard deviations of lighting conditions. A pairwise comparison test using Tukey’s test was carried out to determine which lighting conditions were the most different. Tukey’s test results showed that there was no significant difference in lighting between ZL, NL, and RL.
Table shows the results of precision data processing on the hands and feet. The level of precision was tested in this study by comparing the results of anthropometric measurements of hands and feet under ZL, NL, and RL lighting conditions.
Table 5. Results of precision data processing
The precision of measurement is critical because high levels of intra- or inter-observer measurement error can lead to misleading results, particularly when statistically comparing groups. Some dimensions have a significant difference in the average value for five repetitions of the measurement in each lighting condition.
Repeated measures test and Friedman test that produced sig < 0.05 in the ZL condition were dimensions C12, C13 and L6; in the NL conditions were dimensions C12, C13 and C14; and in the RL conditions were dimensions C9 and C12. On the foot object, the RL condition on dimensions D2, D5, and D7 yielded a sig < 0.05 value. Dimensions that had a significant average difference were included in the category of finger circumference dimensions except for the L6 dimension, which was the length of the tip of the thumb to the length of the wrist crease, D2, D5, and D7. In the circumference dimension with the dimension code C, the average difference might occur because the scan results were in the form of point clouds, the surface part that could not be completely scanned and become a hollow part was the surface of the sides of the finger. This part was then reconstructed using software algorithms so that it was not identical to the original object and allowed for a difference in shape between the first and the next scan results.
Differences might occur at the L6 dimension because the scanning process was repeated five times whereas a single scan starting from preparation could take about 10 minutes. The lengthy measurement process allowed for changes in the shape of either pressure or shift due to fatigued respondents as in the study (Witana et al., Citation2006) that scanned objects directly from human feet. This is also supported by the L6 dimension, as the thumb at the very end made it easy to change positions. Despite the differences, the standard pooled deviation values of C12_ZL, C13_ZL, L6_ZL, C12_NL, C13_NL, C14_NL, C9_RL, C12_RL, D2, D5, and D7 were less than 2 mm, indicating that the difference was still acceptable. Based on the Sp value, the L12 dimension, which is the length from the little finger to the outer wrist, yielded a value of 2.10 mm, which is 0.10 mm, greater than 2 mm, even though there was no significant difference in average (sig > 0.05) in Friedman’s test. This might be due to movement by the respondent R7 when scanning, as in the L6 dimension.
The value of the hands of the ZL, NL, and RL conditions, when compared using the Kruskal-Wallis test, resulted in a sig > 0.05 value, indicating that there was no significant difference in average. The results of the Tukey comparison test revealed that there was a difference between the average lighting conditions of ZL and RL. When the value of
for the foots of the ZL, NL, and RL conditions was compared using the one-way ANOVA test, sig > 0.05 was obtained, indicating that there was no significant difference in average. The result of the insignificant difference in mean precision between lighting conditions was in line with the results in previous studies (Fourie et al., Citation2011; Weinberg et al., Citation2004). There was no significant difference in the precision value in either study because errors stemming from incorrectly identifying landmarks could be avoided by using embossed landmarks affixed to the surfaces of the hands and feet. Weinberg’s study compared the results of 3D and conventional craniofacial dimension measurements with the method with and without landmarks, respectively. As a result, 3D scanning with landmarks provided a higher precision value. In this study, the measurement process employed the same landmark in all three lighting conditions.
The low average value indicated that the data’s range of variation was shrinking and approaching the average value. The ZL and NL conditions on the hand object produced the smallest average
value of 1.25 mm, followed by the RL with a value of 1.37 mm. The values of ZL and NL were the same, while the value of RL was different, which was in accordance with the Tukey test results, which showed that there was a difference between ZL and RL. The ZL condition outperformed the NL condition because the minimum and maximum values were smaller, namely 0.73–1.78 mm versus 0.79–2.10. At the foot of the ZL condition, the lowest
value was 0.92, followed by RL of 1.10 mm and NL of 1.11 mm.
3.3. Measurement of trueness data
The trueness of measurement describes how far it deviates from the actual dimensions of the object being measured. High trueness produces measurements that are close to or equal to the actual dimensions of the object being measured. The purpose of this study is to determine whether there are any differences between the results of 3D measurements taken under ZL, NL, and RL lighting conditions and conventional measurement results. Conventional measurement is considered the true value of the object being measured.
The trueness was tested by conducting a one-way ANOVA test. The data used for the trueness test was the average of three repetitions of conventional measurements per dimension with an average of five repetitions of 3D measurements per dimension in each ZL, NL, and RL lighting condition. The Shapiro-Wilk test for hand data revealed that the dimensions C2_ZL, L13_4, and L13_5 were not normally distributed, so they were tested using the Kruskal-Wallis test, and data that passed the normality test were tested using one-way ANOVA. The Shapiro-Wilk test for foot data revealed that the dimensions D2_NL and D5_NL were not normally distributed, so both dimensions were tested with the Kruskal-Wallis test, and data that passed the normality test were tested with one-way ANOVA. The homogeneity test revealed that all of the dimensions of the hands and feet that passed the normality test resulted in a value of sig. > 0.05, indicating that the data met the homogeneous assumption.
The one-way ANOVA parametric test and the Kruskal-Wallis nonparametric test were used to determine whether there was an average difference between the three lighting conditions and the conventional measurement results for each dimension. The one-way ANOVA and Kruskal-Wallis tests of hand data revealed that the dimensions C1 to B2 had a Sig value > 0.05, indicating that there is no difference in average between conventional calculations, 3D calculations for ZL conditions, 3D calculations for NL conditions, and 3D calculations for RL conditions. The calculation was then continued with a pairwise comparison test using the Tukey test to test the most diverse lighting conditions for each dimension. The Tukey test revealed that all pairwise comparisons across dimensions yielded sig > 0.05 values, indicating that there is no significant average difference between conventional calculations, ZL conditions, NL conditions, and RL conditions.
The trueness of hand measurement results in the ZL, NL, and RL conditions is expressed in terms of the average absolute error (AE) and absolute percentage errors (APE). The average AE and APE of the ten respondents under ZL conditions were 1.73 ± 1.33 mm and 0.2 ± 0.02%, NL was 1.80 ± 1.38 mm and 0.2 ± 0.02%, and RL was 1.97 ± 1.69 mm and 0.3 ± 0.02%. The ZL condition produces the smallest AE average, followed by the NL and RL conditions.
The one-way ANOVA and Kruskal-Wallis tests for foot data revealed that the dimensions D1 to D2 have a significance value > 0.05, indicating that there is no difference in average between conventional calculations, 3D calculations for ZL conditions, 3D calculations for NL conditions, and 3D calculations for RL conditions. The calculation was then followed by a pairwise comparison test using the Tukey test to test the most diverse lighting conditions for each foot dimension. The Tukey test showed that all pairwise comparisons resulted in sig. > 0.05, indicating that there was no significant average difference between conventional calculations, ZL conditions, NL conditions, and RL conditions. The trueness of the measurement results in the ZL, NL, and RL conditions was expressed in terms of the average of absolute error (AE) and absolute percentage errors (APE). The average AE and APE of the ten respondents in the ZL condition were 1.34 ± 1.20 mm and 1.09 ± 0.88%, NL was 1.61 ± 1.50 mm and 1.55 ± 1.65%, and RL was 1, 38 ± 1.49 mm and 1.29 ± 1.52%. In this study, the average significant AE size was greater than 2 mm. There are three dimensions with an average AE greater than 2 mm, namely D4_ZL, D7_ZL, D4_NL, D5, NL, D7_NL, D4, RL and D7_RL. Table shows the recapitulation of data processing results for trueness data.
Table 6. Recapitulation of data processing trueness
The results of intra-operator reliability testing on conventional hand and foot measurement data yielded an ICC value of 0.882–1. The level of reliability of the conventional measurement results fell into the good and very good categories, in line with the results of research (Witana et al., Citation2006) on the foot object. The results of the one-way ANOVA of hand and foot data showed that there was no significant difference between the measurement results of the CV, ZL, NL, and RL. The pairwise comparison test of Tukey’s test for hand and foot data revealed no significant difference between the CV, ZL, NL, and RL pairs.
Although there is no significant difference in the average, the AE value was used to examine the level of trueness between the three. On the hand object, the dimensions that produced an AE value greater than 2 mm in the ZL condition were C13, C15, C16, C17, L2, L9, and L10; in the NL conditions were C6, C7, C10, C11, C16, C17, L2, L10, and L12; and in the RL condition were C6, C7, C11, C14, C15, C17, and L2. On the foot object, the dimensions that produced an AE value greater than 2 mm in the ZL condition were D4 and D7; in the NL conditions were NL D4, D5, D7, and L12; and in the RL dimension were D4 and D7.
Circumference dimensions with AE values greater than 2 mm were fairly common (dimensions with code C on the hands and D7 on the feet). This is possible because conventional measurements have traditionally used a measuring tape to determine thickness or circumference dimensions. This is in line with research (Witana et al., Citation2006). The measuring tape does not make full contact with the foot due to the uneven contour of the foot. When the band is stretched around the foot, a hole may form between the band and the surface of the skin.
In addition to the circumference dimensions, the overall 3D scan results on the dimensions of the feet produced an error value of less than 2 mm. This is consistent with the results of research (Spahiu et al., Citation2015) that compared the trueness of 3D scanner results to conventional foot anthropometry measurements. It was found that the magnitude of the error in the foot dimension was less than 2 mm, which is the maximum error allowed between the extracted value and the traditionally measured value, according to the ISO 20,685:2010(E) standard.
In the data of hands and feet, NL lighting conditions resulted in the greatest number of dimensions that exceeded the AE value by more than 2 mm, namely 9 for the hands and 4 for the feet. Most optical scanners acquire 3D data by projecting a laser beam onto the original geometry’s surface and capturing the reflected light. This is in line with research (Blanco et al., Citation2008) regarding the effect of environmental lighting on the quality of Laser Digitizing the laser surface, namely if the illumination of the laser beam is too high, the sensor will become saturated. As a result, the system was unable to calculate the position of the point or point cloud.
In the NL light condition, although the amount of illumination (50–100 lux) was lower than those of the RL light condition (100–200 lux), the light source is the sunlight passing through the window. During the experiment, the respondent’s body was turned away from the light, causing light rays to shine on the surface of the feet. When the tool scanned the sole, the machine was facing the window, exposing it to direct sunlight. The amount of illumination emitted by the sun can exceed 200 lux. As a result, the tool had difficulty scanning and produced errors in the 3D model, causing measurement results to differ from conventional measurements. The best level of trueness was determined by the smallest AE average value. The smallest AE average value indicates that the measurement results in lighting conditions have a small error value when compared to conventional measurement results. On the hand object, the ZL condition yielded the smallest value, namely 1.73 ± 1.33 mm, followed by NL of 1.80 ± 1.38 mm and RL of 1.97 ± 1.69 mm. In the foot object, the ZL condition produced the smallest value, namely 1.34 ± 1.20 mm, followed by RL of 1.38 ± 1.49 mm and NL of 1.61 ± 1.50 mm.
3.4. Measurement of efficiency data
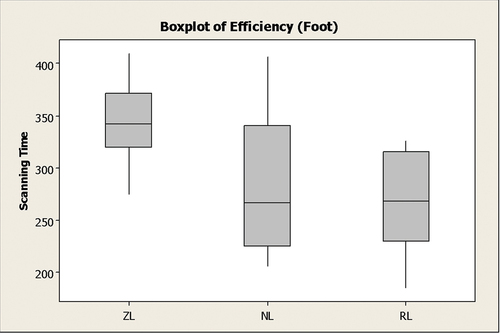
Descriptive analysis of hand dimension data showed that conventional measurement (1.590,23 ± 18.14 sec) required longer time compared with 3D scan method (ZL 273.94 ± 79.94 sec; NL 294.4 ± 58.83 sec; RL 232.52 ± 37.09 sec). It concluded that 3D scan measurement required only 15–19% scan processing time compared with conventional method for hand data. Similar with hand dimension, foot measurement using 3D scan (ZL 266.55 ± 40.9 sec; NL 284.16 ± 56.6 sec; RL 274.48 ± 43.4 sec) was completed faster than conventional method (808.86 ± 33.3 sec) and required 33–35% scan processing time only.
The Shapiro-Wilk test was used to test the assumption of normality prior to performing the one-way ANOVA test. The Shapiro-Wilk test of hand data revealed that lighting conditions of ZL, NL, and RL produced sig < 0.05, indicating that the data were not normally distributed. Since the data were not normally distributed, the Kruskal-Wallis test was conducted to examine the time data. The Kruskal-Wallis test resulted in (sig = 0.010) <0.05, indicating a difference in average 3D scanning time in the ZL, NL, and RL conditions. According to the results of the pairwise comparison of the Tukey test, the significance value of NL and RL lights was less than 0.05, indicating that there was an average difference in the NL and RL light conditions. Table shows the results of data processing efficiency.
Table 7. Recapitulation of efficient data processing
Because the foot dimension data were not normally distributed, the Kruskal-Wallis test was conducted to examine the time data. The result of Kruskal-Wallis test (sig. 0.783) was greater than 0.05, indicating that there was no significant difference in average 3D scanning time between the ZL, NL, and RL conditions. The pairwise comparison test of Tukey’s test results shows that the three lighting conditions produced a significance value greater than 0.05, indicating that there was no significant difference in average. The RL exposure produced the shortest scan time, while the NL exposure yielded the longest. When made into a graph, the lighting conditions from the most stable scan time were ZL with a gradient of 0.2195, NL of 0.5416, and RL of 1.0969. Figure shows the graph.
Figure 8. 3D foot data efficiency graph.
Based on the average value, the RL condition had the shortest hand and foot time data, and the NL condition had the longest. This result is different from previous research (Arakida et al., Citation2018), in which the lighting with the highest level of illumination resulted in the longest scanning time. This is because scan times were fast and scans ran easily on the surface of the foot under the RL light condition, whereas the fingertips had folds that were difficult to record due to the uneven distribution of light on this surface. The portion of the finger on the sole was also difficult to record because the laser was directly facing the light beam, which interfered with the laser beam. As a result, the scanning process was completed with conditions on the perforated finger. This is because if scanning was continued on the hollow part, the tool might misread the position of the object and create a new object shape, resulting in two 3D images for the same object.
The NL condition produced the longest time because the sunlight was stronger than the laser beam from the machine. The machine took a long time to read the surface of the object due to the obstruction of sunlight. This is in line with research (Blanco et al., Citation2008) that lasers irradiated with high illumination can cause partial defects in the point cloud and impede scanning. Lasers operate in a very limited frequency band. Therefore, a filter was applied in the receiver, allowing only the laser frequency captured by the camera. If the radiation from the illumination source (sunlight or lamp) is stronger than the laser frequency signal, it will pass through the filter and affect the trueness or prevent the measurement from occurring at all. In the ZL condition, the laser beam produced strong illumination, making scanning the soles or surfaces of the feet and hands simple. Scanning difficulties occur in the finger, but the shape of the finger can still be scanned when done slowly.
3.5. Optimal lighting
Table summarizes the best lighting conditions in terms of precision, trueness, and efficiency. In the precision variable, the quantity used as a reference was the average value of (mm), the trueness variable was the average value of AE (mm), and the efficiency variable was the magnitude of the average time(s).
Table 8. Recapitulation of research results
The results of hand 3D measurements show that the ZL lighting condition had the best precision value when compared to NL and RL. The calculation of Sp yielded the smallest value of 1.25 mm, which occurred in the ZL and NL conditions. Based on the minimum and maximum values, the ZL value was still less than the NL, which was 0.73–1.78 mm for the ZL and 0.79–2.10 mm for the NL. Based on the Sp graph, ZL measurement results were closer to 0 than ZL with a gradient value of 0.0219, indicating that the ZL is the best precision for the hand, followed by NL and finally RL. In the foot object, the ZL condition yielded the smallest value, namely 0.92 mm, followed by RL of 1.10 mm and NL of 1.11 mm. The ZL was the best trueness variable on the hand object. Based on the average value of AE, the ZL condition produced the smallest value of 1.73 mm, followed by NL of 1.8 mm and RL of 1.97 mm. On the foot object, the ZL condition yielded the smallest trueness value with an AE value of 1.34, followed by RL of 1.38 and NL of 1.61. In terms of efficiency, the light conditions that produced the shortest average scanning time were RL, which was 232.52 s, followed by ZL of 273.94 s and NL of 294.4 s. In the foot object, RL lighting conditions produced the shortest average time of 268.5 s, followed by ZL of 272, 94 s and RL of 268.5 s.
To determine the best lighting conditions, the multiple criteria decision making (MCDM) method was combined with the simple additive weighting (SAW) method. The SAW method was chosen because it was easy to apply in simple decision choices such as this study. The criteria in this study were trueness, precision, and time. Each weighted 30%, 50%, and 20%. This weighting was obtained from the results of discussions with researchers in the CBIOM3S lab who were more skilled in using 3D scanners. The trueness was given the greatest weight because the most important aspect of the measurement process is that the results provide a value that is close to or equal to the actual value being measured. The 3D scanning of the hands and feet is intended to create custom items such as prosthetic hands and feet or consumables such as gloves and shoes, so the product needs to have the same dimensions as the actual object to fit properly. Precision received a score of 20% because, while not as important as trueness, the similarity of the measurement results between repetitions becomes important if the measurement is repeated. Precision is also an important factor in determining the value of trueness because the actual reliable value in measurement is derived from the average of the results of repeated measurements. Efficiency was given a weight of 20%, the lowest weight among other criteria, because, while a quick scanning process could save time, it did not guarantee that the measurement results would match the original form. If the measurement results are incorrect, the measurement must be repeated.
Each precision, trueness, and efficiency weight was divided by two because the criteria were divided for hand and foot objects so that the weight of the hand precision was 15%, the foot precision was 15%, the hand trueness was 25%, the foot trueness was 25%, and the hand efficiency was 10%, and the foot efficiency was 10%. There were three alternatives, namely ZL, NL, and RL lighting conditions. After giving weight to the criteria, the next step was to create a normalization matrix. The next step was calculating the final value by multiplying the normalized matrix by the weight of the criteria. Table shows the final score with the ranking.
Table 9. Final results of SAW
Based on the results of the SAW method, the optimal lighting condition is Zero Light with a final value of 98.33, followed by RL of 92.46 and NL of 89.7. The ZL condition had the results of multiplying the weight of the criteria with the highest normalization value on the criteria of hand precision, foot precision, hand trueness, and foot trueness, which were 15, 15, 25, and 25. ZL’s hand and foot efficiency, which was 8.49 and 9.84, was second only to RL. The highest RL values for the hands and feet efficiency were 10 and 10. However, for the precision criteria, the hands and feet were ranked third and second, respectively, at 13.69 and 12.55. The RL condition on the criteria for the hands and feet trueness occupied the third and second positions, namely 21.95 and 24.28, respectively. Meanwhile, the NL value on hands and feet precision was ranked second and third, at 15 and 12.43, respectively. On the criteria for the hands and feet trueness, it occupied the second and third positions, namely 24.03 and 20.81, respectively. In the efficiency criteria of the hands and feet, NL was last, occupying the third position with 7.90 and 9.54.
The results of the decision selection using the SAW method showed that the ZL condition with an illumination level of 5–50 Lux was the best lighting condition based on the criteria of precision, trueness, and efficiency on the objects of the hands and feet. These results are in line with previous research (Blanco et al., Citation2008), which concluded that the absence of environmental light gave the best results. The experiment was only carried out by these researchers using a light source with high lighting, namely the effect of light from sunlight, whereas low lighting was not evaluated. In contrast to this study, research (Arakida et al., Citation2018) and (Revilla-León, Subramanian, et al., Citation2020) showed that the RL condition with 500 lux illumination resulted in the highest level of trueness. The results of the said study cannot be compared to those of this study because the types of objects and the technology used were different, namely a special 3D scanning device for teeth rather than a multifunctional 3D scanner such as the EinScan Pro 2X. However, the said study and this study show that high-exposure scans produce poorer trueness than low-exposure scans.
The ZL condition produced the best results on the criteria of hand precision and foot precision. Despite the fact that ZL’s efficiency was not the best, its condition was the second best after RL. Furthermore, while the RL condition had the shortest scanning time efficiency, the level of precision and trueness was not as high as ZL. Inaccurate measurement results might necessitate repeated measurements, which would eventually take longer time. Meanwhile, according to the SAW method results, the NL condition is the worst scanning condition.
4. Conclusion
The average difference in trueness, precision, and efficiency between the three lighting conditions was not significant. However, low lighting conditions (ZL) produced the best results in terms of precision and trueness of the three. The magnitude of the range of data variations to the average measurement results in the ZL condition was 1.25 mm on the hands and 0.92 mm on the feet, the smallest value among the three lighting conditions. The error value of the ZL to KV measurement results shows the smallest difference between the three lighting conditions on the hands and feet objects, namely 1.73 ± 1.33 mm and 1.34 ± 1.20 mm, respectively. The high-level lighting condition, namely RL, showed the highest efficiency level among the three lighting conditions, with the shortest scan time of 232.52 s on the hand and 268.50 s on the foot. The results of the selection decision of the SAW method, ZL lighting conditions are the optimal lighting conditions to perform 3D scanning of the feet and hands based on precision, trueness, and efficiency criteria. The final total score for the ZL condition was 98.33%. This was the highest score when compared to the NL and RL scores of 89.7% and 92.46%, respectively. The ZL condition had the highest trueness and precision scores on the foot and hand objects, while the ZL efficiency criterion was the best after RL. The lighting protocol that must be prepared for the ZL lighting condition was the amount of lighting levels around the object of 5–50 lux, the room windows should be covered with roller blinds to prevent direct sunlight, light sources from computers or other small light sources are permitted but must not exceed the ZL lighting levels, and the light source must not be in direct contact with the laser beam emitting part of the scanner.
Subsequent research can add to the sample’s demographic variation by examining the anthropometric dimensions of the hands and feet on the 3D scanner. Future research could improve hand and foot scanning protocols in humans over pattern paper. The protocol must be able to maintain the position of each respondent’s hands and feet while being scanned repeatedly. Following research can examine the effectiveness of conventional measurements and 3D measurements from the preparation stage to the anthropometric measurement results. The next study can look at the precision and trueness based on contour shape rather than anthropometric dimensions, using deviation analysis and CAD software.
Disclosure statement
No potential conflict of interest was reported by the author(s).
Additional information
Funding
Notes on contributors
Novie Susanto
Novie Susanto is an Assistant Professor of Industrial Engineering Department, Faculty of Engineering, Diponegoro University, Indonesia. She finished a doctoral degree of Industrial Engineering and Ergonomics (Dr. -Ing) from RWTH Aachen, Germany. Her research interests are work system design, ergonomics and human factors.
Manik Mahachandra
Manik Mahachandra is an Assistant Professor of Industrial Engineering Department, Faculty of Engineering, Diponegoro University, Indonesia. She finished a doctoral degree in Industrial Engineering and Management (Dr.) from Bandung Institute of Technology, Indonesia. Her research interests are ergonomics, occupational safety and health, transportation safety, and work organization.
Wiwik Budiawan
Wiwik Budiawan is an Assistant Professor in Industrial Engineering Department, Faculty of Engineering, Diponegoro University, Indonesia. He finished his doctoral study in Toyohashi University of Technology, Japan. His research interests are ergonomics, thermal comfort, and sleep quality.
Ega Rizkiyah
Ega Rizkiyah is a lecturer of Industrial and Systems Engineering, Sepuluh Nopember Institute of Technology. She gained her Bachelor’s and master’s degree in Industrial Engineering and Management, Industrial Engineering Department, Diponegoro University. Her research interests are ergonomics and thermal comfort.
Cintya Dema Apsari
Cintya Dermais a Bachelor’s degree in Industrial Engineering, Industrial Engineering Department, Diponegoro University. Her research interest is in ergonomics.
References
- Arakida, T., Kanazawa, M., Iwaki, M., Suzuki, T., & Minakuchi, S. (2018). Evaluating the influence of ambient light on scanning trueness, precision, and time of intraoral scanner. Journal of Prosthodontic Research, 62(3), 324–23. https://doi.org/10.1016/j.jpor.2017.12.005
- Blanco, D., Fernandez, P., Cuesta, E., & Suarez, C. M. (2008). Influence of ambient light on the quality of laser digitized surfaces. World Congress on Engineering 2008, Vols I-Ii, I. http://gateway.webofknowledge.com/gateway/Gateway.cgiGWVersion=2&SrcAuth=ORCID&SrcApp=OrcidOrg&DestLinkType=FullRecord&DestApp=WOS_CPL&KeyUT=WOS:000259580600006&KeyUID=WOS:000259580600006
- Dharma, I. B., & Nathania, N. A. (2017). David laser scanner for foot anthropometric measurements. Proceedings of the National Seminar on Industrial Engineering and the National Seminar on Integrated Scientific Industrial Engineering, October 4-6, 2017, Malang (pp. 239–243). Industrial Engineering, Brawijaya University.
- Fourie, Z., Damstra, J., Gerrits, P. O., & Ren, Y. (2011). Evaluation of anthropometric accuracy and reliability using different three-dimensional scanning systems. Forensic Science International, 207(1–3), 127–134. https://doi.org/10.1016/j.forsciint.2010.09.018
- Gerbino, S., Del Giudice, D. M., Staiano, G., Lanzotti, A., & Martorelli, M. (2016). On the influence of scanning factors on the laser scanner-based 3D inspection process. The International Journal of Advanced Manufacturing Technology, 84(9–12), 1787–1799. https://doi.org/10.1007/s00170-015-7830-7
- Greiner, T. M. (1991). Hand anthropometry of U.S. ARMY personnel final report (Issue December 1990).
- Griffin, L., Sokolowski, S., Lee, H., Seifert, E., Kim, N., & Carufel, R. (2019). Methods and tools for 3D measurement of hands and feet. Advances in Intelligent Systems & Computing, 790, 49–58. https://doi.org/10.1007/978-3-319-94601-6_7
- Imrhan, S. N., Sarder, M. D., & Mandahawi, N. (2009). Hand anthropometry in Bangladeshis living in America and comparisons with other populations. Ergonomics, 52(8), 987–998. https://doi.org/10.1080/00140130902792478
- Kwon, O., Jung, K., You, H., & Kim, H. E. (2009). Determination of key dimensions for a glove sizing system by analyzing the relationships between hand dimensions. Applied Ergonomics, 40(4), 762–766. https://doi.org/10.1016/j.apergo.2008.07.003
- Lemeš, S., & Zaimović-Uzunović, N. (2009). Study of ambient light influence on laser 3D scanning. 7th International Conference on Industrial Tools and Material Processing Technologies ICIT & MPT, 327–330. http://www.am.unze.ba/papers/327-330.pdf
- Mindarti, R. D., & Dharma, I. B. (2015). Parameter optimization of feet antropoometry measurement system based on 3D scanning using kinect. Gadjah Mada University.
- Pheasant, S., & Haslegrave, C. M. (2005). Bodyspace: Anthropometry, ergonomics and the design of work (3rd ed.). Taylor & Francis. https://books.google.co.id/books?id=nwfvSbuyBdMC
- Price, C., & Nester, C. (2016). Foot dimensions and morphology in healthy weight, overweight and obese males. Clinical Biomechanics, 37, 125–130. https://doi.org/10.1016/j.clinbiomech.2016.07.003
- Revilla-León, M., Jiang, P., Sadeghpour, M., Piedra-Cascón, W., Zandinejad, A., Özcan, M., & Krishnamurthy, V. R. (2020). Intraoral digital scans—Part 1: Influence of ambient scanning light conditions on the accuracy (trueness and precision) of different intraoral scanners. The Journal of Prosthetic Dentistry, 124(3), 372–378. https://doi.org/10.1016/j.prosdent.2019.06.003
- Revilla-León, M., Subramanian, S. G., Özcan, M., & Krishnamurthy, V. R. (2020). Clinical study of the influence of ambient light scanning conditions on the accuracy (Trueness and Precision) of an intraoral scanner. Journal of Prosthodontics, 29(2), 107–113. https://doi.org/10.1111/jopr.13135
- Robinette, K., Blackwell, S., Daanen, H., Boehmer, M., Fleming, S., Brill, T., Hoeferlin, D., & Burnsides, D. (1991). Civilian American and European surface anthropometry resource (Ceasar). SAE International, 5(December), 14–30.
- Spahiu, T., Shehi, E., Galantucci, L., Kaçani, J., & Piperi, E. (2015). 3D low-cost scanning systems for extracting foot dimensions. The 1st SCARDUS International Conference on Education, Science, Technology, Innovation, Health & Environment June 12-13, 2015, 1–10. https://doi.org/10.13140/RG.2.1.4987.0801
- Weinberg, S. M., Scott, N. M., Neiswanger, K., Brandon, C. A., & Marazita, M. L. (2004). Digital three-dimensional photogrammetry: Evaluation of anthropometric precision and accuracy using a Genex 3D camera system. The Cleft Palate-Craniofacial Journal, 41(5), 507–518. https://doi.org/10.1597/03-066.1
- Wibowo, R. K. K., & Soni, P. (2014). Anthropometry and agricultural hand tool design for Javanese and Madurese farmers in East Java, Indonesia. APCBEE procedia, 8(Caas 2013), 119–124. https://doi.org/10.1016/j.apcbee.2014.03.012
- Witana, C. P., Xiong, S., Zhao, J., & Goonetilleke, R. S. (2006). Foot measurements from three-dimensional scans: A comparison and evaluation of different methods. International Journal of Industrial Ergonomics, 36(9), 789–807. https://doi.org/10.1016/j.ergon.2006.06.004
- Yu, A., Yick, K. L., Ng, S. P., & Yip, J. (2013). 2D and 3D anatomical analyses of hand dimensions for custom-made gloves. Applied Ergonomics, 44(3), 381–392. https://doi.org/10.1016/j.apergo.2012.10.001