
 ?Mathematical formulae have been encoded as MathML and are displayed in this HTML version using MathJax in order to improve their display. Uncheck the box to turn MathJax off. This feature requires Javascript. Click on a formula to zoom.
Abstract
This study delves into a comparative analysis of two multi-criteria decision analysis methods, Grey Relational Analysis (GRA) and Technique for Order of Preference by Similarity to Ideal Solution (TOPSIS), to fine-tune sustainable machining parameters for AZ31 magnesium alloy. In the realm of straight cutting, TOPSIS reveals an optimal configuration, featuring a spindle speed of 1000 rpm, a feedrate of 375 mm/s, and a depth of cut at 0.5 mm. Conversely, GRA prescribes a different setup: spindle speed at 1000 rpm, feedrate at 1900 mm/s, and depth of cut at 2 mm. In the context of angular cutting, TOPSIS suggests a spindle speed of 1000 rpm, a feedrate of 375 mm/s, and a depth of cut at 0.5 mm, while GRA advocates a spindle speed of 1100 rpm, a feedrate of 1900 mm/s, and a depth of cut at 0.5 mm. A closer look reveals that the Sustainability Assessment Index (SAI) signals that GRA delivers superior sustainability outcomes across both cutting modes. These findings present invaluable insights into the optimization of sustainable machining processes, providing decision-makers with the tools to select the most appropriate approach for their unique requirements. The horizon of future research could expand to include additional parameters and materials, further enriching the tapestry of sustainable machining practices.
Graphical Abstract
REVIEWING EDITOR:
1. Introduction
Recently, sustainability is being given critical consideration in manufacturing processes. Industries are increasingly recognizing the importance of integrating sustainability principles into their operations to minimize environmental impact, enhance resource efficiency, and fulfill social responsibility. Sustainable manufacturing requires the adoption of appropriate techniques and methodologies to assess and optimize the environmental, economic, and social dimensions of various processes. In this context, Multiple Criteria Decision-Making (MCDM) techniques have emerged as valuable tools for evaluating the sustainability performance of manufacturing processes.
This study is focused on the milling operations of magnesium alloy (AZ31) material. The milling operations are essential process in various industries such as aerospace, automotive, and electronics. Milling involves the removal of material to shape components. The efficiency of milling operations and their sustainability play a vital role in achieving desirable outcomes. In order to assess the sustainability of milling operations, the most crucial step is the selection of an appropriate MCDM technique which will eventually help in process optimization.
Two widely used MCDM techniques, namely GRA and TOPSIS, are well-known for their effectiveness in sustainability assessment. GRA provides a quantitative measure of the degree of correlation between the evaluation object and the reference object, enabling the identification of optimal process parameters. On the other hand, TOPSIS ranks alternatives based on their similarity to the ideal and dissimilarity to the negative ideal, offering a comprehensive evaluation of process performance.
The novelty of this study lies in its comprehensive comparison of two powerful multi-criteria decision analysis techniques, Grey Relational Analysis (GRA) and the Technique for Order of Preference by Similarity to Ideal Solution (TOPSIS), for optimizing sustainable machining parameters in the context of AZ31 magnesium alloy. By systematically evaluating these techniques across multiple cutting modes and introducing the novel concept of a Sustainability Assessment Index (SAI), this research not only provides valuable insights for machining optimization but also offers a groundbreaking approach for decision-makers to select the most sustainable solutions. This study introduces a novel amalgamation of GRA and TOPSIS results, setting the stage for future investigations to harness the strengths of various multi-criteria decision-making techniques, incorporate additional parameters, and explore advanced sensor technologies and data analytics to elevate the sustainability and efficiency of machining processes in diverse manufacturing applications.
In the following sections, a comprehensive literature review is provided on manufacturing sustainability assessment, MCDM techniques, and previous studies on GRA and TOPSIS in manufacturing processes. This is followed by the research methodology, including the research design, data collection, and the application of GRA and TOPSIS techniques. The case study on milling operations of magnesium material is presented, followed by a detailed analysis on the results using both the aforementioned MCDM techniques. Finally, the findings are discussed, conclusions drawn, and potential avenues for future research suggested.
1.1. Background study
MCDM techniques, such as GRA and TOPSIS, are widely used in manufacturing sustainability assessment. These techniques aid in evaluating the sustainability performance of manufacturing processes, considering factors such as resource utilization, environmental impact, and economic viability. Comparative analysis of MCDM techniques is crucial to identify their strengths and limitations in assessing manufacturing sustainability. Several studies have highlighted the need for such comparative analysis to enhance the understanding and applicability of these techniques.
Zhong et al. (Citation2021) presented a thorough assessment model based on GRA-TOPSIS to evaluate hydrogen generation technologies in the context of the coal industry’s efforts to achieve sustainable development. Their analysis effectively demonstrated the directing function that GRA-TOPSIS performed in supporting the technology selection process for coal firms, highlighting the critical significance that comparative analysis plays in adjusting the technique choice to particular contexts. Hegab et al. (Citation2023) discussed the significance of comparative analysis in MCDM techniques through the integration of GRA, TOPSIS, and Multiple Objective Optimization on the Basis of Ratio Analysis (MOORA) for optimizing sustainable manufacturing. Their research challenged fundamental assumptions and conventional approaches, shedding light on the limitations of certain techniques and advocating for an enhanced comparative analysis framework.
Kumar & Singh (Citation2023) enriched the field of comparative analysis by employing GRA and TOPSIS in conjunction with Principal Component Analysis (PCA) to optimize drilling parameters. Their study accentuated the efficacy of these techniques in realizing sustainable machining practices and underscored the paramount importance of comparative analysis in choosing the most suitable technique for specific machining scenarios. Gulishengmu et al. (Citation2023) applied GRA-TOPSIS to evaluate the water resource carrying capacity in an oasis city, contributing to sustainable development in arid regions. Their study accentuated the importance of comparative analysis in the assessment and comparison of sustainability performance among diverse regions, thereby equipping policymakers to make informed decisions. Ikram et al. (Citation2020) investigated the relationship between renewable energy consumption, access to electricity, agriculture, and CO2 emissions in SAARC countries. By employing GRA and TOPSIS methodologies, they conduct a comparative analysis to prioritize factors impacting CO2 emissions, enabling organizations and policymakers to make data-driven decisions for sustainable practices.
The inclusion of additional studies further contributes to the understanding of the importance of comparative analysis in MCDM techniques and manufacturing sustainability assessment.
Jamwal et al. (Citation2021) presented a systematic framework that integrates GRA, TOPSIS, and Analytic Hierarchy Process (AHP) for sustainable manufacturing assessment in the automotive industry. Their study emphasizes the need for comparative analysis to evaluate and select the most appropriate MCDM technique for sustainable manufacturing. Saad et al. (Citation2019) proposed a hybrid methodology combining GRA and TOPSIS with a modified Analytic Network Process (ANP) for sustainability assessment of manufacturing processes and materials in the construction industry. Their study highlights the need for comparative analysis to assess and compare different methodologies, enhancing the robustness and reliability of sustainability assessments.
Rampasso et al. (Citation2022) investigated the sustainability assessment of machining processes using GRA and TOPSIS, emphasizing the importance of comparative analysis to select the most suitable technique for sustainable machining process evaluation and optimization. Natarajan et al. (Citation2023) propose a novel approach using GRA and TOPSIS for sustainable manufacturing assessment in printed circuit board assembly. Their study underscores the significance of comparative analysis to evaluate and compare different MCDM techniques in specific manufacturing domains (Natarajan et al., Citation2023). (Akhoundi & Modanloo, Citation2023) presented a sustainability assessment framework for additive manufacturing processes using GRA and TOPSIS, demonstrating the importance of comparative analysis to evaluate and select the most appropriate technique for sustainable additive manufacturing.
Most of the referenced literature in this study placed emphasis on the importance of comparative analysis in selecting appropriate MCDM techniques and evaluating manufacturing sustainability. While numerous studies have applied GRA and TOPSIS in manufacturing sustainability assessment, there is still room for research in the comparative analysis of these techniques using sustainability metrics.
2. Materials and methods
2.1. Experimental design
The experiment was designed using the Taguchi orthogonal array method, considering the unique properties of magnesium alloys and the need for appropriate working conditions to ensure safe and efficient machining. Magnesium alloys are known for their flammability, making it crucial to select optimal machining parameters that balance surface quality, economic viability, and environmental compatibility. To determine the minimum and maximum machining parameters for milling magnesium alloys, relevant literature was reviewed, and the values were compiled in .
Table 1. Standard milling parameter to machine AZ31 magnesium alloy (Jamie, Citationn.d.; Lu et al., Citation2016).
The milling process for magnesium alloys focuses on three key machining parameters: depth of cut, spindle speed, and feed rate. These parameters significantly influence economic feasibility, and environmental impact. To investigate the effect of these parameters, each parameter was assigned 5 levels in the experimental design.
To reduce the number of experiments and associated costs, the L25 Taguchi orthogonal array was selected as the optimized experimental design as shown in . Conducting a full factorial design would have required 125 experiments for each cutting mode, making it prohibitively expensive. By using the L25 orthogonal array, a total of 50 experiments were designed, with 25 experiments for each cutting mode. The levels of the machining parameters were then fitted into the L25 orthogonal array, as shown in .
Table 2. L25 Orthogonal array (Essa et al., Citation2022).
Table 3. Experimental design.
Two cutting modes were considered in the experiment: linear and angular. These modes were chosen to evaluate the influence of different cutting approaches on the milling process of magnesium alloys. By incorporating both cutting modes in the experimental design, a comprehensive analysis of the machining parameters’ effects on economic viability, and environmental compatibility could be conducted.
By implementing the Taguchi orthogonal array and incorporating the selected machining parameters and cutting modes, the experiment aimed to find the optimal balance of machining parameters for milling magnesium alloys. This approach allows manufacturers to produce magnesium-based products that are economically viable and environmentally friendly while ensuring the surface quality of the final product. The experimental design facilitated a systematic evaluation of the milling process while minimizing the number of experiments and associated costs.
2.2. Indicator identification
To assess the economical and environmental sustainability of the milling process for magnesium alloy, several indicators (responses) were identified. These indicators were chosen to capture key aspects of the process that directly impact cost-effectiveness and environmental performance. The following indicators were selected for optimization:
2.2.1. Economic indicators
2.2.1.1. Energy consumption (E)
Energy consumption is a vital economic indicator in milling processes, impacting production costs (Bashir et al., Citation2021). Optimizing energy consumption is crucial for achieving economic sustainability (Xu et al., Citation2020). By minimizing energy usage through efficient techniques and equipment, manufacturers can reduce costs and improve financial performance. Additionally, reducing energy consumption contributes to environmental sustainability by lowering carbon emissions and ecological impact. Balancing cost-effectiveness with sustainable practices is key to achieving both economic and environmental sustainability in milling operations.
2.2.1.2. Machining cost (Cm)
The machining cost of a process refers to the cost associated with using a machine for manufacturing, such as milling. It comprises two main components: energy consumption and machine cost/machine life. The amount of energy needed to operate the machine, which can include electricity, fuel, or other power sources, encompasses energy consumption. Machine cost/machine life pertains to the initial purchase cost of the machine and its expected lifespan.
Reducing machining cost is vital for achieving economic sustainability in the long term and ensuring financial stability and profitability for manufacturing companies. By optimizing machining parameters to minimize energy consumption and extend machine life, companies can decrease overall operating costs and enhance their financial performance. Additionally, adopting eco-friendly machining processes with lower environmental impacts contributes to the overall sustainability of the manufacturing process. To calculate the machining cost, the following equations can be used:
(1)
(1)
Here, Cm represents the machining cost, Cmc is the machine cost per unit machine life span, and Celec is the electricity consumption cost.
(2)
(2)
Cmc represents the machine cost per unit machine life span, where Machine Cost refers to the initial purchase cost of the machine, Machine tool life denotes the expected lifespan of the machine, and PT represents the processing time.
(3)
(3)
Celec represents the electricity consumption cost, where Electricity cost per kWh represents the cost of electricity per unit, and E refers to the energy consumption during the machining process.
By considering both energy consumption and machine cost/machine life in the optimization of machining parameters, manufacturers can achieve a balance between economic and environmental sustainability in their manufacturing processes.
2.2.1.3. Hardness (H)
Measuring hardness in the milling process is crucial for assessing material quality and performance. Techniques such as Rockwell, Vickers, and Brinell tests are commonly used to determine hardness by measuring the depth or dimensions of impressions made on the material’s surface. Hardness measurements provide valuable insights into material properties and help optimize milling conditions for desired outcomes.
Milling can significantly impact the hardness of a material (Lu et al., Citation2019, p. 718; Witharamage et al., Citation2021). One key mechanism is work hardening, which occurs primarily in metals. As the cutting tool shears the material, it undergoes plastic deformation, causing the surface grains to be compressed and creating dislocations within the crystal lattice. This increased dislocation density results in an enhancement of the material’s hardness. Heat generation during milling can also influence hardness (Ogedengbe et al., Citation2019; Shokrani et al., Citation2019), potentially causing localized changes in material properties.
2.2.1.4. Vibration amplitude (V)
Measuring vibration in the milling process is essential for evaluating the stability and performance of the machining operation (Pimenov et al., Citation2022). Vibration sensors, such as accelerometers or piezoelectric sensors, are commonly used to detect and quantify vibrations during milling. These sensors can capture the amplitude, frequency, and direction of vibrations, providing valuable information about the dynamic behavior of the milling machine and the workpiece. Measuring vibration helps identify potential issues such as tool chatter, imbalance, or excessive cutting forces, which can lead to poor surface finish, tool wear, or machine damage. By monitoring and analyzing vibration patterns, operators can optimize cutting parameters, tooling, and machine setups to minimize vibrations and improve the overall quality and efficiency of the milling process.
2.2.1.5. Material removal rate (MRR)
The material removal rate refers to the amount of material removed per unit of time. Maximizing MRR is desirable as it leads to higher productivity and reduced machining time, contributing to economic efficiency. To calculate the MRR, the following equation can be used:
(4)
(4)
2.2.2. Environmental indicators
2.2.2.1. Carbon emission (CE)
Reducing carbon emissions is crucial for environmental sustainability in manufacturing. Using low-carbon intensity materials and reducing electricity consumption can minimize the carbon footprint. Optimal milling parameters and energy-efficient machines help decrease power consumption and carbon emissions. The carbon emission (CE) can be calculated using equations:
(5)
(5)
(6)
(6)
Here, CE represents carbon emissions, CEelec denotes emissions from energy consumption, CEmaterial refers to emissions from the carbon content of the material. CEFelec represents the carbon emission factor based on the energy source, and E indicates the energy consumption during the milling process. The specific values for CEFelec in Pakistan are 0.4733 KgCO2/KWh (Siddiqui, Citation2017), and for magnesium alloy, CEmaterial is 12.5 KgCO2/Kg (2020 Life Cycle Assessment (LCA), Citationn.d.).
2.2.2.2. Cutting temperature (T)
Cutting temperature affects tool life (Özbek & Saruhan, Citation2020), surface integrity (Yıldırım et al., Citation2019, p. 625), and energy consumption (Salur et al., Citation2021). Lower cutting temperatures reduce tool wear, energy consumption, and environmental impact.
2.2.2.3. Specific energy consumption (SEC)
Specific Energy Consumption (SEC) is a measure of the energy efficiency during the machining process, indicating the amount of energy required to remove a unit of material. By reducing the SEC, environmental sustainability can be achieved through minimized energy consumption and lower carbon emissions. The SEC can be calculated using the equation:
(7)
(7)
Here, E represents the energy consumption during the machining process, and V(material removed) is the volume of material that is removed during the process. By optimizing the machining parameters and minimizing the energy required for material removal, the SEC can be reduced, leading to a more energy-efficient and environmentally sustainable manufacturing process.
2.2.2.4. Energy utilization ratio (U)
The energy utilization ratio measures the efficiency of energy usage during the milling process. A higher energy utilization ratio indicates a more efficient utilization of energy, where a larger proportion is effectively used for cutting and a smaller proportion is wasted. By optimizing the energy utilization ratio, the overall energy consumption in the milling process can be reduced, leading to environmental sustainability through the mitigation of greenhouse gas emissions and other forms of pollution associated with energy production and usage. The energy utilization ratio can be calculated using the equation:
(8)
(8)
Here, SEC represents the specific energy consumption, which is the amount of energy required to remove a unit of material, and E denotes the total energy consumed during the milling process. By maximizing the energy utilization ratio, manufacturers can achieve higher energy efficiency and contribute to a more sustainable manufacturing process.
2.3. Experimental Setup
The milling experiment was conducted on a KX1S Siege CNC 3-axis milling machine, which is specifically designed for precision milling operations. The milling machine offers high rigidity, accuracy, and stability, making it suitable for machining various materials, including magnesium alloys. The specifications of the milling machine used in this study are presented in the () below:
Table 4. KX1S siege CNC milling machine specifications (Hasanzadeh et al., Citation2023).
The milling experiment centered on AZ31 magnesium alloy, a widely recognized magnesium alloy valued for its excellent machinability and mechanical properties. The specimen had dimensions of 100 mm x 100 mm x 100 mm, providing an adequate material volume for the milling process.
A combination of direct and indirect measuring techniques was employed to accurately monitor and evaluate the identified indicators. Direct indicators, such as energy consumption, hardness, and cutting temperature, were measured in real-time using sensors, while indirect indicators like material removal rate, carbon emissions, and specific energy consumption were calculated using empirical relations.
For temperature detection, an AMG8833 thermal imaging camera was utilized. This high-resolution camera allowed for precise monitoring of the cutting temperature during the milling process, providing valuable insights into the thermal behavior of the magnesium alloy. The hardness of the machined specimens was determined using a gunt W300 Universal Material Testing (UMT) machine, measured on the Brinell scale. This instrument provided quantitative data on the hardness, allowing for the assessment of surface quality and the optimization of milling parameters. To monitor energy consumption, voltage, and current, sensors such as ZMPT101B and ACS712 were employed. These sensors enabled the measurement of power input to the milling machine, allowing for the calculation of energy consumption during the milling operation. Vibration was also considered as a crucial parameter in the milling experiment. Vibration levels during the milling process can provide valuable insights into the stability and performance of the machining operation. To measure and analyze vibration, an MPU6050 accelerometer was employed.
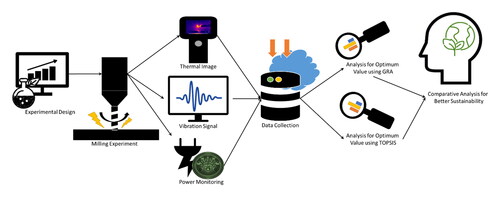
The use of direct indicators facilitated real-time monitoring and accurate measurement of crucial parameters, enabling comprehensive analysis of the milling process. Additionally, indirect indicators were calculated using established empirical relationships as mentioned in Sections 2.2.1 and 2.2.2. By employing a combination of direct and indirect sensing techniques, the experimental setup provided a robust platform for gathering precise data on energy consumption, surface finish, and cutting temperature during the milling operation. This comprehensive dataset facilitated a detailed analysis of the milling process and supported the evaluation of its economic and environmental sustainability. The illustrative representation of process flow and experimental setup can be seen in and , respectively.
Figure 1. Experimental setup.

2.4. GRA
GRA is a decision-making method that combines the principles of grey system theory and relational analysis. It provides a systematic approach to decision-making in situations where limited and uncertain information is available. GRA is particularly useful when dealing with complex decision problems that involve multiple criteria and incomplete or unreliable data.
In traditional decision-making methods, such as relational analysis, precise and complete information is assumed. However, in real-world scenarios, decision-makers often face uncertainties, vagueness, and incomplete information. Grey system theory, on the other hand, is specifically designed to handle such situations by considering both known and unknown information. GRA integrates grey system theory with relational analysis to provide a comprehensive framework for decision-making. It incorporates the principles of similarity and proximity to assess the relative performance of alternatives based on available information. GRA allows decision-makers to evaluate and rank alternatives by considering their performance on multiple criteria and their similarity to reference sequences or ideal solutions.
The main advantage of GRA is its ability to handle uncertainty and limited information effectively. It allows decision-makers to make informed decisions even when data is incomplete or imprecise. By considering the relative performance of alternatives and their proximity to reference sequences, GRA provides a practical and reliable approach to decision-making. GRA has been successfully applied in various fields, including engineering (Ajay et al., Citation2022; Department of Mechanical Engineering, Birla Institute of Technology, India et al., 2022; Kumar et al., Citation2022; Perumal et al., Citation2022; Wen et al., Citation2023), finance (Erdemi̇r & Kirkağaç, 2022; Malinda & Chen, Citation2022; Silva et al., Citation2023; Wang, Citation2022), management (Esangbedo et al., Citation2024; Minguito & Banluta, Citation2023; Ouali, Citation2022; Pandey et al., Citation2022), and environmental studies (Abid et al., Citation2022; Gul et al., Citation2022; Tao et al., Citation2022; Wang et al., Citation2022b; Xie et al., Citation2022). It offers a flexible and adaptive methodology that can accommodate different types of decision problems and data characteristics. By utilizing GRA, decision-makers can overcome the challenges posed by uncertainties and make well-informed decisions in complex and dynamic environments.
To apply GRA on a dataset, the following steps are followed:
Normalization of Data:
The first step is to normalize the data using the following equation:
(9)
(9)
(10)
(10)
This equation is used for criteria with a ‘smaller-the-better’ and ‘larger-the better’ preference.
Calculation of Deviation Sequence:
After normalization, the deviation sequence is calculated to measure the difference between each alternative and the ideal solution.
Calculation of Grey Coefficient:
The grey coefficient is computed using the following equation:
(11)
(11)
The grey relational coefficient is employed to evaluate the similarity between xij and xoj, where a higher coefficient indicates a closer resemblance. The coefficient can be calculated using (11), where ξ represents the distinguishing coefficient ranging from 0 to 1. In this study, ξ is assumed to be 0.5, reflecting a moderate level of distinguishability. A lower value of ξ indicates a greater level of distinguishability between the compared values.
Calculation of Grey Grade:
Finally, the grey grade is calculated using the equation:
(12)
(12)
The grey relational grade is a metric utilized to quantify the similarity between a comparability sequence and a reference sequence in the grey relational space. It is calculated as a weighted sum of grey relational coefficients, indicating the level of closeness between the sequences. The grey relational grade is determined using (12), where n represents the number of responses and wj denotes the weight assigned to each response. By following these steps, GRA facilitates decision-making by evaluating alternatives based on their proximity to the ideal solution and considering the weights assigned to each criterion.
2.5. TOPSIS
TOPSIS is a multi-criteria decision-making method developed to aid in the selection and ranking of alternatives based on multiple criteria. It was originally proposed by Ching-Lai Hwang and Yoon in 1981 and has since gained popularity due to its simplicity and effectiveness in handling complex decision problems.
In various decision-making scenarios, such as project selection, supplier evaluation, and product ranking, multiple criteria need to be considered simultaneously. The TOPSIS method provides a systematic approach to evaluate and compare alternatives based on their performance across these criteria. The goal is to identify the alternative that is closest to the ideal solution and farthest from the negative ideal solution. The TOPSIS method involves a series of steps that include normalization of the evaluation matrix, determination of the weighted normalized decision matrix, calculation of the distance from each alternative to the ideal and negative ideal solutions, and finally, ranking the alternatives based on their similarity to the ideal solution.
One of the key advantages of TOPSIS is its ability to handle both quantitative and qualitative criteria. By converting the criteria into a numerical scale, it allows for a comprehensive comparison and ranking of alternatives based on different types of criteria. Furthermore, TOPSIS incorporates the concept of trade-offs between criteria, providing a flexible decision framework that allows decision-makers to consider the relative importance of each criterion. The application of TOPSIS has been widely used in various fields, including engineering (Rani & Kaushal, Citation2022; Wang et al., Citation2022b; Zhang et al., Citation2023), management (Awodi et al., Citation2023; Bao et al., Citation2022; Demircan & Yetilmezsoy, Citation2023; Fares & Lloret, Citation2022; Li et al., Citation2023; Piya et al., Citation2022; Saeidi et al., Citation2022), finance (Gayathri et al., Citation2022; Li et al., Citation2022; Liew et al., Citation2022; Nayman Hamamci & Karkacier, Citation2022), and environmental studies (Afzali Behbahani et al., Citation2022; Asadabadi et al., Citation2023; Damle & Krishnamoorthy, Citation2022; Hasanzadeh et al., Citation2023; Riaz et al., Citation2022). Its effectiveness and versatility have made it a valuable tool in decision-making processes, assisting decision-makers in making informed choices by considering multiple criteria simultaneously.
To apply TOPSIS on a dataset, the following steps are followed:
Normalization of Data:
The first step is to normalize the data using the following equation:
(13)
(13)
Calculate the ideal best and ideal worst solution
The ideal best (V+) and ideal worst (V-) solutions are determined by identifying the minimum and maximum values for each criterion, respectively. For criteria where smaller values are preferred (e.g. cost), the minimum values will be the ideal best, and for criteria where larger values are preferred (e.g. performance), the maximum values will be the ideal best.
Euclidean distance from the ideal best and ideal worst:
The Euclidean distance from the ideal best (Si+) and ideal worst (Si-) solutions is calculated using (14)and (15) respectively. These distances represent the geometric distances between each alternative and the ideal solutions.
(14)
(14)
(15)
(15)
Calculation the performance score:
Finally, the performance score (Pi) is calculated using Equation(16)(16)
(16) . It measures the relative proximity of each alternative to the ideal solutions. A higher score indicates a better performance.
(16)
(16)
By following these steps, the TOPSIS method provides a systematic approach to rank and select the most suitable alternative from a dataset based on multiple criteria. It allows decision-makers to consider both the relative importance of criteria and the performance of alternatives, aiding in informed decision-making processes.
2.6. Sustainability Assessment Index
The result obtained from the TOPSIS and GRA methods can be compared using a sustainability assessment model that takes into account the economic and environmental aspects of the optimized responses/indicators. The performance of each indicator can be calculated using (17) and (18), and the overall sustainability assessment index (SAI) can be obtained by summing up the economic sustainability assessment (ESA) and the environmental sustainability assessment (EnSA) using (19). The graphical representation of this assessment can be seen in .
Figure 2. Process flow for Study.

Economic sustainability assessment (ESA) is calculated by multiplying the weight of each economic indicator with its normalized value and summing up these values. This assessment represents the economic performance of the system or process as shown in Equation(17)(17)
(17) .
(17)
(17)
Environmental sustainability assessment (EnSA) is calculated by multiplying the weight of each environmental indicator with its normalized value and summing up these values. This assessment represents the environmental performance of the system or process as shown in Equation(18)(18)
(18) .
(18)
(18)
Finally, Equation(19)(19)
(19) combines the economic and environmental sustainability assessments to obtain the overall sustainability assessment index (SAI). This index represents the combined performance of the system or process in both economic and environmental dimensions.
(19)
(19)
By using this sustainability assessment model, decision-makers can evaluate and compare the performance of different optimization methods (TOPSIS and GRA) based on their economic and environmental impacts.
3. Observations and analysis
The observation and analysis section of this study aims to analyze the results obtained from applying the TOPSIS and GRA methods to the dataset. It involves examining the performance of different indicators, assessing their economic and environmental sustainability, and comparing the outcomes of the two-optimization techniques. The experimental data for this study is presented in .
Table 5. Experimental data.
In addition to the experimental data, the constants used to determine the values of indirect indicators in the study are shown below. These constants play a significant role in calculating the performance of these indicators and are essential for a comprehensive assessment of the economic and environmental sustainability of the milling process.
The constants used in the study are as follows:
Machine cost: The cost of the milling machine used in the experiment is 1,500,000 PKR (Pakistani Rupees).
Machine tool life: The expected lifespan of the milling machine is 473,587,500 seconds.
Electricity cost per KWh: The cost of electricity per kilowatt-hour (KWh) is 30.25 PKR.
Furthermore, the width of the cut during the milling process is 10 mm. This parameter plays a crucial role in determining the machining performance and surface quality of the final product.
The study also considers two constants related to environmental sustainability:
Carbon Emission Factor (CEF): The carbon emission factor associated with electricity generation is 0.4733 KgCO2/KWh.
Carbon Emission from material CE(material): The carbon emission factor associated with the carbon content of the material is 12.5 KgCO2/Kg.
Lastly, the area of the material being machined is 100 mm2, which provides a reference for evaluating the material removal rate and other machining parameters. These experimental data and constants provide the necessary information for the subsequent analysis and assessment of the economic and environmental performance of the milling process in the study.
3.1. Analysis of GRA
In the application of GRA, the first step involves normalizing the dataset. This normalization process is carried out based on two criteria: ‘smaller the better’ and ‘larger the better’. In the dataset, the following parameters need to be minimized for better sustainability: V (vibration), E (energy consumption), T (temperature), PT (processing time), Cm (machining cost), and CE (carbon emission). On the other hand, the parameters MRR (material removal rate), H (hardness), SEC (specific energy consumption), and U (energy utilization ratio) need to be maximized for better sustainability. Therefore, (9) and (10) are utilized for normalization. The results are presented in .
Table 6. GRA normalized values.
The normalized values are then used to calculate the deviation coefficients by subtracting the normalized value from the ideal value, which in this case is 1, indicating maximum closeness to the desired solution. The deviation coefficients are further utilized to calculate the grey coefficient (GRC) using (11). To apply this equation, we consider the maximum value as 1, the minimum value as 0, and the median value as 0.5 since the values are already normalized. Finally, the grey relational grade is calculated using (12). The weight of the indicators are kept at 1 to reflect equal importance of every factor. The results are shown in .
Table 7. GRA rank.
Based on the ranking of the grey relational grade, it is determined that the machining parameters of spindle speed = 1000 rpm, feedrate = 1900 mm/s, and depth of cut = 2 mm result in the best combination for straight cutting. Whereas, spindle speed = 1100 rpm, feedrate = 1900 mm/s, and depth of cut = 0.5 mm result in the best combination for angular cutting. Implementing these parameters in the milling process can lead to improved cost efficiency and surface quality and reduced environmental impact as per GRA.
3.2. Analysis of TOPSIS
TOPSIS is a powerful multi-criteria decision analysis method used to identify the most favorable alternatives from a set of options based on their similarity to the ideal solution. In this study, TOPSIS is applied to a dataset representing various responses or indicators in the context of a milling process. The dataset comprises multiple criteria, some of which are considered to be ‘larger the better’ and others as ‘smaller the better’ criteria.
The first step in applying TOPSIS is to normalize the data using (13). Normalization is essential as it converts different criteria with disparate scales into a common range, allowing for a fair comparison. The normalized values are shown in , providing an overview of the data in a standardized format.
Table 8. TOPSIS normalized values.
Once the dataset is normalized, the analysis proceeds to identify the ideal best (V+) and ideal worst (V-) values for each response based on the criteria. For indicators with ‘larger the better’ criteria, such as Material Removal Rate (MRR), Hardness (H), Specific Energy Consumption (SEC), and Energy Utilization Ratio (U), the maximum value among the normalized dataset is considered the ideal best, while the minimum value is considered the ideal worst. Conversely, for indicators with ‘smaller the better’ criteria, like Vibration (V), Energy Consumption (E), cutting Temperature (T), Processing Time (PT), Machine Cost (Cm), and Carbon Emission (Ce), the minimum values are considered the ideal best, and the maximum values are considered the ideal worst.
Using the ideal best and ideal worst values, the Euclidean distance from the current point to the ideal best (Si+) and ideal worst (Si-) is calculated using (14) and (15) respectively. The Euclidean distance measures the similarity between the current solution and the ideal solutions, reflecting how closely they align with the desired objectives.
Finally, the performance score (Pi) for each alternative is calculated using (16). The performance score quantifies the relative closeness of each solution to the ideal solutions. The alternatives are then ranked based on their Pi values, which helps identify the best-performing solutions as shown in .
Table 9. TOPSIS rank.
The TOPSIS analysis has revealed that the most suitable machining parameters for both straight and angular cutting modes are spindle speed of 1000 rpm, feedrate of 375 mm/s, and depth of cut of 0.5 mm. These parameters have achieved the highest performance scores, indicating their close proximity to the ideal solutions in terms of economic and environmental sustainability. By adopting these optimal parameters, manufacturers can improve product quality, reduce manufacturing costs, and minimize environmental impact, leading to more efficient and eco-friendly milling operations
4. Results and discussion
The results obtained from both GRA and TOPSIS analyses have provided valuable insights into selecting the optimal machining parameters for both straight and angular cutting modes. By comparing the top-ranked solutions from both techniques, the study aims to determine which approach yields the most sustainable solution.
In the case of straight cutting mode, there was a slight deviation in the rankings between the two techniques. The solution ranked #1 by GRA was ranked #3 by TOPSIS, while the solution ranked #1 by TOPSIS was ranked #2 by GRA. This difference in rankings indicates that the two techniques may consider certain criteria differently, leading to variations in the final rankings. The rank comparison can be seen in .
Figure 3. Rank Comparison of both techniques (Straight Cutting).

Figure 4. Rank Comparison of both techniques (Angular Cutting).

Similarly, in the case of angular cutting, there was a slight deviation in the rankings of the top-ranked solutions between GRA and TOPSIS. The solution ranked #1 by GRA was ranked #4 by TOPSIS, and the solution ranked #1 by TOPSIS was ranked #2 by GRA.
To identify the most sustainable solution, the study employed the Sustainability Assessment Index (SAI) by calculating ESA and EnSA for both top-ranked solutions using (17) and (18), respectively using the normalized values from and . ESA is calculated by considering the criteria of reduced cost and better surface area. The economic sustainability is improved by minimizing energy consumption (E), processing time (PT), and machining cost (CM), and maximizing the material removal rate (MRR). Furthermore, improving the surface quality by minimizing vibration (V) and maximizing hardness (H) also contributes to economic sustainability.
On the other hand, EnSA is calculated by considering the criterion of reducing greenhouse gas emissions. The factors taken into account for EnSA calculation are energy consumption (E), carbon emission (CE), and energy utilization ratio (U). By minimizing energy consumption (E), carbon emission (CE), and maximizing the energy utilization ratio (U), the environmental footprint is reduced, leading to improved environmental sustainability.
It is important to note that in this study, all the indicators are given equal importance, and therefore, the weight of the indicators is kept at 1. This ensures a balanced assessment of both economic and environmental sustainability aspects. By considering all indicators equally, the methodology provides a comprehensive evaluation of the overall sustainability performance of the milling process.
The results, shown in , revealed that for straight cutting, the SAI for the solution obtained from GRA was 7.06, whereas for TOPSIS, it was 3.7. This indicates that the solution suggested by GRA is more sustainable than the one from TOPSIS.
Table 10. SAI values.
Similarly, for angular cutting, the SAI for the top-ranked solution from GRA was 7.87, while for TOPSIS, it was 3.87. Once again, this indicates that in terms of angular cutting, GRA yielded better sustainability results.
The novel approach of utilizing both GRA and TOPSIS analyses has proven beneficial in identifying sustainable solutions for both cutting modes. The final specimen for both cutting modes can be seen in . By integrating multiple perspectives and criteria, manufacturers can make well-informed decisions that optimize their processes, reduce costs, and minimize environmental impact.
Figure 5. Sample specimens (straight and angular cutting).

5. Conclusion and future directions
In this investigation, the GRA and TOPSIS methodologies were harnessed to fine-tune machining parameters for AZ31 magnesium alloys, focusing on both straight and angular cutting modes. The empirical data were diligently gathered and subjected to normalization through suitable mathematical transformations, thereby facilitating the delineation of ideal best and ideal worst solutions grounded in the ‘smaller-the-better’ and ‘larger-the-better’ criteria.
The empirical findings unveiled that TOPSIS recommended, for both cutting modes, a spindle speed set at 1000 rpm, a feedrate of 375 mm/s, and a depth of cut at 0.5 mm. In contrast, GRA prescribed alternative configurations: for straight cutting, a spindle speed of 1000 rpm, a feedrate of 1900 mm/s, and a depth of cut at 2 mm; and for angular cutting, a spindle speed of 1100 rpm, a feedrate of 1900 mm/s, and a depth of cut at 0.5 mm.
To gauge the sustainability of these top-ranked solutions, the Sustainability Assessment Index (SAI) was employed. The results showed that, in the realm of straight and angular cutting, GRA exhibited significantly superior sustainability outcomes in comparison to TOPSIS. This innovative amalgamation of GRA and TOPSIS not only provides users with a toolkit to cherry-pick the most sustainable solutions from divergent methodologies but also ushers in promising horizons for prospective research endeavors in the realm of sustainable manufacturing. The future trajectory could explore the deployment of alternative multi-criteria decision-making techniques to fortify the accuracy and resilience of the optimization process.
Furthermore, the integration of additional parameters, such as vibration and hardness, promises a more holistic evaluation of the sustainability of machining processes. The advent of cutting-edge sensor technology and advanced data analytics can elevate the precision and timeliness of data collection and analysis, enabling dynamic parameter optimization in response to fluctuating operational conditions and environmental variables.
Expanding the purview of this research to encompass an array of materials and machining operations will furnish a more comprehensive understanding of sustainability in the manufacturing domain. Investigating the influence of different cutting tool materials and coatings on sustainability holds the potential to unearth valuable insights that can further steer sustainable manufacturing practices towards the zenith of efficiency and ecological responsibility.
Disclosure statement
No potential conflict of interest was reported by the author(s).
Additional information
Funding
Notes on contributors

M. Atif Saeed
Muhammad Atif is currently a PhD student in the field of Computer Science at SZABIST University. He also holds the position of Assistant Professor at the same institution. His research interests encompass a variety of topics including mechanical design, optimal machining, renewable energy, embedded systems, and automation.
Faraz Junejo
Faraz Junejo obtained his PhD (Mechatronics) degree from Loughborough University, UK. He is currently working as Professor in Mechatronics Engineering Department at SZABIST, Karachi. His research interests include Machine Vision, Renewable Energy, Condition monitoring, Robotics and Engineering Mechanics. He is an active member of Higher Education Commission’s National Curriculum review committee for both Mechatronics and Mechanical Engineering.
Imran Amin
Imran Amin is an Professor and Head of Department at SZABIST Institute in Karachi. He has served as the Head for Center of Renewable Energy and Research from 2009 to 2012.
References
- Abid, N., Ceci, F., & Ikram, M. (2022). Green growth and sustainable development: Dynamic linkage between technological innovation, ISO 14001, and environmental challenges. Environmental Science and Pollution Research International, 29(17), 25428–25447. https://doi.org/10.1007/s11356-021-17518-y
- Afzali Behbahani, N., KhodadadiKarimvand, M., & Ahmadi, A. (2022). Environmental risk assessment using FMEA and entropy based on TOPSIS method: A case study oil wells drilling. Big Data and Computing Visions, 2(1), 31–39. https://doi.org/10.22105/bdcv.2022.331778.1054
- Ajay, C. V., Elangovan, S., Pratheesh Kumar, S., & Manisekar, K. (2022). Multi-objective optimization in incremental sheet forming of Ti-6Al-4V alloy using grey relational analysis method. Proceedings of the Institution of Mechanical Engineers, Part E: Journal of Process Mechanical Engineering, 236(4), 1467–1476. https://doi.org/10.1177/09544089211063715
- Akhoundi, B., & Modanloo, V. (2023). A multi-criteria decision-making analysis on the extrusion-based additive manufacturing of ABS/Cu composites. International Journal on Interactive Design and Manufacturing (IJIDeM), 17(4), 1995–2003. https://doi.org/10.1007/s12008-023-01342-4
- Asadabadi, M. R., Ahmadi, H. B., Gupta, H., & Liou, J. J. H. (2023). Supplier selection to support environmental sustainability: The stratified BWM TOPSIS method. Annals of Operations Research, 322(1), 321–344. https://doi.org/10.1007/s10479-022-04878-y
- Awodi, N. J., Liu, Y., Ayo-Imoru, R. M., & Ayodeji, A. (2023). Fuzzy TOPSIS-based risk assessment model for effective nuclear decommissioning risk management. Progress in Nuclear Energy, 155, 104524. https://doi.org/10.1016/j.pnucene.2022.104524
- Bao, Y., Zhang, X., Zhou, T., Chen, Z., & Ming, X. (2022). Application of industrial internet for equipment asset management in social digitalization platform based on system engineering using fuzzy DEMATEL-TOPSIS. Machines, 10(12), 1137. https://doi.org/10.3390/machines10121137
- Bashir, M. F., Ma, B., Shahbaz, M., Shahzad, U., & Vo, X. V. (2021). Unveiling the heterogeneous impacts of environmental taxes on energy consumption and energy intensity: Empirical evidence from OECD countries. Energy, 226, 120366. https://doi.org/10.1016/j.energy.2021.120366
- Damle, M., & Krishnamoorthy, B. (2022). Identifying critical drivers of innovation in pharmaceutical industry using TOPSIS method. MethodsX, 9, 101677. https://doi.org/10.1016/j.mex.2022.101677
- Demircan, B. G., & Yetilmezsoy, K. (2023). A hybrid fuzzy AHP-TOPSIS approach for implementation of smart sustainable waste management strategies. Sustainability, 15(8), 6526. https://doi.org/10.3390/su15086526
- Erdemir, Ö. K., & Kirkağaç, M. (2022). A comparative study on performance of insurance companies with grey relational analysis and analytic hierarchy process. Alanya Akademik Bakış, 6(3), 2627–2645. https://doi.org/10.29023/alanyaakademik.1070741
- Esangbedo, M. O., Xue, J., Bai, S., & Esangbedo, C. O. (2024). Relaxed rank order centroid weighting MCDM method with improved grey relational analysis for subcontractor selection: Photothermal power station construction. IEEE Transactions on Engineering Management, 71, 3044–3061. https://doi.org/10.1109/TEM.2022.3204629
- Essa, W. K., Yasin, S. A., Abdullah, A. H., Thalji, M. R., Saeed, I. A., Assiri, M. A., Chong, K. F., & Ali, G. A. M. (2022). Taguchi L25 (54) approach for methylene blue removal by polyethylene terephthalate nanofiber-multi-walled carbon nanotube composite. Water, 14(8), 1242. https://doi.org/10.3390/w14081242
- Fares, N., & Lloret, J. (2022). An integrated SWOT-AHP-fuzzy TOPSIS approach for maturity management following the COVID-19 outbreak: Lessons learned from fast fashion. Journal of Global Operations and Strategic Sourcing, 15(4), 510–533. https://doi.org/10.1108/JGOSS-09-2021-0072
- Gayathri, C., Kamala, V., Gajanand, M. S., & Yamini, S. (2022). Analysis of operational and financial performance of ports: An integrated fuzzy DEMATEL-TOPSIS approach. Benchmarking: An International Journal, 29(3), 1046–1066. https://doi.org/10.1108/BIJ-03-2020-0123
- Gul, M., Shah, A. N., Aziz, U., Husnain, N., Mujtaba, M. A., Kousar, T., Ahmad, R., & Hanif, M. F. (2022). Grey-Taguchi and ANN based optimization of a better performing low-emission diesel engine fueled with biodiesel. Energy Sources, Part A: Recovery, Utilization, and Environmental Effects, 44(1), 1019–1032. https://doi.org/10.1080/15567036.2019.1638995
- Gulishengmu, A., Yang, G., Tian, L., Pan, Y., Huang, Z., Xu, X., Gao, Y., & Li, Y. (2023). Analysis of water resource carrying capacity and obstacle factors based on GRA-TOPSIS evaluation method in Manas river basin. Water, 15(2), 236. https://doi.org/10.3390/w15020236
- Hasanzadeh, R., Mojaver, P., Azdast, T., Khalilarya, S., Chitsaz, A., & Rosen, M. A. (2023). Decision analysis for plastic waste gasification considering energy, exergy, and environmental criteria using TOPSIS and grey relational analysis. Process Safety and Environmental Protection, 174, 414–423. https://doi.org/10.1016/j.psep.2023.04.028
- Hegab, H., Khanna, N., Monib, N., & Salem, A. (2023). Design for sustainable additive manufacturing: A review. Sustainable Materials and Technologies, 35, e00576. https://doi.org/10.1016/j.susmat.2023.e00576
- Ikram, M., Zhang, Q., Sroufe, R., & Shah, S. Z. A. (2020). Towards a sustainable environment: The nexus between ISO 14001, renewable energy consumption, access to electricity, agriculture and CO2 emissions in SAARC countries. Sustainable Production and Consumption, 22, 218–230. https://doi.org/10.1016/j.spc.2020.03.011
- Jamie. (n.d.). AZ31. Luxfer MEL Technologies. https://www.luxfermeltechnologies.com/products/az31/
- Jamwal, A., Agrawal, R., Sharma, M., & Kumar, V. (2021). Review on multi-criteria decision analysis in sustainable manufacturing decision making. International Journal of Sustainable Engineering, 14(3), 202–225. https://doi.org/10.1080/19397038.2020.1866708
- Kumar, G. S., Ramesh, M., Dinesh, S., Paramasivam, P., & Parthipan, N. (2022). Investigation of the TIG welding process for joining AA6082 alloy using grey relational analysis. Advances in Materials Science and Engineering, 2022, 1–8. https://doi.org/10.1155/2022/5670172
- Kumar, S., & Singh, A. (2023). Multi-objective optimization of green drilling parameters on HcHcr steel using GRA-TOPSIS with PCA method. In A. Maurya, A. K. Srivastava, P. K. Jha, & S. M. Pandey (Eds.), Recent trends in mechanical engineering (pp. 13–23). Singapore: Springer Nature. https://doi.org/10.1007/978-981-19-7709-1_2
- Li, H., Liu, H., & Hu, Y. (2022). Prediction of Unbalanced Financial Risk Based on GRA-TOPSIS and SMOTE-CNN. Scientific Programming, 2022, 1–13. https://doi.org/10.1155/2022/8074516
- Li, X., Meng, X., Ji, X., Zhou, J., Pan, C., & Gao, N. (2023). Zoning technology for the management of ecological and clean small-watersheds via k-means clustering and entropy-weighted TOPSIS: A case study in Beijing. Journal of Cleaner Production, 397, 136449. https://doi.org/10.1016/j.jclepro.2023.136449
- Liew, K. F., Lam, W. S., & Lam, W. H. (2022). Financial network analysis on the performance of companies using integrated entropy–DEMATEL–TOPSIS model. Entropy, 24(8), 1056. https://doi.org/10.3390/e24081056
- 2020 Life Cycle Assessment (LCA). (n.d.). https://www.intlmag.org/page/life-cycle-assessment-update
- Lu, L., Hu, S., Liu, L., & Yin, Z. (2016). High speed cutting of AZ31 magnesium alloy. Journal of Magnesium and Alloys, 4(2), 128–134. https://doi.org/10.1016/j.jma.2016.04.004
- Lu, X., Jia, Z., Wang, H., Feng, Y., & Liang, S. Y. (2019). The effect of cutting parameters on micro-hardness and the prediction of Vickers hardness based on a response surface methodology for micro-milling Inconel 718. Measurement, 140, 56–62. https://doi.org/10.1016/j.measurement.2019.03.037
- Malinda, M., & Chen, J.-H. (2022). The forecasting of consumer exchange-traded funds (ETFs) via grey relational analysis (GRA) and artificial neural network (ANN). Empirical Economics, 62(2), 779–823. https://doi.org/10.1007/s00181-021-02039-x
- Minguito, G., & Banluta, J. (2023). Risk management in humanitarian supply chain based on FMEA and grey relational analysis. Socio-Economic Planning Sciences, 87, 101551. https://doi.org/10.1016/j.seps.2023.101551
- Natarajan, M., Pasupuleti, T., Abdullah, M. M. S., Mohammad, F., Giri, J., Chadge, R., Sunheriya, N., Mahatme, C., Giri, P., & Soleiman, A. A. (2023). Assessment of machining of hastelloy using WEDM by a multi-objective approach. Sustainability, 15(13), 10105. https://doi.org/10.3390/su151310105
- Nayman Hamamci, H., & Karkacier, A. (2022). Evaluation of financial performance of participation banks in turkey and GCC with TOPSIS method. Uluslararası Ekonomi ve Yenilik Dergisi, 8(1), 55–78. https://doi.org/10.20979/ueyd.1020027
- Ogedengbe, T. S., Okediji, A. P., Yussouf, A. A., Aderoba, O. A., Abiola, O. A., Alabi, I. O., & Alonge, O. I. (2019). The effects of heat generation on cutting tool and machined workpiece. Journal of Physics: Conference Series, 1378(2), 022012. https://doi.org/10.1088/1742-6596/1378/2/022012
- Ouali, M. (2022). Evaluation of Chinese cloth suppliers using dynamic grey relational analysis. International Journal of Grey Systems, 2(2), 34–46. https://doi.org/10.52812/ijgs.62
- Özbek, O., & Saruhan, H. (2020). The effect of vibration and cutting zone temperature on surface roughness and tool wear in eco-friendly MQL turning of AISI D2. Journal of Materials Research and Technology, 9(3), 2762–2772. https://doi.org/10.1016/j.jmrt.2020.01.010
- Pandey, S., Nautiyal, R., Kumar, P., Chandra, G., & Pal Panwar, V. (2022). A grey relational model for soil erosion vulnerability assessment in subwatershed of lesser Himalayan region. CATENA, 210, 105928. https://doi.org/10.1016/j.catena.2021.105928
- Perumal, A., Kailasanathan, C., Stalin, B., Suresh Kumar, S., Rajkumar, P. R., Gangadharan, T., Venkatesan, G., Nagaprasad, N., Dhinakaran, V., & Krishnaraj, R. (2022). Multiresponse optimization of wire electrical discharge machining parameters for Ti-6Al-2Sn-4Zr-2Mo (α-β) alloy using taguchi-grey relational approach. Advances in Materials Science and Engineering, 2022, 1–13. https://doi.org/10.1155/2022/6905239
- Pimenov, D. Y., Kumar Gupta, M., Da Silva, L. R. R., Kiran, M., Khanna, N., & Krolczyk, G. M. (2022). Application of measurement systems in tool condition monitoring of Milling: A review of measurement science approach. Measurement, 199, 111503. https://doi.org/10.1016/j.measurement.2022.111503
- Piya, S., Shamsuzzoha, A., Azizuddin, M., Al-Hinai, N., & Erdebilli, B. (2022). Integrated Fuzzy AHP-TOPSIS Method to analyze green management practice in hospitality industry in the sultanate of oman. Sustainability, 14(3), 1118. https://doi.org/10.3390/su14031118
- Rampasso, I. S., Quelhas, O. L. G., Ganga, G. M. D., Pavan Serafim, M., Simão, V. G., Costa, L. F. M., & Anholon, R. (2022). Sustainability practices in manufacturing companies: Analysis of an emerging economy. Benchmarking: An International Journal, 30(9), 3382–3407. https://doi.org/10.1108/BIJ-10-2021-0615
- Rani, M., & Kaushal, S. (2022). GeoClust: Feature engineering based framework for location-sensitive disaster event detection using AHP-TOPSIS. Expert Systems with Applications, 210, 118461. https://doi.org/10.1016/j.eswa.2022.118461
- Riaz, M., Tanveer, S., Pamucar, D., & Qin, D.-S. (2022). Topological data analysis with spherical fuzzy soft AHP-TOPSIS for environmental mitigation system. Mathematics, 10(11), 1826. https://doi.org/10.3390/math10111826
- Saad, M. H., Nazzal, M. A., & Darras, B. M. (2019). A general framework for sustainability assessment of manufacturing processes. Ecological Indicators, 97, 211–224. https://doi.org/10.1016/j.ecolind.2018.09.062
- Saeidi, P., Mardani, A., Mishra, A. R., Cajas Cajas, V. E., & Carvajal, M. G. (2022). Evaluate sustainable human resource management in the manufacturing companies using an extended Pythagorean fuzzy SWARA-TOPSIS method. Journal of Cleaner Production, 370, 133380. https://doi.org/10.1016/j.jclepro.2022.133380
- Salur, E., Kuntoğlu, M., Aslan, A., & Pimenov, D. Y. (2021). The Effects of MQL and dry environments on tool wear, cutting temperature, and power consumption during end milling of AISI 1040 steel. Metals, 11(11), 1674. https://doi.org/10.3390/met11111674
- Shokrani, A., Al-Samarrai, I., & Newman, S. T. (2019). Hybrid cryogenic MQL for improving tool life in machining of Ti-6Al-4V titanium alloy. Journal of Manufacturing Processes, 43, 229–243. https://doi.org/10.1016/j.jmapro.2019.05.006
- Siddiqui, S. (2017). Estimation of greenhouse gas emissions by household energy consumption: A case study of Lahore, Pakistan (world). https://www.prdb.pk/front/estimation-of-greenhouse-gas-emissions-by-household-energy-6554
- Silva, N. F., Dos Santos, M., Gomes, C. F. S., & De Andrade, L. P. (2023). An integrated CRITIC and Grey Relational Analysis approach for investment portfolio selection. Decision Analytics Journal, 8, 100285. https://doi.org/10.1016/j.dajour.2023.100285
- Tao, J., Sun, X.-H., Cao, Y., & Ling, M.-H. (2022). Evaluation of water quality and its driving forces in the Shaying River Basin with the grey relational analysis based on combination weighting. Environmental Science and Pollution Research International, 29(12), 18103–18115. https://doi.org/10.1007/s11356-021-16939-z
- Wang, D. (2022). The application of grey relational analysis in the evaluation of financial auditing effect and improvement. Mobile Information Systems, 2022, 1–6. https://doi.org/10.1155/2022/6854225
- Wang, M., Cheng, X., & He, Z. (2022a). Research on multiple affective responses design of product based on kansei engineering and TOPSIS-AISM. Mathematical Problems in Engineering, 2022, 1–12. https://doi.org/10.1155/2022/6945986
- Wang, M., Wang, W., & Wu, L. (2022b). Application of a new grey multivariate forecasting model in the forecasting of energy consumption in 7 regions of China. Energy, 243, 123024. https://doi.org/10.1016/j.energy.2021.123024
- Wen, P., Wang, C., Chen, M., & Chai, Z. (2023). Engineering property evaluation and multiobjective parameter optimization of argillaceous gangue–filled subgrade based on grey relational analysis. Journal of Materials in Civil Engineering, 35(4), 04023007. https://doi.org/10.1061/(ASCE)MT.1943-5533.0004674
- Witharamage, C. S., Christudasjustus, J., & Gupta, R. K. (2021). The effect of milling time and speed on solid solubility, grain size, and hardness of Al-V alloys. Journal of Materials Engineering and Performance, 30(4), 3144–3158. https://doi.org/10.1007/s11665-021-05663-x
- Xie, B., Peng, Q., E, J., Tu, Y., Wei, J., Tang, S., Song, Y., & Fu, G. (2022). Effects of CO addition and multi-factors optimization on hydrogen/air combustion characteristics and thermal performance based on grey relational analysis. Energy, 255, 124573. https://doi.org/10.1016/j.energy.2022.124573
- Xu, Y., Yan, C., Liu, H., Wang, J., Yang, Z., & Jiang, Y. (2020). Smart energy systems: A critical review on design and operation optimization. Sustainable Cities and Society, 62, 102369. https://doi.org/10.1016/j.scs.2020.102369
- Yıldırım, Ç. V., Sarıkaya, M., Kıvak, T., & Şirin, Ş. (2019). The effect of addition of hBN nanoparticles to nanofluid-MQL on tool wear patterns, tool life, roughness and temperature in turning of Ni-based Inconel 625. Tribology International, 134, 443–456. https://doi.org/10.1016/j.triboint.2019.02.027
- Zhang, Z., Jiang, H., Shao, T., & Shao, Q. (2023). Understanding the selection of intelligent engineering B2B platform in China through the fuzzy DANP and TOPSIS techniques: A multi-study analysis. Applied Soft Computing, 141, 110277. https://doi.org/10.1016/j.asoc.2023.110277
- Zhong, S., Yang, K., & Wang, Y. (2021). A novel evaluation method of hydrogen production from coal based on AHP and GRA-TOPSIS. Advances in Civil Engineering, 2021, 1–9. https://doi.org/10.1155/2021/8991994