
 ?Mathematical formulae have been encoded as MathML and are displayed in this HTML version using MathJax in order to improve their display. Uncheck the box to turn MathJax off. This feature requires Javascript. Click on a formula to zoom.
Abstract
Agriculture nutrition linkages have long been recognized as a potentially viable pathway of attaining food and nutrition security. However, these insights have started to influence mainstream thinking on agricultural development only recently and the empirical evidence in sub-Saharan Africa is non-conclusive. We evaluate the influence of farm production diversity on diet diversity in two semi-arid Counties of South Eastern Kenya by employing a sample of 830 smallholder farmers selected using a three-stage sampling procedure and the data were analyzed using a Poisson regression model. On the average, households consumed food from seven food groups out of the 12 possible food groups. We show that farm production diversity has a positive and significant influence on dietary diversity, a proxy for diet quality. Other interventions that can improve dietary diversity include commercialization and wealth creation. Thus, pro-farm diversification interventions are recommended as potential strategies for improving the dietary diversity of rural farming households. Moreover, improving market infrastructure to enhance commercialization and supporting wealth creation through savings and asset accumulation can contribute towards more diversified diets.
REVIEWING EDITOR:
1. Introduction
The relationship between agriculture and nutrition has long been recognized (Haddad, Citation2000; Meeker & Haddad, Citation2013; Ogutu, Gödecke, et al., Citation2020). Agricultural production improves food security access through the availability and access dimensions of food and nutrition security. This became evident during the green revolution of the 1960s when an increase in wheat and rice productivity contributed substantially to improved calorie consumption in Asia and Latin America (Evenson & Gollin, Citation2003). The agriculture-nutrition linkages from a food quality and diversity perspective are not new, but these insights have started to influence mainstream agricultural development interventions only recently (Burlingame & Dernini, Citation2012; Fanzo et al., Citation2013). About 800 million people in the world are chronically hungry, a majority of whom are domiciled in the rural areas of developing countries in Africa and Asia (FAO, Citation2018). Women and children are the most vulnerable groups to malnutrition because of their high nutritional requirements for growth and development (Blossner et al., Citation2005; FAO, Citation2000).
A fifth of the people in Africa are undernourished (FAO, 2018). In Kenya, the focus of this study, a quarter of the population is undernourished (FAO, 2018). Moreover, 26, 11, and 4% of Kenyan children are stunted, underweight, and wasted respectively (UNICEF, Citation2022). Malnutrition is more pronounced in Kenya’s food deficit regions that encompass the Arid and Semi-Arid Land (ASALs). For instance, stunting is estimated at 46% in the ASAL Counties of Kitui and West Pokot while wasting in most ASAL counties in Kenya is estimated at over 20% (UNICEF, Citation2022). Consequently, identifying viable pathways through which the nutrition status of rural farming households can be improved is of key importance for decision makers.
The literature identifies own production and market access as some of the pathways to improving nutrition security (Hoddinott et al., Citation2015; Koppmair et al., Citation2017; Sibhatu et al., Citation2015; Sibhatu & Qaim, Citation2017; World Bank, Citation2008). However, a majority of the agricultural interventions in Kenya have focused on improving farm productivity through the adoption of high yielding crop varieties and livestock species complemented with good agricultural practices, e.g. the Kenya Agricultural Productivity Program,Footnote1 and the Kenya Productivity and Agribusiness Project.Footnote2 The adoption of improved technologies rarely replaces existing enterprises but rather adds to existing enterprise portfolio, enhancing farm production diversity, a key driver of food and nutrition security (Appiah-Twumasi & Asale, Citation2022; Sibhatu et al., Citation2022).
Farm production diversity emanates from the allocation of productive resources to a wider range of farm activities, such as managing numerous crop and livestock species (Kankwamba et al., Citation2012; Mwololo et al., Citation2019). Previous studies report a positive association between farm production diversity and nutrition status using diet diversity as a proxy (Jones et al., Citation2014; Muthini et al., Citation2020; Sibhatu et al., Citation2015; Sibhatu & Qaim Citation2018). However, empirical evidence on the association between farm production diversity and nutrition is non-conclusive and existing literature is context specific and therefore may not be generalized (Muthini et al., Citation2020; Sibhatu & Qaim Citation2018). Consequently, further research on agriculture-nutrition linkages is still required (IFPRI, Citation2011; Masset et al., Citation2012).
To contribute to the agriculture-nutrition discourse, we assess the influence of farm production diversity on dietary quality in Machakos and Makueni Counties in South Eastern Kenya. We focus on the two ASAL counties since they rarely feature in existing literature, such as Liu et al. (Citation2022), Muthini et al. (Citation2020), and Ogutu, Fongar, et al. (Citation2020) which concentrate on the high potential agricultural areas. The implication of the gap is that, ASAL counties may not benefit from the highly contextualized evidence on this topic. This study extends the estimation undertaken in previous research by incorporating the use of the food consumption scores as a robustness check of the findings and the results are consistent. The evidence provided in this study gives credence to recommend that development initiatives should pursue pro-farm production diversification policies as a viable strategy for improving dietary diversity, and thus diet quality. The results are also relevant to the County Governments of Machakos and Makueni which should be encouraged to embrace pro-farm diversification policies. The remainder of this paper proceeds as follows. Section 2 describes the study methods. The results of the study are presented in section 3 and discussed in section 4. Section 5 concludes and provides some policy options.
2. Study methods
2.1. Conceptual framework
A micro-level framework at the household level is adapted from Ogutu, Fongar, et al. (Citation2020) in understanding the agriculture-nutrition linkages in a rural setting (). Dietary diversity can be improved through the consumption of own produced or purchased food. In a pure subsistence setting, farmers would consume own produced food, implying a perfect correlation between production and consumption diversity. However, in practice, many smallholder farmers consume part of their own-produced food but at the same time, attain a marketed surplus making market access an important source of farm income which in turn can contribute significantly to improved diets through food purchases (Kihiu & Amuakwa-Mensah, Citation2021; Ogutu, Fongar, et al., Citation2020).
Figure 1. Agriculture-nutrition linkages at household level.
Source: Adapted from Ogutu, Fongar, et al. (Citation2020).
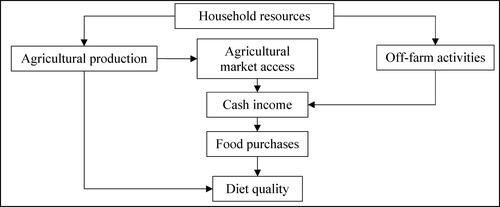
Often, farmers are also involved in off-farm economic activities, such as managing small businesses and providing paid labor. In many African countries, off-farm income already accounts for over 50% of smallholder households’ total income (World Bank, Citation2007). The proceeds of off-farm activities can enable farmers to access diverse foods from the market. Babatunde and Qaim (Citation2010) showed that rising cash income among smallholder farmers can significantly increase dietary quality and micronutrient intake. The relationship between farm production diversity and diet diversity can also be influenced by other socioeconomic factors, such as education and age (Gitagia et al., Citation2019), and gender roles (Drammeh et al., Citation2020).
2.2. Empirical model
We specify the relationship between farm production diversity and diet diversity in EquationEquation (1)(1)
(1) following Sibhatu et al. (Citation2015).
(1)
(1)
Where for the ith household, DDi is the dietary diversity score and PDi is the farm production diversity score. is a vector of other determinants of dietary diversity, such as market access, infrastructure, and wealth,
are coefficient estimates, and
is the error term.
EquationEquation (1)(1)
(1) was estimated using the truncated Poisson regression model that uses the maximum likelihood estimator (Greene, Citation2007) for the three diet diversity scores; household diet diversity score (HDDS), women diet diversity score (WDDS), and child diet diversity score (CDDS). The model is justified since the dietary diversity scores, a proxy for diet quality, give rise to a discrete dependent variable that is limited between 1 and 12 for the HDDS, 1 and 9 for the WDDS, and 1 and 7 for the CDDS. The data is skewed to the left, a phenomenon that would make models, such as the ordinary least squares (OLS) yield inconsistent estimates (Mwololo et al., Citation2019; Nzuma & Mzera, Citation2023). The equal dispersion and homoscedasticity of the standard error requirements of the Poisson model were fulfilled and thus, the model is appropriate.
The resulting coefficient estimates are semi-elasticities while the average marginal effects, which are presented in this study, are the direct elasticities and are specified in EquationEquations (2)(2)
(2) and Equation(3)
(3)
(3) following Wulff (Citation2015).
(2)
(2)
(3)
(3)
Where for the ith household, is the marginal effect, i.e. change in diet diversity due to a small change in farm production diversity,
is the weighted probability of the coefficients. The rest of the parameters are defined in the same way as in EquationEquation (1)
(1)
(1) .
2.3. Data sources and sampling
This study used primary data collected from 830 smallholder farmers in Machakos and Makueni CountiesFootnote3 in September 2021 (). The two Counties are semi-arid receiving a mean annual rainfall of 500 mm with variations depending on altitude. Farmers grow a wide range of food crops, such as maize, pulses (beans, cowpeas, green grams, pigeon peas) vegetables, sorghum, millet, and fruits mostly mangoes, pawpaw, and citrus. In addition, they keep livestock including indigenous cattle, goats, sheep, and chicken.
Figure 2. Map of Kenya; and inset—Machakos (Mwala and Muthetheni wards) and Makueni Counties (Kathonzweni and muvua/kikumini wards).
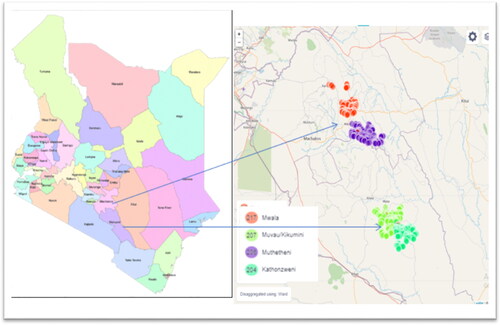
A three-stage sampling procedure was used to select the respondents. In the first stage, two Sub-Counties in each County were purposively selected based on their predominance in growing fruit trees and their ecological similarities. In the second stage, a simple random sampling technique was used to select two Wards per Sub-County. In Machakos County, data were collected in Mwala and Muthetheni Wards of Mwala Sub-County while in Makueni County, Kathonzweni and Muvua/Kikumini Wards of Kathonzweni Sub-County were selected. A listing of the farming households in each Ward was obtained from the Ward agricultural extension office and an online random number application was used to draw a simple random sample of 200 households per Ward, attaining a sample of 800 households in the two Counties. To cater for non-response, the sample size was adjusted upwards by 34 farmers yielding a sample size of 834, with each county contributing half of the sample. The response rate for the survey was 99%. The respondents were interviewed using a semi-structured questionnaire built into the kobotoolbox.org server and the data analyzed in Stata version 14.
2.4. Measurement of key variables
To understand the influence of farm production diversity on diet diversity, HDDS, WDDS, and CDDS were used as the dependent variable while the food consumption score (FCS) was used as a robustness check for the diet diversity score (DDS) models. DDS is an indicator of a household’s ability to access diverse foods (Bilinsky & Swindale, Citation2005). We use DDS as a proxy for diet quality and compute three variants of it, HDDS, WDDS, and CDDS, as a count of the number of different food groups consumed for all the households surveyed. To calculate the HDDS, we use a 7-day food consumption recall comprising food prepared at home, following Muthini et al. (Citation2020). Besides, we calculate the WDDS and the CDDS using a single 24-h recall for households with a woman of child bearing age (15–49 years) and a child of 6–59 months old, respectively following Hussein et al. (Citation2018) and Rathnayake et al. (Citation2012). The WDDS and CDDS comprise food prepared and consumed at home as well as away from home. This approach explains the varying sample size for the CDDS models.
The food consumption recalls are an alternative to observing the actual quantities of the foods an individual consumes. Fongar et al. (Citation2018) and Headey and Ecker (Citation2013) demonstrate that DDSs are significantly correlated with observed measures of nutrition status and thus are reliable. The main strength of the individual 24-h recall is that it allows the researcher to record food prepared and consumed away from home, especially for those working off-farm. Its main weakness is that one requires multiple recalls to minimize measurement errors associated with consumption patterns. Ma et al. (Citation2009) recommend three recalls in assessing energy intake. Although this study used a single 24-h recall, it established before the interview that the diets of the respondents did not vary significantly during the usual days and comprised a starchy food (mostly maize, wheat, or rice meals), vegetable (mostly kales or cabbage), and a pulse (mostly beans, cow peas or green grams). Interviews were not conducted during the unusual days which were market days (mostly once a week) often characterized by fast food and carbonated drinks and weekends (Saturdays and Sundays). Saturdays were common with social functions like weddings and burials that are characterized by rare meals including meat, cake, and alcohol and Sunday is the day most households attended church that is characterized by skipping lunch. Avoiding interviews on the unusual days was important to avoid undue influence on the individual DDSs.
The 7-day recall is appropriate for assessing diet diversity at household level since the data collected is only on the food prepared at home, minimizing errors associated with weekly consumption cycles. Villacis et al. (Citation2023) found that the 7-day recall technique has high predictive accuracy of between 78 and 90%. It is worth noting that, none of the recall methods is adequate in isolation and therefore we utilize both of them concurrently as well as the food consumption scores to improve the reliability of our results. The foods included in computing the HDDS and the WDDS are as per the FAO (Citation2010) guidelines (Kennedy et al., Citation2011) while those included in the CDDS are as per the World Health Organization (WHO, Citation2008) guidelines (). The three diet diversity scores use different food groups given the difference in food requirements of women and children for their physiological development.
Table 1. Food group classification for different dietary diversity scores.
The second proxy of diet quality was the food consumption score (FCS), measured as a count of the number of foods consumed by the household using a 7-day recall (Fite et al., Citation2022). The respondents were provided with a list of 95 foods regularly consumed in the study area to choose from. The FCS was used to check for the robustness DDS models.
The key explanatory variable in this study is the farm production diversity that was measured in three ways; (1) as a count of the number of crop and animal species managed by the household in the 12 months preceding the survey, (2) using the Simpson’s Index, and (3) using a food group production diversity score. The Simpson’s Index accounts for species richness (number of crops) and evenness (area allocated to a crop). Following Jones et al. (Citation2014), the index is defined as , where for the ith household,
is the share of the cultivated land allocated to the Jth crop, calculated as
, where
is the area planted with the jth crop and
is the total cultivated area. The Simpson’s Index is bounded between zero (0) and one (1) where, a value of zero indicates that a household grows only one crop (perfect specialization) and a value of one indicates infinite diversity. The limitation of the Simpson’s Index is that it applies to crops only and we address this weakness by using the Simpson’s Index together with the other two measures of farm production diversity to accommodate livestock.
The food group production diversity score was used as an alternative to the species count. It is a desirable measure of farm production diversity since the same species may provide products that belong to different food groups (e.g. chicken that delivers eggs and meat) or different species may belong to the same food group, e.g. maize and sorghum. The food group production diversity score counts the number of different food groups produced on a farm (Sibhatu & Qaim Citation2018). The use of multiple measurements enabled us to test for the consistency of the estimates.
A commercialization index was used as a proxy for market access. Following Carletto et al. (Citation2017) and Ogutu and Qaim (Citation2019), the index was calculated as the value of farm produce sold divided by the value of total farm produce. Commercialized households were expected to consume more diversified diets. The value of household assets including the main house, electronics, and farm implements were used to estimate the wealth status of the farmers. Farmers were asked to estimate the value of a particular asset, e.g. ox-plough if they were to purchase it in its current form. Although the method is subjective, farmers are cognizant of asset depreciation and provide intuitively reliable estimates. Wealth was thereafter computed by summing the value of individual asset value for each household according to Akter and Francis-Tan (Citation2021) and Mwololo et al. (Citation2022). Other independent variables included were the age and formal education of the household head in years and the sex of the household head as a dummy.
3. Results
3.1. Sample characteristics
presents the descriptive characteristics of the study respondents. Households in Makueni County were more diversified than those in Machakos County, in terms of crop production diversity, but there were no significant differences in livestock diversity of farms between the two Counties. Regarding food consumption, households in Makueni County consumed a significantly higher number of foods, an average of 23 foods, compared to an average of 21 foods consumed by households in Machakos County. On the average, households consumed foods from seven groups most of which were from own production, typical of subsistence farming. The household dietary diversity score was not significantly different between the two Counties but the women and children dietary diversity scores in Makueni County were higher than in Machakos County. Farm commercialization in the study area was low with only a quarter of the farm produce being marketed and the difference between the two counties was not statistically significant.
Table 2. Sample characteristics of farmers in Machakos and Makueni counties.
3.2. Association of farm production diversity and dietary diversity
presents the truncated Poisson regression estimates of the association between farm production diversity and dietary diversity in Machakos and Makueni Counties, Kenya. The data were tested for multicollinearity using the variance inflation factorFootnote4 and the partial correlation coefficient whereas the error term was tested for heteroscedasticity. The model did not suffer from heteroscedasticity since the Breusch-Pagan/Cook-Weisberg test for heteroskedasticity was not statistically significant (Chi2 = 0.03; Prob = 0.86). The deviance and Pearson goodness of fit were also not significant (P = 1). The hypothesis that the data were over dispersed was rejected indicating that the Poisson model was appropriate. Moreover, the Wald Chi2 statistic for all the models was significant at the 1% level, indicating a high prediction power although the McFadden’s Pseudo R2 values were low.Footnote5 The models’ diagnostic tests are robust and hence the study’s results are reliable.
Table 3. Poisson estimates of the association of farm production diversity and household dietary diversity.
Overall households consumed staples, vegetables, and fats and oils. All households consumed maize-based meals while 74, 81, and 80% of all households consumed boiled potatoes, white rice, and wheat-based meals respectively. Almost all sampled households (over 96%) consumed onions and tomatoes making the two vegetables the most commonly consumed foods in the study area. Other common vegetables were cabbage and kale each consumed by 82% of the respondents and spinach which was consumed by 67% of the farmers. Over 97% of the households consumed nuts and pulses while animal products, such as meat and dairy products were consumed by 77 and 94% of the respondents.
The association of farm production diversification and other exogenous variables with the DDS is presented in (columns 1–4) while the FCS outcome variable (columns 5–8) is used to check for the robustness of the HDDS models. All the proxies of farm production diversity had a positive and significant association with HDDS. Growing an extra crop species was associated with a 7.7% increase in the HDDS (, column 1). The livestock diversity had a larger association with HDDS compared to crop diversity with an extra breed being associated with a 23.4% increase in HDDS (, columns 2), pointing to the importance of livestock and livestock products in enhancing diet quality, especially as a source of high-quality protein, e.g. meat, milk, and eggs.
Considering the Simpsons Index, we interpret a small change in the index since it is impossible for a farm to change from zero (specialization) to one (infinite diversity) and vice versa. Thus, a 10% increase in the Simpson’s Index was associated with a 15% increase in the HDDS (, column 3). When farm production diversity was measured as a count of the food groups produced, including an extra food group in the farm had a positive and significant association with HDDS and the magnitude was double that of crop diversity since various crops may have belonged to the same group (, column 4). All the estimates of the association of farm production diversity and FCS were consistent in direction and significance level, suggesting that the results are reliable (, columns 5–8).
In addition to farm production diversity, we identified other drivers of dietary diversity. Commercialization had a positive and significant association with HDDS and the magnitude of the estimates were consistent and comparable across all the models, other than in , column 4. Households with a child of 6–59 months were 21–23% more likely to have a higher HDDS than those households without a child of such age. Moreover, male headed households were 29–36% more likely to have higher HDDS relative to their female headed counterparts (, columns 2 and 3). Wealth had a positive and significant association with HDDS. A 1% increase in the wealth index was associated with an increase in the HDDS in the range of 26–30% (, columns 3 and 4).
Farm production diversity was also positively associated with the women diet quality at least at the 5% level (). More commercialized, wealthier, and male headed households were more likely to consume more diverse diets (). A 1% increase in the commercialization index was associated with an increase in the WDDS of between 46 and 52%. Women from wealthier households were 22–27% more likely to consume diverse foods while diets of those from male headed households were 33–38% more likely to consume diversified diets ().
Table 4. Poisson maximum likelihood estimates of the association of farm production diversity and women diet diversity.
Regarding the diet diversity of children, only the crop and the food group diversity had a significant association with the dietary quality (). An additional crop species grown was associated with a 10% increase in the CDDS whereas an additional food group was associated with 12% increase in the CDDS (, columns 1 and 4). An interesting observation was that the education level of the caregiver, often the child’s mother, had a positive and significant association with the child’s diet quality (). An extra year of formal education for the caregiver was associated with a 5% increase in the CDDS (, columns 1 and 4). Household wealth was also positively associated with the CDDS. Diets of children from wealthier households were 21–27% more diverse compared to children from poor households. Similarly, older children were 1% more likely to consume diversified diets (, columns 1–4).
Table 5. Poisson maximum likelihood estimates of the association of farm production diversity and child diet diversity.
4. Discussion
We evaluated the influence of farm production diversity, the independent variable of interest on diet diversity, a proxy for diet quality by estimating three truncated Poisson regression models each for the household, women, and children diet diversity scores. The model’s estimated results, while controlling for other covariates are consistent, indicating that the results are robust. We find a positive and significant association between farm production diversity and the household as well as the women diet diversities confirming our earlier hypothesis of a positive influence. These influences are in congruence with our conceptual framework in that, diversifying farm production is a viable pathway for improving diet quality and also corroborates earlier findings by Gaillard et al. (Citation2022), Kissoly et al. (Citation2020), and Muthini et al. (Citation2020). Households on the average consumed meals from seven food groups (to the nearest whole number) while producing six food groups on average, indicating that own production contributed about 86% of the diet diversity of the households typical of subsistence farming. Subsistence farming is often characterized by small farms of <5 acres as defined by Debonne et al. (Citation2021) and Samberg et al. (Citation2016), low returns to labor (Gollin et al., Citation2014), and limited access to markets (Ngenoh et al., Citation2019) as is the case in this study where the marketed surplus constituted a quarter of total farm production.
As expected, the livestock diversity had a larger association with dietary diversity than the crop diversity, three times larger for the household diet diversity and two and half times larger for the women diet diversity. Livestock and livestock products are often sold for cash and therefore rural diets are often deficient in livestock products. It is plausible that if included in rural household diets, livestock, and livestock products would enhance diet diversity a great deal and thus diet quality since they are sources of high-quality protein. Similar findings have been reported by Bakhtsiyarava and Grace (Citation2021) and Zanello et al. (Citation2019). Surprisingly, the livestock diversity did not have a significant association with child dietary diversity possibly due to the slow onset of weaning foods for children. In the African rural setting, livestock diversity, such as having chicken, goats, cattle, etc. is an indication of a higher social status and therefore may be associated with other indicators, such as wealth that have a significant association with diet diversity as reported by Fatch et al. (Citation2023).
In addition to our finding that farm production diversity is a potential pathway for improving diet diversity, other complementary strategies observed were commercialization, wealth creation, and education of the child caregivers. The association of commercialization with diet diversity was positive, significant, and consistent across the household, women, and children diet diversity scores implying that it is an important strategy when targeting households with women and children like was the case for 42% of the households in our sample. This is conceivable even for highly diversified farms because it is difficult to produce all the foods a household consumes, especially livestock and livestock products. For instance, a household may keep goats but it is rare for a goat to be slaughtered for home consumption. Instead, farmers would consume goat milk and occasionally sell the goat for income that is used to access a variety of basic needs. Comparable results are reported by Huang and Tian (Citation2019), Ogutu, Fongar, et al. (Citation2020), and Onyeneke et al. (Citation2019).
Wealth has a positive and significant association with diet diversity and therefore wealth creation is another pathway through which households can improve their diets. Wealthier farmers had more diverse diets for the household, women and children diet diversity scores. Wealth can complement own food production because wealthier households can afford to purchase food. Wealth is particularly an interesting and strong indicator given its compound nature and association with other indicators. Mwololo et al. (Citation2022) found a positive association between wealth status and farmer empowerment in Kenya, whereas Lukwa et al. (Citation2020) found that food insecurity was prevalent among rural poor in Zimbabwe.
In addition to the three viable pathways that can be applied to improve dietary diversity, the gender of the household, the formal education of the child caregiver, and child’s age returned a significant association with diet diversity and therefore are worth discussing. Women headed households are often poorer compared to their men headed counterparts owing to gender inequalities (Wrigley-Asante, Citation2008) and therefore limiting their capacity to either afford the cost associated with farm production diversification or purchase of food. Our results show that male headed households reported more diverse diets compared to female headed households and this finding is in agreement with Muthini et al. (Citation2020). Male farmers are more likely to have access to productive assets, such as land and capital, and have more decision-making power. Mwololo et al. (Citation2021) found that men were more empowered than women in decisions regarding farm production and income use in Western Kenya.
The formal education of the caregiver, often the mother, has a positive and significant association with the diet diversity of the children. In line with other studies, such as Dafursa and Gebremedhin (Citation2019) and Onyeneke et al. (Citation2019), education improves the caregiver’s knowledge of diets and influences their diet choices. Moreover, educated mothers are more likely to get better paying job opportunities enhancing not only diet choices but also their purchasing power. The child’s age was also positively associated with their diet diversity score. This finding was not unusual as it corroborates the findings of Berti et al. (Citation2004) and Masset et al. (Citation2012). A plausible explanation is that a child’s diet diversity increases with age as they are weaned from exclusive breast feeding (Harvey et al., Citation2017).
5. Conclusions and policy recommendations
The key finding of this study is that farm production diversity is a viable strategy to improving the dietary quality of farming households through the diet diversity pathway. Thus, development and policy interventions targeting to diversify the diets of smallholder farmers should pursue pro-farm production diversification policies. An important entry point is to keep additional livestock species because livestock diversity has a higher influence on dietary diversity than crop diversity. We observe that measuring farm production diversity based on food groups diversification returns a stronger association with the diet diversity than species diversification suggesting that farm diversification should be guided by the food groups a household manages.
Since commercialization returned a positive and significant association with diet diversity, then it can be concluded that commercializing farms is a viable strategy for improving the diet quality of smallholder farmers. County governments should therefore prioritize investments towards improving market infrastructure, especially rural roads and market sheds to enhance farm commercialization. Such investments would reduce the cost and time of accessing agricultural markets, e.g. rural roads would reduce the damage of produce while market shades would protect traders and their produce from adverse weather conditions, such as direct sun light and rain that jeopardize the quality and value of farm produce while lighting open markets would reduce insecurity at night and on the flip side, increase trading hours.
Wealthier farmers reportedly consumed more diversified diets than their less wealthy counterparts. Consequently, wealth creation strategies should be promoted including savings, asset accumulation, and livelihood diversification. With the advent of climate change that has had adverse effects on agricultural production potential, wealth becomes crucial in boosting diet diversity through market purchases. Since the education of the child’s caregiver, often the child’s mother, is positively associated with the child’s diet diversity, interventions should prioritize investing in educating the girl children who are the future mothers. Educated mothers are more likely to make better choices regarding the quality of diets which when coupled with higher earning capacity improves diet diversity. This is particularly important considering the long-term effects of child malnutrition including cognitive disability and reduced economic potential of the affected (Siddiqui et al., Citation2020).
Lastly, the finding that male headed households reported more diverse diets is an indication that women may be limited in various ways. Farming households in rural Kenya are patriarchal with men owning or having more decision-making powers over the utilization of productive assets, such as agricultural land and income utilization. To narrow the diet diversity gap between men and women headed households, women can benefit from empowerment as shown by Baye et al. (Citation2021) and Kassie et al. (Citation2020).
While the several tests we conducted confirm the robustness of our findings, some limitations remain. First, the use of cross-section data limits the strength of the identification strategy and does not control for endogeneity which is almost always inherent in humans, e.g. innate capabilities thus weakening the external validity of the results. Consequently, we only report associations as opposed to causality. Second, the 7-day food consumption recall data provides a rational snapshot of diets at the household level, but it may not account for periodic consumption cycles that are beyond one week, e.g. households with formally employed members may follow a monthly cycle. Lastly, the use of 12-months recall period for the farm production data may result in recall error. Given the three limitations, our findings are valid for Eastern Kenya. Therefore, findings in this study may not directly apply beyond the two study counties.
Ethical approval
Since this study used a survey to collect cross-sectional data of farmers’ socio-economic characteristics, such as their farm production diversity and diet diversity, major ethical concerns do not arise as would be the case with randomized control trials, where for research purposes, the control group may be denied treatment that they actually need. However, we ensured to eliminate any further ethical concerns in three ways. First, before the start of the interview, enumerators briefed the farmers including mentioning that the data collected was for academic purposes and would not be used for commercial gains. Farmers were also briefed on some of the key variables of interest and that the data analysis would be anonymized. After the brief, the farmers were asked whether they were willing to proceed with the interview. Two options were possible, if a farmer was willing, she or he was interviewed, otherwise, the enumerator terminated the interview and proceeded to the next farmer on the list. All the farmers in the sample agreed to be interviewed. Secondly, the preliminary findings of the study were shared in a dissemination workshop that included a group of randomly selected farmers from among those interviewed. The workshop was organized by the funder of the study, the African Economic Research Consortium (AERC).
Author contributions
Jonathan Makau Nzuma conceptualized the study, designed the survey, developed the questionnaire, supervised data collection, analyzed and interpreted the data, and wrote the paper. Dasel Wambua Mulwa Kaindi digitized the questionnaire using kobotoolbox, supervised data collection, and computed the model variables. Henry Muli Mwololo designed the survey tool, analyzed the data, and wrote the paper.
Disclosure statement
No potential conflict of interest was reported by the author(s).
Data availability statement
Data is available from the authors on request.
Additional information
Funding
Notes on contributors
Jonathan Makau Nzuma
Jonathan Makau Nzuma is an Associate Professor at the Department of Agricultural Economics, University of Nairobi, Kenya.
Dasel Wambua Mulwa Kaindi
Dasel Wambua Mulwa Kaindi is a Senior Lecturer at the Department of Food Science, Nutrition and Technology, University of Nairobi, Kenya.
Henry Muli Mwololo
Henry Muli Mwololo is a Research Associate at the Department of Agricultural Economics, University of Nairobi, Kenya.
Notes
1 https://ieg.worldbankgroup.org/sites/default/files/Data/reports/ppar_kenyaagriculture.pdf. Accessed on 8th November 2022.
2 https://projects.worldbank.org/en/projects-operations/project-detail/P109683. Accessed on 8th November 2022.
3 Inclusion of the two counties (Machakos and Makueni) was not for comparison purposes per se but rather to enhance the external validity from a geographic scope point of view since the study uses cross section data that suffer from weak external validity.
4 The average VIF was 1.19 and ranged from 1.05 to 1.34 for all the variables whereas the partial correlation coefficients were in the range of 0.01–0.14 thus the model did not exhibit multicollinearity.
5 All the models returned low McFadden’s Pseudo R2 values ranging between 1.1 and 5.9%. Although a higher value of the McFadden’s Pseudo R2 is desirable, it is not uncommon for nonlinear models to return such ratios. Chaudhry et al. (Citation2020) provide a plausible explanation that the McFadden’s Pseudo R2 is not an equivalent of the standard R2 found in linear models, i.e. the proportion of variance in the dependent variable that can be explained by the independent variables included in the model. Therefore, the McFadden’s Pseudo R2 should not be interpreted directly to imply the model’s goodness of fit.
References
- Akter, S., & Francis-Tan, A. (2021). Partners or rivals? Exploring the relationship between men’s and women’s empowerment in Bangladesh. The Journal of Development Studies, 57(6), 1–13. https://doi.org/10.1080/00220388.2020.1826448
- Appiah-Twumasi, M., & Asale, M. A. (2022). Crop diversification and farm household food and nutrition security in Northern Ghana. Environment, Development and Sustainability, 1–29. https://doi.org/10.1007/s10668-022-02703-x
- Babatunde, R. O., & Qaim, M. (2010). Impact of off-farm income on food security and nutrition in Nigeria. Food Policy, 35(4), 303–311. https://doi.org/10.1016/j.foodpol.2010.01.006
- Bakhtsiyarava, M., & Grace, K. (2021). Agricultural production diversity and child nutrition in Ethiopia. Food Security, 13(6), 1407–1422. https://doi.org/10.1007/s12571-021-01173-9
- Baye, K., Laillou, A., & Chitekwe, S. (2021). Empowering women can improve child dietary diversity in Ethiopia. Maternal & Child Nutrition, e13285. https://doi.org/10.1111/mcn.13285
- Berti, P. R., Krasevec, J., & FitzGerald, S. (2004). A review of the effectiveness of agriculture interventions in improving nutrition outcomes. Public Health Nutrition, 7(5), 599–609. https://doi.org/10.1079/PHN2003595
- Bilinsky, P., & Swindale, A. (2005). Months of inadequate household food provision (MIHFIP) for measurement of household food access: Indicator guide. Food and Nutrition Technical Assistance Project.
- Blossner, M., De Onis, M., & Prüss-Üstün, A. (2005). Malnutrition: Quantifying the health impact at national and local levels. Environmental Burden of Disease Series No. 12. World Health Organization.
- Burlingame, B., & Dernini, S. (Eds.). (2012). Sustainable diets and biodiversity. In Bioversity international (p. 309). Food and Agriculture Organization of the United Nations. ISBN: 978-92-5-107288-2.
- Carletto, C., Corral, P., & Guelfi, A. (2017). Agricultural commercialization and nutrition revisited: Empirical evidence from three African countries. Food Policy, 67, 106–118. https://doi.org/10.1016/j.foodpol.2016.09.020
- Chaudhry, R., Dranitsaris, G., Mubashir, T., Bartoszko, J., & Riazi, S. (2020). A country level analysis measuring the impact of government actions, country preparedness and socioeconomic factors on COVID-19 mortality and related health outcomes. EClinicalMedicine, 25, 100464. https://doi.org/10.1016/j.eclinm.2020.100464
- Dafursa, K., & Gebremedhin, S. (2019). Dietary diversity among children aged 6–23 months in Aleta Wondo District, Southern Ethiopia. Journal of Nutrition and Metabolism, 2019, 2869424. https://doi.org/10.1155/2019/2869424
- Debonne, N., van Vliet, J., Ramkat, R., Snelder, D., & Verburg, P. (2021). Farm scale as a driver of agricultural development in the Kenyan Rift Valley. Agricultural Systems, 186, 102943. https://doi.org/10.1016/j.agsy.2020.102943
- Drammeh, W., Njie, B., Hamid, N. A., & Rohana, A. J. (2020). Determinants of dietary diversity among households in central river region south, the Gambia. Current Research in Nutrition and Food Science Journal, 8(2), 656–666. https://doi.org/10.12944/CRNFSJ.8.2.31
- Evenson, R. E., & Gollin, D. (2003). Assessing the impact of the Green Revolution, 1960 to 2000. Science, 300(5620), 758–762. https://doi.org/10.1126/science.1078710
- Fanzo, J., Hunter, D., Borelli, T., & Mattei, F. (Eds.). (2013). Diversifying food and diets: Using agricultural biodiversity to improve nutrition and health. Routledge.
- FAO (2000). The State of Food and Agriculture 2000: Lessons from the past 50 years. Food and Agriculture Organization of the United Nations.
- FAO (2010). Retrieved March 11, 2022, from https://www.fao.org/3/i1983e/i1983e00.pdf
- FAO (2018). The State of Food Security and Nutrition in the World. Rome: Food and Agriculture Organization of the United Nations.
- Fatch, P., Masangano, C., Jordan, I., Hilger, T., Kalimbira, A., Glas, M. G., Roehlig, A., Chiutsi-Phiri, G., Kamoto, J. F. M., Mambo, I., & Nuppenau, E. A. (2023). Agricultural diversity linkage to income, wealth, diets and nutrition: Case of Lilongwe district in Malawi. Scientific African, 19, e01569. https://doi.org/10.1016/j.sciaf.2023.e01569
- Fite, M. B., Tura, A. K., Yadeta, T. A., Oljira, L., & Roba, K. T. (2022). Factors associated with food consumption score among pregnant women in Eastern Ethiopia: A community-based study. Journal of Health, Population and Nutrition, 41(1), 1–9. https://doi.org/10.1186/s41043-022-00286-x
- Fongar, A., Gödecke, T., Aseta, A., & Qaim, M. (2018). How well do different dietary and nutrition assessment tools match? Insights from rural Kenya. Public Health Nutrition, 22(3), 391–403. https://doi.org/10.1017/S1368980018002756
- Gitagia, M. W., Ramkat, R. C., Mituki, D. M., Termote, C., Covic, N., & Cheserek, M. J. (2019). Determinants of dietary diversity among women of reproductive age in two different agro-ecological zones of Rongai Sub-County, Nakuru, Kenya. Food & Nutrition Research, 63(0). https://doi.org/10.29219/fnr.v63.1553
- Gaillard, C., Verger, E. O., Dury, S., Dop, M. C., El Ati, J., & Medina Study Group. (2022). Farm production diversity and women’s dietary diversity: Evidence from central Tunisia. Plos One, 17(2), e0263276.
- Gollin, D., Lagakos, D., & Waugh, M. E. (2014). The agricultural productivity gap. The Quarterly Journal of Economics, 129(2), 939–993. https://doi.org/10.1093/qje/qjt056
- Greene, J. C. (2007). Mixed Methods in Social Inquiry. San Francisco: Jossey-Bass. https://doi.org/10.1177/1558689807314013
- Haddad, L. (2000). A conceptual framework for assessing agriculture–nutrition linkages. Food and Nutrition Bulletin, 21(4), 367–373. https://doi.org/10.1177/156482650002100405
- Harvey, S., Callaby, J., & Roberts, L. (2017). An exploration of complementary feeding of infants and young children in the rural area of Muhoroni, Nyanza province, Kenya: A descriptive study. Paediatrics and International Child Health, 37(3), 172–180. https://doi.org/10.1080/20469047.2016.1230970
- Headey, D., & Ecker, O. (2013). Rethinking the measurement of food security: From first principles to best practice. Food Security, 5(3), 327–343. https://doi.org/10.1007/s12571-013-0253-0
- Hoddinott, J., Headey, D., & Dereje, M. (2015). Cows, missing milk markets, and nutrition in rural Ethiopia. The Journal of Development Studies, 51(8), 958–975. https://doi.org/10.1080/00220388.2015.1018903
- Huang, Y., & Tian, X. (2019). Food accessibility, diversity of agricultural production and dietary pattern in rural China. Food Policy. 84, 92–102. https://doi.org/10.1016/j.foodpol.2019.03.002
- Hussein, F. M., Ahmed, A. Y., & Muhammed, O. S. (2018). Household food insecurity access scale and dietary diversity score as a proxy indicator of nutritional status among people living with HIV/AIDS, Bahir Dar, Ethiopia, 2017. PLOS One, 13(6), e0199511. https://doi.org/10.1371/journal.pone.0199511
- IFPRI (2011). Agriculture for Nutrition and Health (A4NH); Proposal for CGIAR Research Program. International Food Policy Research Institute.
- Jones, A. D., Shrinivas, A., & Bezner-Kerr, R. (2014). Farm production diversity is associated with greater household dietary diversity in Malawi: Findings from nationally representative data. Food Policy, 46, 1–12. https://doi.org/10.1016/j.foodpol.2014.02.001
- Kankwamba, H., Mapila, M. A. T. J., & Pauw, K. (2012). Determinants and spatiotemporal dimensions of crop diversification in Malawi. Project report produced under a co-financed research agreement between Irish Aid, USAID and IFPRI, Paper, (3).
- Kassie, M., Fisher, M., Muricho, G., & Diiro, G. (2020). Women’s empowerment boosts the gains in dietary diversity from agricultural technology adoption in rural Kenya. Food Policy, 95, 101957. https://doi.org/10.1016/j.foodpol.2020.101957
- Kennedy, G., Ballard, T., & Dop, M. C. (2011). Guidelines for measuring household and individual dietary diversity. Food and Agriculture Organization of the United Nations.
- Kihiu, E. N., & Amuakwa-Mensah, F. (2021). Agricultural market access and dietary diversity in Kenya: Gender considerations towards improved household nutritional outcomes. Food Policy, 100, 102004. https://doi.org/10.1016/j.foodpol.2020.102004
- Kissoly, L. D., Karki, S. K., & Grote, U. (2020). Diversity in farm production and household diets: comparing evidence from smallholders in Kenya and Tanzania. Frontiers in Sustainable Food Systems, 4, 77. https://doi.org/10.3389/fsufs.2020.00077
- Koppmair, S., Kassie, M., & Qaim, M. (2017). Farm production, market access and dietary diversity in Malawi. Public Health Nutrition, 20(2), 325–335. https://doi.org/10.1017/S1368980016002135
- Liu, T., Broverman, S., Puffer, E. S., Zaltz, D. A., Thorne-Lyman, A. L., & Benjamin-Neelon, S. E. (2022). Dietary diversity and dietary patterns in school-aged children in Western Kenya: A latent class analysis. International Journal of Environmental Research and Public Health, 19(15), 9130. https://doi.org/10.3390/ijerph19159130
- Lukwa, A. T., Siya, A., Zablon, K. N., Azam, J. M., & Alaba, O. A. (2020). Socioeconomic inequalities in food insecurity and malnutrition among under-five children: Within and between-group inequalities in Zimbabwe. BMC Public Health, 20(1), 1199. https://doi.org/10.1186/s12889-020-09295-z
- Ma, Y., Olendzki, B. C., Pagoto, S. L., Hurley, T. G., Magner, R. P., Ockene, I. S., Schneider, K. L., Merriam, P. A., & Hébert, J. R. (2009). Number of 24-hour diet recalls needed to estimate energy intake. Annals of Epidemiology, 19(8), 553–559. https://doi.org/10.1016/j.annepidem.2009.04.010
- Masset, E., Haddad, L., Cornelius, A., & Isaza-Castro, J. (2012). Effectiveness of agricultural interventions that aim to improve nutritional status of children: Systematic review. BMJ, 344(1), d8222. https://doi.org/10.1136/bmj.d8222
- Meeker, J., & Haddad, L. (2013). A state-of-the-art review of agriculture-nutrition linkages. Retrieved June 21, 2023, from https://opendocs.ids.ac.uk/opendocs/handle/20.500.12413/3035
- Muthini, D., Nzuma, J., & Nyikal, R. (2020). Farm production diversity and its association with dietary diversity in Kenya. Food Security, 12(5), 1107–1120. https://doi.org/10.1007/s12571-020-01030-1
- Mwololo, H. M., Nzuma, J. M., & Githinji, L. M. (2022). Determinants of farmer empowerment in agriculture in Kenya: A Tobit approach. Heliyon, 8(12), e11888. https://doi.org/10.1016/j.heliyon.2022.e11888
- Mwololo, H. M., Nzuma, J. M., & Ritho, C. N. (2021). Farmer empowerment in agriculture and its association with smallholder farm incomes in Kenya. African Journal of Agricultural and Resource Economics, 16(4), 355–369. https://doi.org/10.53936/afjare.2021.16(4).23
- Mwololo, H. M., Nzuma, J. M., Ritho, C. N., & Aseta, A. (2019). Is the type of agricultural extension services a determinant of farm diversity? Evidence from Kenya. Development Studies Research, 6(1), 40–46. https://doi.org/10.1080/21665095.2019.1580596
- Ngenoh, E., Kurgat, B. K., Bett, H. K., Kebede, S. W., & Bokelmann, W. (2019). Determinants of the competitiveness of smallholder African indigenous vegetable farmers in high-value agro-food chains in Kenya: A multivariate probit regression analysis. Agricultural and Food Economics, 7(1), 1–17. https://doi.org/10.1186/s40100-019-0122-z
- Nzuma, J. M., & Mzera, U. I. (2023). Evaluating aflatoxin contamination control practices among smallholder maize farmers in Kilifi County, Kenya: A Poisson regression analysis. Environment, Development and Sustainability. https://doi.org/10.1007/s10668-023-03133-z
- Ogutu, S. O., & Qaim, M. (2019). Commercialization of the small farm sector and multidimensional poverty. World Development, 114, 281–293. https://doi.org/10.1016/j.worlddev.2018.10.012
- Ogutu, S. O., Fongar, A., Gödecke, T., Jäckering, L., Mwololo, H. M., Njuguna, M., & Qaim, M. (2020). How to make farming and agricultural extension more nutrition-sensitive: Evidence from a randomized controlled trial in Kenya. European Review of Agricultural Economics, 47(1), 95–118.
- Ogutu, S. O., Gödecke, T., & Qaim, M. (2020). Agricultural commercialization and nutrition in smallholder farm households. Journal of Agricultural Economics, 71(2), 534–555. https://doi.org/10.1111/1477-9552.12359
- Onyeneke, R., Nwajiuba, C., Igberi, C., Umunna Amadi, M., Anosike, F., Oko-Isu, A., Munonye, J., Uwadoka, C., & Adeolu, A. (2019). Impacts of caregivers’ nutrition knowledge and food market accessibility on preschool children’s dietary diversity in remote communities in Southeast Nigeria. Sustainability, 11(6), 1688. https://doi.org/10.3390/su11061688
- Rathnayake, K. M., Madushani, P. A. E., & Silva, K. D. R. R. (2012). Use of dietary diversity score as a proxy indicator of nutrient adequacy of rural elderly people in Sri Lanka. BMC Research Notes, 5(1), 469. https://doi.org/10.1186/1756-0500-5-469
- Samberg L H, Gerber J S, Ramankutty N, Herrero M and West P C (2016). Subnational distribution of average farm size and smallholder contributions to global food production. Environmental Research Letters. https://doi.org/10.1088/1748-9326/11/12/124010
- Sibhatu, K. T., & Qaim, M. (2017). Rural food security, subsistence agriculture, and seasonality. PLOS One, 12(10), e0186406. https://doi.org/10.1371/journal.pone.0186406
- Sibhatu, K. T., & Qaim, M. (2018). Farm production diversity and dietary quality: Linkages and measurement issues. Food Security, 10(1), 47–59. https://doi.org/10.1007/s12571-017-0762-3
- Sibhatu, K. T., & Qaim, M. (2018). Meta-analysis of the association between production diversity, diets, and nutrition in smallholder farm households. Food Policy, 77, 1–18. https://doi.org/10.1016/j.foodpol.2018.04.013
- Sibhatu, K. T., Arslan, A., & Zucchini, E. (2022). The effect of agricultural programs on dietary diversity and food security: Insights from the smallholder productivity promotion program in Zambia. Food Policy, 113, 102268. https://doi.org/10.1016/j.foodpol.2022.102268
- Sibhatu, K. T., Krishna, V. V., & Qaim, M. (2015). Production diversity and dietary diversity in smallholder farm households. Proceedings of the National Academy of Sciences of the United States of America, 112(34), 10657–10662. https://doi.org/10.1073/pnas.1510982112
- Siddiqui, F., Salam, R. A., Lassi, Z. S., & Das, J. K. (2020). The intertwined relationship between malnutrition and poverty. Frontiers in Public Health, 8, 453. https://doi.org/10.3389/fpubh.2020.00453
- UNICEF (2022). Retrieved November 8, 2022, from https://www.unicef.org/kenya/nutrition
- Villacis, A. H., Badruddoza, S., Mishra, A. K., & Mayorga, J. (2023). The role of recall periods when predicting food insecurity: A machine learning application in Nigeria. Global Food Security, 36, 100671. https://doi.org/10.1016/j.gfs.2023.100671
- WHO (2008). Retrieved March 11, 2022, from http://apps.who.int/iris/bitstream/handle/10665/43895/9789241596664_eng.pdf;jsessionid=73C7C471E331DC952FD99EC482740578?sequence=1
- World Bank (2007). World Development Report 2008: Agriculture for development. The World Bank.
- World Bank (2008). From agriculture to nutrition pathways. In Synergies and outcomes. The World Bank, Agriculture and Rural Development Department.
- Wrigley-Asante, C. (2008). Men are poor but women are poorer: Gendered poverty and survival strategies in the Dangme West District of Ghana. Norwegian Journal of Geography, 62(3), 161–170. https://doi.org/10.1080/00291950802335541
- Wulff, J. N. (2015). Interpreting results from the multinomial logit model: Demonstrated by foreign market entry. Organizational Research Methods, 18(2), 300–325. https://doi.org/10.1177/1094428114560024
- Zanello, G., Shankar, B., & Poole, N. (2019). Buy or make? Agricultural production diversity, markets and dietary diversity in Afghanistan. Food Policy, 87, 101731. https://doi.org/10.1016/j.foodpol.2019.101731