
 ?Mathematical formulae have been encoded as MathML and are displayed in this HTML version using MathJax in order to improve their display. Uncheck the box to turn MathJax off. This feature requires Javascript. Click on a formula to zoom.
Abstract
This study examines the demographic determinants for the choice of wildlife attractions among international repeat tourists in Tanzania to provide valuable insights for destination planning and marketing. The study employed binary logistic regression analysis and cross-tabulation to assess the influence of demographic characteristics on the selection of wildlife attractions from the total 1550 international repeat tourists. The demographic attributes of tourists, including family size, employment status, income level, and region of origin, exert a substantial impact on the selection of the wildlife attraction, as indicated by a significant p-value <0.05. While individuals with medium-level annual income, retirees, students, and those individuals who are from Asia and North America are drawn to wildlife experiences. Unlike, tourists residing from small size family (less than members) and those who are coming from South America, show reduced interest in wildlife attractions. Moreover, the results from the cross-tabulation revealed that individuals with a moderate annual income, especially those who are from large family sizes, exhibit a more pronounced preference for wildlife. Additionally, the findings indicated that repeat tourists showing a higher inclination towards wildlife are individuals who are retired and have a family size exceeding three members. These findings shed light on possibilities for marketers to enhance their strategies, ensuring that information regarding the diverse range of wildlife offerings and new wildlife packages reaches individuals displaying a strong inclination for repeat visits.
1. Introduction
Tourism, a multifaceted industry encompassing travel, leisure, and exploration, holds immense global importance (UNWTO, Citation2021). Tourism fuels growth by generating revenue, fostering job creation, and bolstering foreign exchange earnings (UNWTO, Citation2021). Beyond economics, tourism promotes cross-cultural understanding, preserves heritage, and nurtures community development (Olalere, Citation2019). Also, it can drive infrastructure enhancements and environmental conservation efforts, while serving as a platform for education, research, and diplomatic engagement (Ahmed & Jahan, Citation2013).
Setting aside the industry’s standpoint, intense rivalry prevails among tourist destinations, thereby exposing attractions at significant risks (Almeida-Santana & Moreno-Gil, Citation2018; Okamura & Fukushige, Citation2010; Oppermann, Citation2000). To avoid exposure to risks, the recommendation put forward is to focus on retaining its loyal customers (Almeida-Santana & Moreno-Gil, Citation2018). A fundamental assumption underlying this perspective is that repeat visitors tend to be more financially advantageous (e.g. due to reduced marketing costs) and that their positive word of mouth (WOM) is vital for drawing in new tourists to the destination (Čaušević et al., Citation2020; Lim et al., Citation2016). Moreover, retaining tourists is considered more cost-effective than attracting new ones (Oppermann, Citation2000).
Despite the importance of repeat tourists, Tanzania faces the challenge of attracting a satisfactory number of repeat tourists compared to its competitors, such as Kenya and South Africa. For instance, between 2016 and 2019, Tanzania received an average of 20% repeat tourists, compared to South Africa and Kenya, which received an average of 80 and 42% repeat tourists, respectively (Musembi et al., Citation2020; SIA, Citation2020; TRI, Citation2020). Knowingly, the country contains varieties and diversity of natural attractions over its competitors; Kenya and South Africa (Travel & Tourism Competitive Report, 2019). The expectation was, due to the availability of unique and diversity of natural attractions including wildlife, mountains, beach, and forest reserves which primarily attract tourists to the destination, Tanzania should gain a competitive advantage over its competitors by attracting enough number of tourists (Wamboye et al., Citation2020).
Tourism in Tanzania is highly focused on natural resources and the country is recognized as a wilderness and safari capital of the East African. In line with that, the country is positioned as one of the top 25 global biodiversity hotspots in terms of the number of endemics species (Travel & Tourism Competitive Report, 2019). Reports show that Tanzania tourism depends much on wildlife attractions as 36.4% of tourists who visit Tanzania, prefer to visit wildlife attractions (Tanzania Tourism Sectoral Survey Report, Citation2019). This is due to the availability of varieties of wildlife areas ranging from national parks, game reserves, game-controlled areas, and conservation areas which offer diverse of experiences to tourists. These areas are the homes of wildlife animals which attracts thousands of first timer and repeat tourists to visit the country for leisure, recreation, and education purposes. Holding those significances, it validate the need to have a clear understanding of this attraction segment especially its driving force to enhance the likelihood of repeated visits in the country (Ayazlar, Citation2017; Moorhouse et al., Citation2017).
Through empirical investigation, it has been established that factors like tourists’ contentment, the quality of services, socio-demographic traits, the perception of destination reputation, tourists’ prior encounters, and the attributes of the destination are identified as precursors to repeat visits within the destination (Matolo et al., Citation2021; Mlozi, Citation2014; Mlozi & Pesämaa, Citation2013; Perovic et al., Citation2018; Tan & Wu, Citation2016; Tosun et al., Citation2015; Wadood et al., Citation2020). To the best of the authors’ knowledge, there is a scarcity of studies conducted on repeat visitation to wildlife attractions in Tanzania. Additionally; the factors that influence tourists to choose wildlife attractions during their repeat visits are not known. Scholars recommended that marketers and tour providers should have a clear understanding of the nature of the market that they save (McKercher et al., Citation2012). This involves having the knowledge of who exactly are these repeat tourists who prefer wildlife attractions during repeat visitation to the country.
According to literature, tourists’ choices within the destination can be controlled by their demographic characteristics (N. Kara, Citation2016; Oh et al., Citation2004; Padrón-Ávila & Hernández-Martín, Citation2019; Tomić et al., Citation2019; Valek et al., Citation2014). In line with that Almeida-Santana and Moreno-Gil (Citation2018) suggested that, for a destination to gain a competitive advantage, tour providers and marketers must thoroughly grasp the characteristics of the market they serve. Tourists choices can be affected by demographic characteristics, such as age, gender, occupation, income (Kattiyapornpong & Miller, Citation2009; N. Kara, Citation2016; Valek et al., Citation2014). Furthermore, in the body of knowledge, little is known about the influence of socio-demographic characteristics on the choice of wildlife attractions among international repeat tourists in Tanzania. Available studies put more focus on the choice of activities (N. Kara, Citation2016); and the choice of wildlife for domestic tourists (Mariki et al., Citation2012).
Therefore, the main interest of the current study is to investigate the influence of demographic characteristics, including age, gender, family size, marital status, occupation, income level, and region of origin on the selection of wildlife attractions among international repeat tourists in Tanzania. The study aims to provide valuable insights into destination planning and marketing strategies in the tourism industry.
2. Literature review
2.1. Wildlife tourism in Tanzania
Wildlife tourism involves travelers journeying from their homes to observe and engage in various activities related to wild animals (Scott & Higginbottom, Citation2004). These activities encompass bird watching, game viewing, and photography, primarily designed to provide tourists with experiences related to wildlife, birds, vegetation, and ecosystems (Curtin & Kragh, Citation2014; Scott & Higginbottom, Citation2004). Moreover, wildlife provides tourists with an opportunity to gain knowledge about biodiversity and the interconnected relationships between animals and plants (Curtin & Kragh, Citation2014; Scott & Higginbottom, Citation2004).
The intersection of tourism and wildlife attractions forms a symbiotic relationship that holds profound implications for both the natural world and the travel industry (Curtin & Kragh, Citation2014). Wildlife attractions act as significant draws for tourists seeking unique and immersive experiences globally (Fennell & Yazdan Panah, Citation2020). People are naturally drawn to observe and interact with wildlife in their natural habitats or well-designed enclosures (Fennell & Yazdan Panah, Citation2020). As a result, these attractions become focal points for tourism campaigns, attracting tourists from around the world (Scott & Higginbottom, Citation2004).
Tanzania’s wildlife tourism stands as a prominent and internationally acclaimed sector, drawing global travelers to engage with the nation’s remarkable natural magnificence and diverse animal life (Wade et al., Citation2001). Positioned in East Africa, Tanzania boasts a spectrum of iconic wildlife species and renowned natural wonders, positioning it as an ideal destination for nature enthusiasts, photographers, and those captivated by the outdoors (Wade et al., Citation2001; Wamboye et al., Citation2020). Among its principal wildlife attractions includes, Serengeti National Park, which is globally recognized as one of the most diverse and well-known conservation areas for wildlife (). The park gains its renown from the annual Great Migration, a remarkable spectacle where expansive herds of wildebeests traverse vast distances in pursuit of fresh grazing, captivating tourists seeking to witness this awe-inspiring event (Eagles et al., Citation2006).
Figure 1. Map showing Tanzania National Parks, game reserves, and conservation areas.
Source: Tanzania National Parks Website.
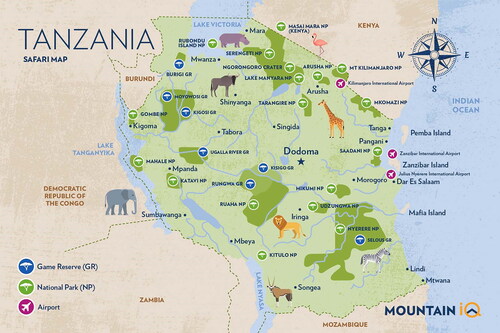
Furthermore, the Ngorongoro Conservation Area emerges as another magnet, encompassing the Ngorongoro Crater, a volcanic caldera that provides a distinctive and varied habitat for an extensive array of wildlife species (). This area is often dubbed the ‘Eighth Wonder of the World’, celebrated for its incredible biodiversity and the harmonious coexistence of human communities alongside wildlife (Masao et al., Citation2015).
Mount Kilimanjaro National Park, while primarily acclaimed for its majestic snow-crowned peak, extends its offerings to encompass wildlife experiences at lower elevations (). Those who journey through its different ecological zones encounter distinct flora and fauna, adding to the allure of the expedition (Adili & Robert, Citation2016). Similarly, the Tarangire National Park distinguishes itself with substantial elephant populations, stately baobab trees, and an array of bird species. Providing an exceptional and less crowded safari venture in comparison to more famed parks, it ensures a distinctive encounter with nature (Sachedina, Citation2006).
Lake Manyara National Park, although relatively compact, garners attention for its abundant biodiversity (). The park plays host to a diverse collection of wildlife, including elephants, giraffes, zebras, buffalo, lions, leopards, and an array of bird species. Notably, the park is acclaimed for its distinctive tree-climbing lions, a phenomenon that adds a unique dimension to the region’s allure (Okello & Yerian, Citation2009).
Therefore, due to the fact that 36.4% of tourists who visit Tanzania prefer to visit wildlife (Tanzania tourism sectoral survey report, Citation2019), it is fruitful to have a clear understanding of traits and their drivers towards visiting wildlife attractions especially for international repeat tourists.
2.2. International repeat tourists’
Tourists who revisit a destination on multiple occasions are commonly referred to as repeat tourists (Juaneda, Citation2016). The term ‘visited destination’ can encompass various locations, including countries, regions, districts, villages, sites, or attractions (Pike, Citation2007). The concept of repeat visitation is rooted in the idea of tourism destination loyalty, which represents a behavioral inclination for a tourist to return to a specific destination (Oppermann, Citation1999). As defined by Oppermann (Citation1999, pp. 78–84), tourism destination loyalty is characterized as ‘a biased (i.e. nonrandom) behavioral response, expressed over time, by an individual with respect to one or more alternative holiday destinations’. It stems from both the psychological tendencies and the attitudes of individuals toward revisiting a destination for future holidays. Consequently, within consumer research, the term ‘customer loyalty’ is frequently gauged through indicators, such as the ‘intent to continue purchasing the same product’, ‘intent to make repeat purchases of the same product’ (behavioral measures), or ‘willingness to recommend the product to others’ (an attitudinal indicator reflecting product advocacy) (Oppermann, Citation1999).
Wildlife tourism and repeat visits are intertwined aspects of the broader travel industry, each influencing and complementing the other in unique ways (Okello & Yerian, Citation2009). Wildlife tourism, which involves experiencing and engaging with natural environments and diverse animal species, often plays a significant role in encouraging repeat visits to specific destinations (Curtin & Kragh, Citation2014; Fennell & Yazdan Panah, Citation2020).
Hence, because of the interrelatedness of these two elements, it is beneficial to gain a more profound comprehension of the attributes and driving factors influencing international repeat tourists when it comes to wildlife experiences.
2.3. Socio-demographic characteristics and the choice of wildlife attraction
From a tourism perspective, socio-demographic factors are defined as a descriptive segmentation technique (Mazilu & Sabrina, Citation2010, p. 159). Socio-demographic variables are normally used as a market segmentation approach, whereby individuals are segmented based on gender, age, region of origin, occupation, education level, income, household size, and family size Mkwizu (Citation2018). According to Kara and Mkwizu (Citation2020) and Mkwizu (Citation2018), age, gender, family life cycle, education, income, and nationality are examples of socio-demographic factors commonly used by tourism experts. These variables are believed to be accurate in describing the tourism market and predicting travel behavior patterns (Hughes, Citation2001).
Traditionally, the studies of destination choices aim to provide the link between a tourist’s characteristics and what the destination has to offer (Kalenjuk, Citation2022; Kattiyapornpong & Miller, Citation2009; M. N. Kara, Citation2016; Mak & Jim, Citation2019). According to Almeida-Santana and Moreno-Gil (Citation2018), it is very important for destination managers and tour providers to understand the nature of the market that they serve. The understanding of this part is very important because it will enable them to design and provide products and services according to the market demand. This will ensure tourist satisfaction and encourage repeat business. Furthermore, based on the aim of this study, the understanding of how tourists’ socio-demographic characteristics influence the choice of wildlife attractions among international repeat tourists is very useful for the country given this competitive edge (Kara & Mkwizu, Citation2020).
Several studies proved the effectiveness of demographic characteristics in predicting tourists decision making in the destination (Almeida-Santana & Moreno-Gil, Citation2018; Mohsin & Ryan, Citation2004; N. Kara, Citation2016; Odunga, Citation2005; Padrón-Ávila & Hernández-Martín, Citation2019; Tomić et al., Citation2019). Focusing on the choice of attractions; studies found that, demographic characteristics have a direct relationship with the choice of specific attractions within the destination. The attractions include those which are related to, sports (Valek et al., Citation2014); shopping (Oh et al., Citation2004); food (Kalenjuk, Citation2022); nature based (Meric & Hunt, Citation1998); Island (Padrón-Ávila & Hernández-Martín, Citation2019); and culture (Kim et al., Citation2007). Demographic characteristics, such as education and income tend to influence tourists’ choice for sports, shopping, nature, island, and cultural attractions. For instance, Padrón-Ávila and Hernández-Martín (Citation2019) found that older tourists had greater probabilities than younger ones of visiting cultural attractions. On another hand, Meric and Hunt (Citation1998) revealed that ecotourists tend to be middle age with higher education and income levels than the tourists who travel for other purposes. In addition apart from age and education Kalenjuk (Citation2022) also found that the tourist’s preferences for local food differ depending on their region of origin. Unlike factors age and gender has a major influence on individual shopping behavior (Oh et al., Citation2004).
Generally, In the body of literature, there are plenty of studies that explain the relationship between tourist’s socio-demographic characteristics and destination offerings. Focusing on the influence of demographic characteristics on the choice of wildlife attractions among international repeat tourists is the main focus of this study. There is a limited study that has been conducted on this area, especially in Tanzania context. Previous studies failed to capture how tourists’ socio-demographic characteristics, such as age, gender, family size, marital status, occupation, income level, and region of origin can influence the choice of wildlife attractions among international repeat tourists in Tanzania as a Tourist destination. Understanding this relationship will enable tourism marketers and tour providers to have a clear understanding of the market that they serve based on their socio-demographic characteristics.
3. Methods
3.1. Research design, study area, and sample size
The study employs a cross-sectional research design to collect data from international tourists who make repeat visits to Tanzania. In a broader sense, a cross-sectional design involves gathering data from a subgroup of a population at a single point in time (Mann, Citation2003). This approach offers significant advantages in terms of time and cost efficiency, making it particularly suitable for research involving multiple variables and a large number of participants.
3.2. Sampling design and data collection
This paper aims to present the findings of survey data collected from a sample of 1550 international repeat tourists during the period spanning from November 2022 to August 2023. This period covers two tourism seasons in Tanzania; high and low season. The collection of data for both seasons enables the researcher to get the diversity of tourist’s preferences in terms of attractions from different seasons. Additionally, M. N. Kara (Citation2016) recommended that tourists who travel in different seasons might be different in terms of their choice behavior within the destination.
A convenience sampling procedure was employed to get the appropriate respondents for the study. It is known that convenience sampling has inherent limitations, primarily related to potential sampling biases and constraints in data collection. To reduce these limitations Ferber (Citation1977) and M. N. Kara (Citation2016) noted that convenience sampling is one of the forms of non-probability sampling which can be used when there is a control in the research design to reduce the impact of non-random sampling by making sure that the generated findings are from the true representative of the population. To enhance that, the data were collected from the major International Airports in Tanzania. These airports are known as the major exit point for international tourists (Tanzania Tourism Sectoral Survey Report, Citation2019). Therefore, the chances of having a significant effect on the results for not adopting a probability sampling technique are very high. Additionally, convenience sampling is one of the appropriate sampling techniques to be used when collecting data from actual tourist settings. Other studies that used convenient sampling include the study conducted by M. N. Kara (Citation2016) which assesses the influence of socio-demographic characteristics on tourists’ choices of activities in the Tanzania Northern Circuit. Also Mgonja et al. (Citation2017) employed a convenience sampling method to assess international visitors’ perceptions about local foods in Tanzania.
The questionnaire survey was disseminated using a drop-and-pick approach at three key international airports: Julius Nyerere International Airport (JNIA), Kilimanjaro International Airport (KIA), and Abeid Aman Karume International Airport (AAKIA). These airports were chosen because they serve as the primary exit points for international tourists visiting both Tanzania Mainland and Zanzibar. International tourists who were found at the departure lounge were approached conveniently and kindly asked to take part in the survey exercise. The main intention of the study was introduced to tourists and the decision to participate in the study was left entirely to tourists. Therefore, tourists who agreed to participate in the study were given a survey questionnaire to fill.
To ensure a variety of responses and avoid redundancy, in cases where tourists traveled as a group, a single respondent was chosen from each group to represent the collective views. According to this study travel group were the group of tourists who plan and travel together without anyone left behind thought the whole trip. Every group that entered the departure terminal was traced by a researcher. Once the group made it through security check and seat at the departure lounge, one person was requested to fill out the survey on behalf of other members.
International repeat tourists who were found at the departure lounge at the time the researcher was collecting data were considered as a sample. Because the study covered two seasons, the researcher managed to collect data from 1594 respondents. Forty-four respondents didn’t fill the questionnaire effectively therefore those questionnaires were discarded as incomplete. Therefore, the remaining 1550 completed questionnaires were used for analysis.
3.3. Variable measurements
The questionnaire was divided into two major parts. The general information about respondents including their Socio-demographic details, such as age, sex, family size, region of origin, marital status, educational attainment, and income level, was collected in the first part. These demographic variables were selected firstly; due to limited studies conducted on their implications on the choice of wildlife pattern in the context of Tanzania as explained previously. Secondly; the chosen demographic characteristics are considered to be more effective in segmenting tourists in relation to their behavior within the destination (Kara & Mkwizu, Citation2020; M. N. Kara, Citation2016; Ma et al., Citation2018). Therefore, by assessing the influence of the selected demographic characteristics on the choice of wildlife attractions marketers and promoters will be able to segment wildlife repeat tourists based on their family size, employment status, income level, and region of origin.
The dependent variable was measured as a binary variable ‘0 or 1’. 0 stands for otherwise and 1 stands for the act of tourists to choose wildlife attractions during their repeat visit to Tanzania. It also represents only a behavior of returning for subsequent visits, aligning with previous research in this domain (Alegre & Cladera, Citation2006; Kastenholz et al., Citation2013).
Before carrying out the exercise of data analysis, several diagnoses were tested to validate the assumptions underlying the binary logistic regression model as follows:
3.4. Diagnostic checks
Diagnostics play a crucial role in assessing the assumptions of a binary logistic regression before fitting the model. These assumptions, including linearity of logit (log odds), no perfect multicollinearity, and no influential outliers, are essential for providing reliable estimates of the binary logistic regression model. In this study, diagnostic checks were performed to ensure that any violations of the assumptions were identified and addressed appropriately before fitting the binary logistic regression model.
3.4.1. Linearity of logit (log odds)
This assumption requires that the relationship between the continuous independent variables and the log odds of the dependent variable is linear. The Box-Tidwell transformation is a useful diagnostic tool in logistic regression for assessing the linearity assumption and determining if additional model adjustments are needed, hence was used to check for linearity of logit in this study. To assess the linearity of logit we examine the significance of the transformed continuous independent variables in the model. If the transformed variable is significant, it suggests that the relationship between the original independent variables and the log odds of the dependent variable is not linear. In this case, the transformed variable (age of respondent) was not significant (p = 0.491), indicating linearity of logit as shown in below.
Table 1. Multiple binary logistic regression model with the Box-Tidwell transformation.
3.4.2. Multicollinearity
Variance Inflation Factor (VIF) and Tolerance values were used to assess the presence of multicollinearity. High VIF values for independent variables suggest multicollinearity, indicating that certain variables are highly correlated. VIF values <10 (ideally close to 1) and Tolerance values >0.1 are generally considered acceptable. In this case, the VIF and Tolerance values are reasonable, indicating no severe multicollinearity issues as shown in below.
Table 2. Collinearity statistics.
3.4.3. Outlier and influential data points
Cook’s distance, Mahalanobis distance, standard and studentized residuals were used to assess the presence of outlier and influential data points. Based on Cook’s and Mahalanobis distance, the points with high Cook’s and Mahalanobis distance were considered influential. In our case, a relatively small distance ranging from 0.000 to 0.039 and from 0.147 to 10.897 for Cook’s and Mahalanobis distance, respectively was observed, suggesting no influential outliers.
Moreover, standardized residuals, which indicate the number of standard deviations an observation’s residual deviates from the mean, exhibit a range from −2.774 to 2.711 suggesting the absence of potential outliers. Likewise, studentized residuals, accounting for leverage, display a range of −2.789–2.739 suggesting no potential outlier (see below).
Table 3. Residuals statistics.
3.5. Data analysis
In this study, the primary analytical method employed is binary logistic regression, aiming to deepen our comprehension of how socio-demographic characteristics influence the choice of wildlife attraction by international repeat tourists in Tanzania. This model is used, due to the nature of the dependent variable, namely a binary variable (Hair et al., Citation1998), to distinguish between the choice of wildlife as the pattern to repeat instead of other attraction patterns. Variables, such as sociodemographic background were incorporated as independent variables within the logistic regression model to evaluate their influence on the selection of wildlife attractions during repeat visits.
3.5.1. Goodness of fit test
The Hosmer-Lemeshow test was used to assess how well our logistic regression model fits the data by comparing the observed and expected frequencies in different groups. In our case, the Hosmer-Lemeshow with a p-value of 0.678, which is greater than the typical significance level of 0.05 was observed, suggesting that there is no significant lack of fit in the model, meaning that the model fits the data well (see below).
Table 4. Findings of Hosmer-Lemeshow test for goodness-of-fit.
3.6. Ethical considerations
The study followed ethical procedures, which involved acquiring introductory letters from the University of Dodoma Ethical Committee and securing permission to gather data from three airports (Julius Nyerere International Airport, Kilimanjaro International Airport, and Abeid Amani Karume International Airport). Involved participants were provided with a written consent form that clearly outlined the research’s primary objectives and underscored the significance of their voluntary participation in contributing to the study’s success. The written consent form explicitly stated participants’ autonomy to withdraw from the study at any point, ensuring their involvement remained entirely voluntary.
4. Results and discussion
4.1. Results from multiple binary logistic regression model
The results obtained from the multiple binary logistic regression analysis provide valuable insights into how demographic factors influence the preferences of international repeat tourists for wildlife attractions (). The estimated coefficient for age was negatively associated with the choice of wildlife attraction among repeat tourists , suggesting that for each one-year increase in age, the log odds of selecting wildlife attractions decrease by 0.00089 while all other factors are kept constant. This effect was not statistically significant (p = 0.871) as the 95% confidence interval does include zero ([−0.01162, 0.00984]). It’s possible that the appeal of wildlife attractions transcends age boundaries, with people of all ages showing a similar level of interest in these attractions. This universal appeal could be due to the intrinsic value of nature and wildlife, which is appreciated across different age groups. Similarly, when keeping other factors constant, the estimated coefficient for ‘Married’ and ‘Others’ were positively associated with the selection of wildlife attractions
, suggesting that married tourists or those having a different marital status had slightly higher log odds of selecting wildlife attractions compared to single individuals. This association was not statistically significant (p = 0.659 and p = 0.929, respectively) as the 95% confidence interval does include zero ([−0.22649, 0.35819] and [−0.55486, 0.60781], respectively). This inclination may be attributed to the propensity of married couples to allocate their leisure time to travel outside their usual environment during holiday periods. This aligns with research conducted by Shuai et al. (Citation2022) indicating that, recently married couples often engage in global leisure travel by visiting varieties of tourist attractions before assuming the responsibilities of parenthood.
Table 5. Findings from the multiple binary logistic regression model regarding the demographic characteristics influencing the selection of wildlife attractions.
Regarding household size, the estimated coefficient for households with <3 members were , indicating that individuals in households with fewer than 3 members have statistically lower log odds of selecting wildlife attractions compared to those in households with more than 3 members (p < 0.001, 95% CI [−1.08977, −0.54391]) while all other factors kept constant. This suggests that with every one-unit change in the number of family members, international repeat tourists from smaller families are less inclined to choose wildlife-related activities compared to those from larger families. Furthermore, the outcomes of the cross-tabulation indicate a correlation between tourists residing with more than three family members and their choice of wildlife (). This underscores the potential for family-centric tourism experiences, particularly in activities centered around wildlife, especially appealing to repeat tourists who are retired. A study conducted by Lyngdoh et al. (Citation2017) found that family composition plays a pivotal role in shaping tourists’ decisions to revisit their destinations. Larger families, for example, tend to have a greater inclination to revisit wildlife attractions, as these venues offer unique opportunities for family bonding, educational experiences, and lasting memories. Therefore, destinations rich in wildlife can create packages and activities designed to accommodate larger family groups, making the destination more appealing to this segment.
Table 6. Cross tabulation between tourists’ choices and family size tourists.
Additionally, the coefficients associated with tourists earning annual incomes in the range of 30,000 USD to 49,999 USD and 50,000 USD to 69,999 USD are , respectively). These coefficients of odds are both statistically significant, with p-values of 0.015 and 0.000, respectively as the 95% confidence interval does include Zero [0.11012, 1.00723] and [0.40332, 1.39098], respectively (). This indicates that, as the income level changes by one unit for the tourists falling within the income level between 30,000 USD to 49,999 USD and 50,000 USD to 69,999 USD, they become more inclined to choose wildlife-related activities compared to repeat tourists with incomes below 30,000 USD. This phenomenon may be linked to the tendency of tourists, as their income increases, to opt for more upscale destinations for their return trips, with wildlife habitats emerging as a notable preference. Vining’s (Citation2003), suggested that nature-based activities, particularly those involving animals, have evolved into activities of sentimental luxury. Hence, as income increases, tourists exhibit a preference for such activities (Suresh et al., Citation2022). Therefore, wildlife tour providers and marketers should ensure that they design and advertise wildlife which is connected with luxurious activities to attract repeat tourists.
Moreover, the coefficient of odds associated with tourists who are retired is . These findings suggest that for every one-unit change in employment status, tourists who are retired increase their likelihood of choosing wildlife experiences compared to those who are employed (p < 0.001, 95% CI [0.07151, 0.90292]). This might be due to the fact that, tourists who are retired they normally tend to find quiet places for relaxation as a result of their age group and wildlife become suitable places for them. This is also supported by Mutanga et al. (Citation2017) who highlighted that older tourists most prefer to repeat in wildlife tourism destinations.
Furthermore, the coefficients associated with tourists originating from North America, Asia are , respectively). These coefficients of odds are both statistically significant, with p-values of 0.015 and 0.022, respectively as 95% confidence interval does include Zero [0.12927, 1.19109] and [0.12710, 1.63043], respectively. These findings suggest that with a one-unit change in the region of origin for tourists, international repeat tourists hailing from North America and Asia exhibit an increased likelihood of choosing wildlife-related activities compared to repeat tourists from Europe. Additionally, repeat tourists who are from South America decrease their likelihood of choosing wildlife compared to those who are from Europe who are from Europe. The act of strong preference for wildlife attractions for tourists who are from North America and Asia might be attributed to its diverse and abundant wildlife, including iconic species like elephants, lions, and wildebeests. Therefore, tourists in these regions may be attracted to see and experience the unique and rich biodiversity that Tanzania has to offer. The study conducted by Wade et al. (Citation2001) reveals that tourists from North America exhibit a higher demand for visiting wildlife attractions in Tanzania.
4.2. Cross tabulation results
Cross-tabulation offers a comprehensive insight into the specific demographic traits that should be emphasized when aiming to attract repeat tourists to wildlife attractions. The results from cross-tabulation revealed a connection between tourists’ income levels (), employment status (), and their preference for wildlife attractions. It was observed that repeat tourists with an income level of 69,999 USD and those who are retired show a stronger preference for wildlife attractions. Analyzing the interaction between income level and variables, such as family size and employment status offers marketers valuable information about specific segments to focus on in their marketing strategies, ultimately improving the promotion of wildlife attractions and increasing the number of repeat tourists.
Table 7. Cross tabulation between tourists’ choices and income level.
Table 8. Cross tabulation between tourists’ choices and occupation.
4.3. Robustness checks
The results in section 4 clearly indicate that international repeat tourists from smaller families are less inclined to choose wildlife-related activities compared to those from larger families and they even possess a lower likelihood of choosing wildlife attractions when they have sufficient earning income (60,000 and above USD). We wondered whether this correlation might be driven by a confounding factor. For example, perhaps repeat tourists from smaller families who are found in groups with sufficient income are themselves earn less income (poorer) than the ones with larger families who deemed wealthier. We therefore confirmed the robustness of our results from section 4 by running a secondary analysis using only international repeat tourists from smaller families, i.e. those tourists residing with <3 family members. The results for this subset of repeat tourists are very consistent with our main analysis, indicating that our results are robust to this concern. The results of this secondary analysis are available in .
Table 9. Choice of wildlife attraction among international repeat tourists residing with only small families (i.e. those tourists residing with <3 family members) and possess lower (<60,000 USD) and higher earning income (adjusted logit).
5. Conclusion and recommendation
The findings from this study shed light on several influential factors, including repeat tourists’ demographic characteristics which shape tourists’ decisions. Notably, family size, income level, Employment status, and Regions of origin exhibit a predilection for wildlife attraction. These insights underscore the importance of a nuanced understanding of tourist preferences for destination planners and marketers.
Several recommendations can be made for destination managers and policymakers in Tanzania, such as tailored marketing strategies that should be employed to target specific demographic segments. These strategies might involve crafting promotions and experiences that resonate with tourists with above than 3 members in their family, with an income level between 30,000 and 70,000 USD, individuals who are retired, and those who are coming from Asia and North America.
Therefore, the understanding the multifaceted aspects of international repeat tourists’ choice regarding wildlife attraction provides a strategic advantage for Tanzania’s tourism industry. By acting on these recommendations and staying attuned to evolving trends, Tanzania can continue to be a premier destination for international repeat tourists while harmonizing growth with responsible environmental stewardship and community welfare.
6. Study implications
6.1. Theoretical implications
This study contributes knowledge to the field of tourism, especially in the aspect of wildlife attraction choices, which is the most favored pattern by repeat tourists in Tanzania. It also provides more insights into the nature of repeat tourists who prefer to pay their repeat visits in this attraction segment by focusing on their demographic characteristics.
6.2. Managerial implications
Marketers and promoters of tourist attractions can enhance their understanding of loyal customers by gaining insights into their age, marital status, income level, educational background, and region of origin, particularly those exhibiting loyalty to wildlife attractions. This knowledge will enable them to effectively engage with these customers, fostering stronger connections and maintaining their loyalty to wildlife attractions in Tanzania.
7. Limitation of the study and future research area
The study focuses on wildlife attractions, which may not fully represent the diversity of international repeat tourists’ preferences in Tanzania. Future research could expand to include a more extensive range of other patterns including culture, beach, and mountain destinations. State the current study adopted a cross-sectional design therefore conducting longitudinal studies would allow researchers to track changes in tourists’ preferences over time and provide more robust insights into the evolution of repeat tourism patterns.
Addressing these limitations and exploring these future research areas can contribute to a more comprehensive understanding of international repeat tourists’ choice patterns and help destination managers make informed decisions to attract and retain tourists.
Author contributions
Betty A. Begashe was involved in the conceptualization and design, analysis, interpretation of results, and drafting of the manuscript under the supervision of John T. Mgonja and Salum Matotola. Both Salum Matotola and John T. Mgonja were engaged in reviewing the manuscript and granting approval for submission.
Disclosure statement
No potential conflict of interest was reported by the author(s).
Data availability statement
This study utilized a dataset, and it can be provided upon request.
Additional information
Funding
Notes on contributors
Betty Amos Begashe
Betty Amos Begashe is a PhD candidate at the University of Dodoma-UDOM, Tanzania. She holds a position as an assistant lecturer in the Department of Business Administration and Management at the University of Dodoma-UDOM. Her research interests primarily focus on Tourism Management, Hospitality Management, Tourism Marketing and Destination development.
Salum Matotola
Salum Matotola is a Lecturer in the field of Marketing, Business, Management and Entrepreneurship at the University of Dodoma. He has acquired his PhD in Entrepreneurship at the University of Dodoma-UDOM. His current research areas include small business development, entrepreneurship, marketing and Business management.
John Thomas Mgonja
John Thomas Mgonja is currently an Associate Professor in tourism studies at the College of Forestry, Wildlife and Tourism at Sokoine University of Agriculture, Tanzania. He received his PhD from Parks, Recreation and Tourism Management Department from Clemson University, South Carolina, USA. His current research is mainly about sustainable tourism in developing countries, ecotourism, community-based tourism and local food–tourism linkages.
References
- Adili, Y. Z., & Robert, H. N. (2016). Economic valuation of recreation use value of Kilimanjaro National Park, Tanzania. Journal of Ecosystem & Ecography, 6(220), 2. https://doi.org/10.4172/2157-7625.1000220
- Ahmed, I., & Jahan, N. (2013). Rural tourism-prospects in rustic Bengal. European Journal of Business and Management, 5(16), 1–16.
- Alegre, J., & Cladera, M. (2006). Repeat visitation in mature sun and sand holiday destinations. Journal of Travel Research, 44(3), 288–297. https://doi.org/10.1177/0047287505279005
- Alegre J., & Juaneda, C. (2006). Destination loyalty: Consumers’ economic behavior. Annals of Tourism Research, 33(3), 684e706. https://doi.org/10.1016/j.annals.2006.03.014.
- Almeida-Santana, A., & Moreno-Gil, S. (2018). Understanding tourism loyalty: Horizontal vs. destination loyalty. Tourism Management, 65, 245–255. https://doi.org/10.1016/j.tourman.2017.10.011
- Ayazlar, A. R. (2017). Major wildlife attractions and choices in Turkey and the tourists’ reports about their experiences and learning in this tourism niche. Geoheritage, Geoparks and Geotourism, 195–209.
- Čaušević, A., Mirić, R., Drešković, N., & Hrelja, E. (2020). First-time and repeat visitors to Sarajevo. European Journal of Tourism, Hospitality and Recreation, 10(1), 14–27. https://doi.org/10.2478/ejthr-2020-0002
- Curtin, S., & Kragh, G. (2014). Wildlife tourism: Reconnecting people with nature. Human Dimensions of Wildlife, 19(6), 545–554. https://doi.org/10.1080/10871209.2014.921957
- Eagles, P. F. J., Eagles, P. F. J., & Wade, D. (2006). Tourism in Tanzania: Serengeti National Park. Bois et forêts des tropiques, 290(4), 73–80.
- Fennell, D. A., & Yazdan Panah, H. (2020). Tourism and wildlife photography codes of ethics: Developing a clearer picture. Annals of Tourism Research, 85(March), 103023. https://doi.org/10.1016/j.annals.2020.103023
- Ferber, R. (1977). Research by convenience. Journal of Consumer Research, 4(1), 57–58. https://doi.org/10.1086/208679
- Hair, J. F., Jr., Anderson, R. E., Tatham, R. L., & Black, W. C. (1998). Multivariate data analysis (5th ed.). Prentice-Hall.
- Hughes, P. (2001). Book Review: Marine tourism: Development, impacts and management. Tourist Studies, 1(3), 323–325. https://doi.org/10.1177/146879760100100311
- Kalenjuk, B. (2022). Socio-demographic characteristics as determinants of student engagement. Ceeol.Com, 21(3), 179–189. https://www.ceeol.com/search/article-detail?id=1085026
- Kara, M. N. (2016). The influence of travel motivation and personality on preference for travel activities among local and international tourists in Tanzania (Vol. 5, Issue 4). The University of Nottigham Malaysia Campus.
- Kara, N. (2016). Demographic factors and preference for travel activities among tourists in Tanzania. International Journal of Science Arts and Commerce, 1(3), 9–26. www.ijsac.net
- Kara, N. S., & Mkwizu, K. H. (2020). Demographic factors and travel motivation among leisure tourists in Tanzania. International Hospitality Review, 34(1), 81–103. https://doi.org/10.1108/IHR-01-2020-0002
- Kastenholz, E., Eusébio, C., & Carneiro, M. J. (2013). Studying factors influencing repeat visitation of cultural tourists. Journal of Vacation Marketing, 19(4), 343–358. https://doi.org/10.1177/1356766713478297
- Kattiyapornpong, U., & Miller, K. E. (2009). Socio-demographic constraints to travel behavior. International Journal of Culture, Tourism and Hospitality Research, 3(1), 81–94. https://doi.org/10.1108/17506180910940360
- Kim, H., Cheng, C. K., & O’Leary, J. T. (2007). Understanding participation patterns and trends in tourism cultural attractions. Tourism Management, 28(5), 1366–1371. https://doi.org/10.1016/j.tourman.2006.09.023
- Lim, Y. J., Kim, H. K., & Lee, T. J. (2016). Visitor motivational factors and level of satisfaction in wellness tourism: Comparison between first-time visitors and repeat visitors. Asia Pacific Journal of Tourism Research, 21(2), 137–156. https://doi.org/10.1080/10941665.2015.1029952
- Lyngdoh, S., Mathur, V. B., & Sinha, B. C. (2017). Tigers, tourists and wildlife: Visitor demographics and experience in three Indian tiger reserves. Biodiversity and Conservation, 26(9), 2187–2204. https://doi.org/10.1007/s10531-017-1352-6
- Ma, A. T. H., Chow, A. S. Y., Cheung, L. T. O., Lee, K. M. Y., & Liu, S. (2018). Impacts of tourists’ sociodemographic characteristics on the travel motivation and satisfaction: The case of protected areas in South China. Sustainability, 10(10), 3388. https://doi.org/10.3390/su10103388
- Mak, B. K. L., & Jim, C. Y. (2019). Linking park users’ socio-demographic characteristics and visit-related preferences to improve urban parks. Cities, 92, 97–111. https://doi.org/10.1016/j.cities.2019.03.008
- Mann, C. J. (2003). Observational research methods. Research design II: Cohort, cross sectional, and case-control studies. Emergency Medicine Journal: EMJ, 20(1), 54–60. https://doi.org/10.1136/emj.20.1.54
- Mariki, S., Hassan, S., Maganga, S., Modest, R., & Salehe, F. (2012). Wildlife-based domestic tourism in Tanzania: Experiences from northern tourist circuit. Ethiopian Journal of Environmental Studies and Management, 4(4), 62–73. https://doi.org/10.4314/ejesm.v4i4.8
- Masao, C. A., Makoba, R., & Sosovele, H. (2015). Will Ngorongoro Conservation Area remain a world heritage site amidst increasing human footprint?. International Journal of Biodiversity and Conservation, 7(9), 394–407. https://doi.org/10.5897/IJBC2015.0837
- Matolo, R. J., Salia, P. J., & Ndibalema, V. G. (2021). Determinants of international tourists’ destination loyalty: Empirical evidence from Serengeti National Park in Tanzania. African Journal of Hospitality, Tourism and Leisure, 10(3), 821–838. https://doi.org/10.46222/ajhtl.19770720-134
- Mazilu, M., & Sabrina, M. (2010). Demographic, social, economic and geographic features – Shaping factors of the tourist market. Romanian Economic and Business Review, 5(1), 159.
- McKercher, B., Denizci-Guillet, B., & Ng, E. (2012). Rethinking loyalty. Annals of Tourism Research, 39(2), 708–734. https://doi.org/10.1016/j.annals.2011.08.005
- Meric, H. J., & Hunt, J. (1998). Ecotourists’ motivational and demographic characteristics: A case of North Carolina travelers. Journal of Travel Research, 36(4), 57–61. https://doi.org/10.1177/004728759803600407
- Mgonja, J. T., Backman, K. F., Backman, S. J., Moore, D. W. D., & Hallo, J. C. (2017). A structural model to assess international visitors’ perceptions about local foods in Tanzania. Journal of Sustainable Tourism, 25(6), 796–816. https://doi.org/10.1080/09669582.2016.1250768
- Mkwizu, K. H. M. (2018). Media and source markets for domestic tourism in Tanzania: Study of Kitulo National Park. International Journal of Innovative Research and Development, 7(2), 107–112. https://doi.org/10.24940/ijird/2018/v7/i2/FEB18026
- Mlozi, S. (2014). Loyalty program in Africa: Risk-seeking and risk-averse adventurers. Tourism Review, 69(2), 137–157. https://doi.org/10.1108/TR-10-2013-0057
- Mlozi, S., & Pesämaa, O. (2013). Adventure tourist destination choice in Tanzania. Current Issues in Tourism, 16(1), 63–95. https://doi.org/10.1080/13683500.2011.647807
- Mohsin, A., & Ryan, C. (2004). Determinants of destination choice: The role of socio-demographic variables. Tourism Recreation Research, 29(3), 27–33. https://doi.org/10.1080/02508281.2004.11081454
- Moorhouse, T. P., D’Cruze, N. C., & Macdonald, D. W. (2017). The effect of priming, nationality and greenwashing on preferences for wildlife tourist attractions. Global Ecology and Conservation, 12, 188–203. https://doi.org/10.1016/j.gecco.2017.11.007
- Musembi, N. K., Ngugi, L., & Bichage, M. (2020). Service tangibility on repeat visits in two-five star rated hotels in Nairobi County. International Journal of Research in Business and Social Science, 9(5), 333–340. https://doi.org/10.20525/ijrbs.v9i5.881
- Mutanga, C. N., Vengesayi, S., Chikuta, O., Muboko, N., & Gandiwa, E. (2017). Travel motivation and tourist satisfaction with wildlife tourism experiences in Gonarezhou and Matusadona National Parks, Zimbabwe. Journal of Outdoor Recreation and Tourism, 20, 1–18. https://doi.org/10.1016/j.jort.2017.08.001
- Odunga, P. (2005). Choice of attractions, expenditure and satisfaction of international tourists to Kenya. 205. https://library.wur.nl/WebQuery/wurpubs/fulltext/121685
- Oh, J. Y., Cheng, C., Lehto, X. Y., & Leary, J. T. O. (2004). Predictors of tourists’ shopping behaviour: Examination of socio-demographic characteristics and trip typologies. Journal of Vacation Marketing, 10(4), 308–319. https://doi.org/10.1177/135676670401000403
- Okamura, K., & Fukushige, M. (2010). Differences in travel objectives between first-time and repeat tourists: An empirical analysis for the Kansai area in Japan. International Journal of Tourism Research, 12(6), 647–664. https://doi.org/10.1002/jtr.780
- Okello, M. M., & Yerian, S. (2009). Tourist satisfaction in relation to attractions and implications for conservation in the protected areas of the Northern Circuit, Tanzania. Journal of Sustainable Tourism, 17(5), 605–625. https://doi.org/10.1080/09669580902928450
- Olalere, F. E. (2019). Intangible cultural heritage as tourism product: The Malaysia experience. African Journal of Hospitality, Tourism and Leisure, 8(3), 1–10.
- Oppermann, M. (1999). Predicting destination choice – A discussion of destination loyalty. Journal of Vacation Marketing, 5(1), 51–65. https://doi.org/10.1177/135676679900500105
- Oppermann, M. (2000). Tourism destination loyalty. Journal of Travel Research, 39(1), 78–84. https://doi.org/10.1177/004728750003900110
- Padrón-Ávila, H., & Hernández-Martín, R. (2019). Preventing overtourism by identifying the determinants of tourists’ choice of attractions. Sustainability, 11(19), 5177. https://doi.org/10.3390/su11195177
- Perovic, Ð., Moric, I., Pekovic, S., Stanovcic, T., Roblek, V., & Pejic Bach, M. (2018). The antecedents of tourist repeat visit intention: Systemic approach. Kybernetes, 47(9), 1857–1871. https://doi.org/10.1108/K-12-2017-0480
- Pike, S. (2007). Destination marketing organisations. In Destination marketing. Routledge. https://doi.org/10.4324/9780080568935-7
- Sachedina, H. (2006). Livelihoods in the Tarangire ecosystem of Tanzania: Increasing incentives for non-conservation compatible land use change through conservation policy. … and Poverty Reduction in East Africa: A Policy … http://scholar.google.com/scholar?hl=en&btnG=Search&q=intitle:Conservation,+Land+Rights+and+Livelihoods+in+the+Tarangire+Ecosystem+of+Tanzania:+Increasing+incentives+for+non-conservation+compatible+land+use+change+through+conservation+policy#0
- Scott, N., & Higginbottom, K. (2004). Wildlife tourism: A strategic destination analysis. Wildlife Tourism: Impacts, Management and Planning, 253–275. https://www.researchgate.net/publication/40871766_Wildlife_Tourism_a_strategic_destination_analysis
- Shuai, M., Liu, C., Ahmed, F., & Wang, R. (2022). Analysis on the change of tourists’ leisure agricultural tourism behavior and the influence of individual intrinsic characteristics. Asia Pacific Management Review, 27(2), 115–119. https://doi.org/10.1016/j.apmrv.2021.06.001
- SIA. (2020). South Africa international performance report.
- Suresh, K., Wilson, C., Quayle, A., Khanal, U., & Managi, S. (2022). Which national park attributes attract international tourists? A Sri Lankan case study. Tourism Economics, 28(7), 1848–1871. https://doi.org/10.1177/13548166211019865
- Tan, W. K., & Wu, C. E. (2016). An investigation of the relationships among destination familiarity, destination image and future visit intention. Journal of Destination Marketing & Management, 5(3), 214–226. https://doi.org/10.1016/j.jdmm.2015.12.008
- Tanzania Tourism Sectoral Survey Report. (2019).
- Tomić, S., Leković, K., & Tadić, J. (2019). Consumer behaviour: The influence of age and family structure on the choice of activities in a tourist destination. Economic Research-Ekonomska Istraživanja, 32(1), 755–771. https://doi.org/10.1080/1331677X.2019.1579663
- Tosun, C., Dedeoğlu, B. B., & Fyall, A. (2015). Destination service quality, affective image and revisit intention: The moderating role of past experience. Journal of Destination Marketing & Management, 4(4), 222–234. https://doi.org/10.1016/j.jdmm.2015.08.002
- Travel and Tourism Competitive Report (2019).
- TRI. (2020). Kenya tourism sectoral-survey report (TES ).
- UNWTO. (2021). Tourism data.
- Valek, N. S., Shaw, M., & Bednarik, J. (2014). Socio-demographic characteristics affecting sport tourism choices: A structural model. Acta Gymnica, 44(1), 57–65. https://doi.org/10.5507/ag.2014.006
- Vining, J. (2003). The connection to other animals and caring for nature. Human Ecology Review, 10(2), 87–99.
- Wade, D. J., Mwasaga, B. C., & Eagles, P. F. J. (2001). A history and market analysis of tourism in Tanzania. Tourism Management, 22(1), 93–101. https://doi.org/10.1016/S0261-5177(00)00019-4
- Wadood, M. A., Mamun, A. S. M. A., Rafi, M. A., Islam, M., Kamrul Mohd, S., Lee, L. L., & Hossain, M. G. (2020). Knowledge, attitude, practice and perception regarding COVID-19 among students in Bangladesh: Survey in Rajshahi University. medRxiv. https://doi.org/10.1101/2020.04.21.20074757
- Wamboye, E. F., Nyaronga, P. J., & Sergi, B. S. (2020). What are the determinant of international tourism in Tanzania? World Development Perspectives, 17, 100175. https://doi.org/10.1016/j.wdp.2020.100175